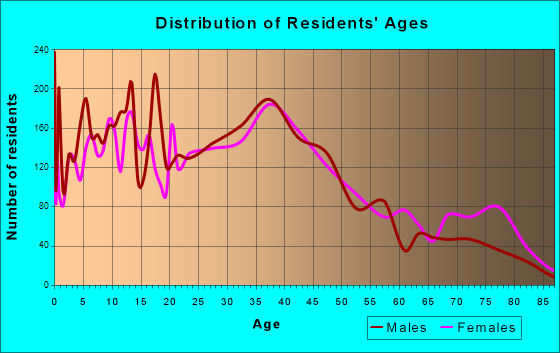
Hazel Park, MI (Michigan) Houses and Residents
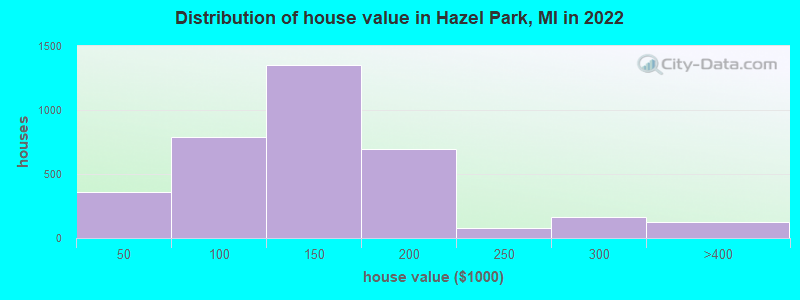
Estimated median house or condo value in 2022: $141,256 (it was $77,100 in 2000 )
Hazel Park:
$141,256Michigan:
$224,400
Lower value quartile - upper value quartile: $102,015 - $170,829Total population: 16,604 (All urban)
Houses: 7,334 (6,898 occupied: 4,120 owner occupied, 2,779 renter occupied )
% of renters here:
40%State:
27%
Housing density: 2,602 houses/condos per square mile
Median price asked for vacant for-sale houses and condos in 2022: $230,820.
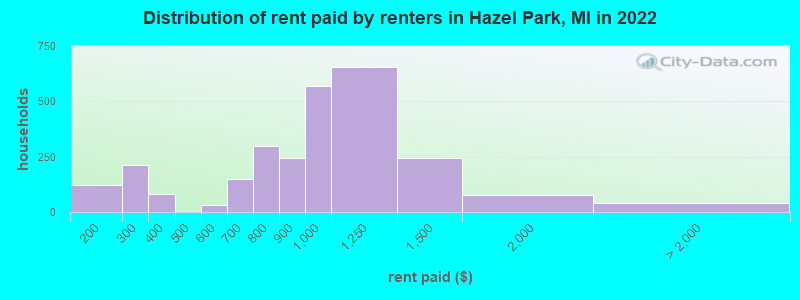
Median contract rent in 2022: $954 (lower quartile is $753, upper quartile is $1,174)
Median rent asked for vacant for-rent units in 2022: $892
Median gross rent in Hazel Park, MI in 2022: $1,182
Housing units in Hazel Park with a mortgage: 2,365 (146 second mortgage, 0 home equity loan, 74 both second mortgage and home equity loan )Houses without a mortgage: 131
Median household income for houses/condos with a mortgage: $70,782
Median household income for apartments without a mortgage: $47,950
Median monthly housing costs: $982
Data:
Median house or condo value ($)
Median house or condo value ($ change since 2000)
Median house or condo value ($) - White
Median house or condo value ($) - Black or African American
Median house or condo value ($) - Asian
Median house or condo value ($) - Hispanic or Latino
Median house or condo value ($) - American Indian and Alaska Native
Median house or condo value ($) - Multirace
Median house or condo value ($) - Other Race
Median price asked for mobile homes ($)
Household density (households per square mile)
Mean house or condo value by units in structure - 1, detached ($)
Mean house or condo value by units in structure - 1, attached ($)
Mean house or condo value by units in structure - 2 ($)
Mean house or condo value by units in structure by units in structure - 3 or 4 ($)
Mean house or condo value by units in structure - 5 or more ($)
Mean house or condo value by units in structure - Boat, RV, van, etc. ($)
Mean house or condo value by units in structure - Mobile home ($)
Median contract rent ($)
Median contract rent - Lower quartile ($)
Median contract rent - Upper quartile ($)
Median gross rent ($)
Urban houses (%)
Rural houses (%)
Houses occupied (%)
Houses occupied (% change since 2000)
Houses owner occupied (%)
Houses owner occupied (% change since 2000)
Houses renter occupied (%)
Houses renter occupied (% change since 2000)
Vacant housing units - For rent (%)
Vacant housing units - For rent (% change since 2000)
Vacant housing units - For sale only (%)
Vacant housing units - For sale only (% change since 2000)
Vacant housing units - Rented or sold, not occupied (%)
Vacant housing units - Rented or sold, not occupied (% change since 2000)
Vacant housing units - For seasonal, recreational, or occasional use (%)
Vacant housing units - For seasonal, recreational, or occasional use (% change since 2000)
Vacant housing units - For migrant workers (%)
Vacant housing units - For migrant workers (% change since 2000)
Vacant housing units - Other vacant (%)
Vacant housing units - Other vacant (% change since 2000)
Median monthly housing costs ($)
Median household income for houses/condos with a mortgage ($)
Median household income for houses/condos without a mortgage ($)
Median household income ($)
Median household income ($) - White
Median household income ($) - Black or African American
Median household income ($) - Asian
Median household income ($) - Hispanic or Latino
Median household income ($) - American Indian and Alaska Native
Median household income ($) - Multirace
Median household income ($) - Other Race
Mortgage status - with mortgage (%)
Mortgage status - with second mortgage (%)
Mortgage status - with home equity loan (%)
Mortgage status - with both second mortgage and home equity loan (%)
Mortgage status - without a mortgage (%)
Median year house/condo built
Median year apartment built
Household type by relationship - Male householder living alone (%)
Household type by relationship - Male householder not living alone (%)
Household type by relationship - Female householder living alone (%)
Household type by relationship - Female householder not living alone (%)
Household type by relationship - Opposite-Sex spouse (%)
Household type by relationship - Same-Sex spouse (%)
Household type by relationship - Opposite-Sex unmarried partner (%)
Household type by relationship - Same-Sex unmarried partner (%)
Household type by relationship - In group quarters (%)
Size of family households - 2-person household (%)
Size of family households - 3-person household (%)
Size of family households - 4-person household (%)
Size of family households - 5-person household (%)
Size of family households - 6-person household (%)
Size of family households - 7-or-more-person household (%)
Size of nonfamily households - 1-person household (%)
Size of nonfamily households - 2-person household (%)
Size of nonfamily households - 3-person household (%)
Size of nonfamily households - 4-person household (%)
Size of nonfamily households - 5-person household (%)
Size of nonfamily households - 6-person household (%)
Size of nonfamily households - 7-or-moreperson household (%)
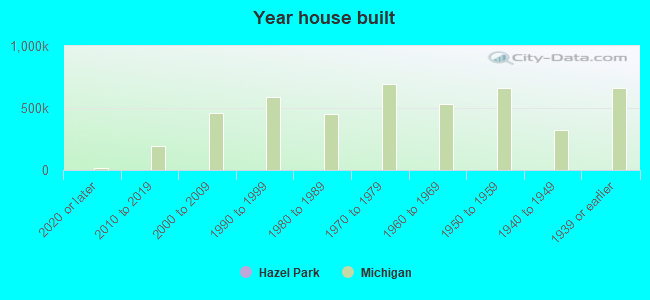
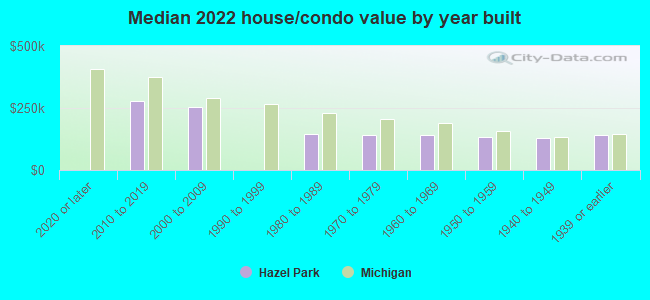
Year house built - Built 2010 or later (%)
Year house built - Built 2000 to 2009 (%)
Year house built - Built 1990 to 1999 (%)
Year house built - Built 1980 to 1989 (%)
Year house built - Built 1970 to 1979 (%)
Year house built - Built 1960 to 1969 (%)
Year house built - Built 1950 to 1959 (%)
Year house built - Built 1940 to 1949 (%)
Year house built - Built 1939 or earlier (%)
Median number of rooms in houses and condos
Median number of rooms in apartments
Median number of bedrooms in owner occupied houses
Mean number of bedrooms in owner occupied houses
Median number of bedrooms in renter occupied houses
Mean number of bedrooms in renter occupied houses
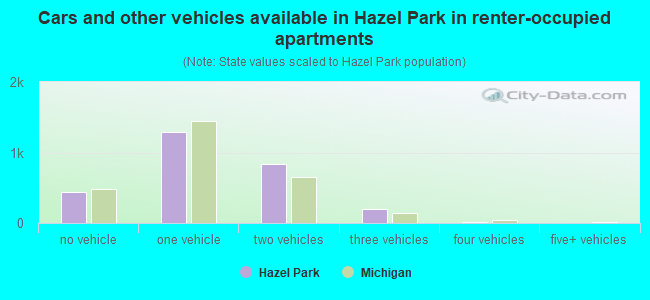
Median number of vehichles in owner occupied houses
Mean number of vehichles in owner occupied houses
Median number of vehichles in renter occupied houses
Mean number of vehichles in renter occupied houses
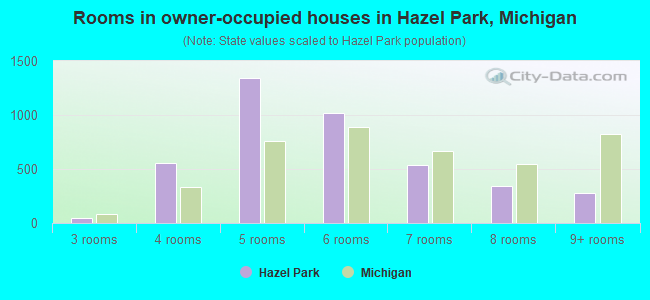
Rooms in owner-occupied houses - 1 room (%)
Rooms in owner-occupied houses - 2 rooms (%)
Rooms in owner-occupied houses - 3 rooms (%)
Rooms in owner-occupied houses - 4 rooms (%)
Rooms in owner-occupied houses - 5 rooms (%)
Rooms in owner-occupied houses - 6 rooms (%)
Rooms in owner-occupied houses - 7 rooms (%)
Rooms in owner-occupied houses - 8 rooms (%)
Rooms in owner-occupied houses - 9+ rooms (%)
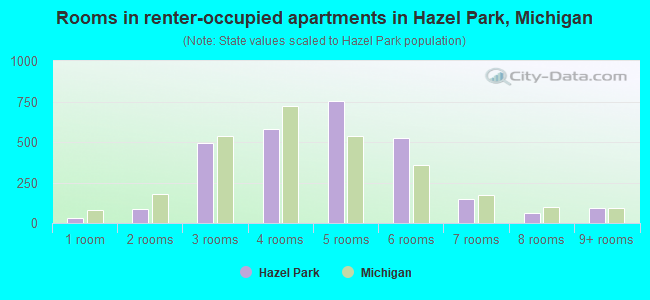
Rooms in renter-occupied houses - 1 room (%)
Rooms in renter-occupied houses - 2 rooms (%)
Rooms in renter-occupied houses - 3 rooms (%)
Rooms in renter-occupied houses - 4 rooms (%)
Rooms in renter-occupied houses - 5 rooms (%)
Rooms in renter-occupied houses - 6 rooms (%)
Rooms in renter-occupied houses - 7 rooms (%)
Rooms in renter-occupied houses - 8 rooms (%)
Rooms in renter-occupied houses - 9+ rooms (%)
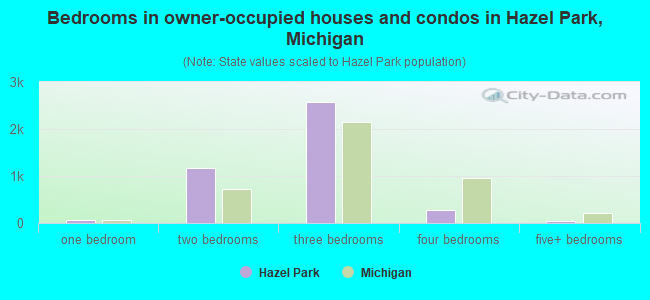
Bedrooms in owner-occupied houses - no bedrooms (%)
Bedrooms in owner-occupied houses - 1 bedroom (%)
Bedrooms in owner-occupied houses - 2 bedrooms (%)
Bedrooms in owner-occupied houses - 3 bedrooms (%)
Bedrooms in owner-occupied houses - 4 bedrooms (%)
Bedrooms in owner-occupied houses - 5+ bedrooms (%)
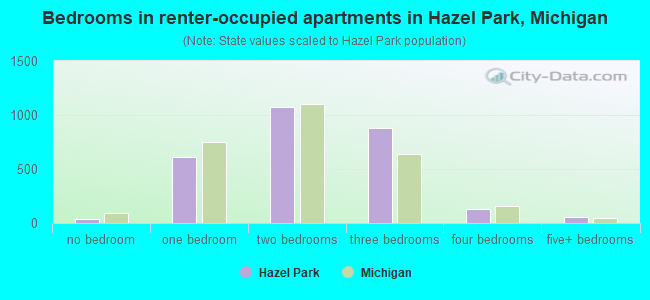
Bedrooms in renter-occupied houses - no bedrooms (%)
Bedrooms in renter-occupied houses - 1 bedroom (%)
Bedrooms in renter-occupied houses - 2 bedrooms (%)
Bedrooms in renter-occupied houses - 3 bedrooms (%)
Bedrooms in renter-occupied houses - 4 bedrooms (%)
Bedrooms in renter-occupied houses - 5+ bedrooms (%)
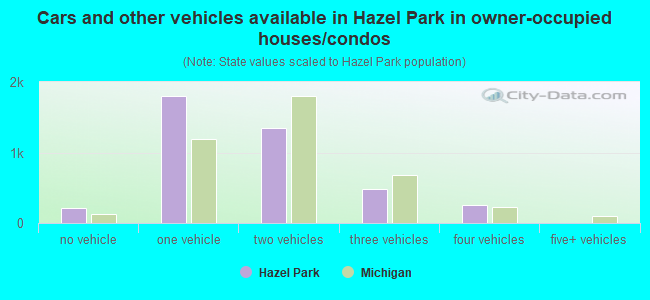
Vehicles available in owner-occupied houses - no vehicle available (%)
Vehicles available in owner-occupied houses - 1 vehicle available(%)
Vehicles available in owner-occupied houses - 2 Vehicles available (%)
Vehicles available in owner-occupied houses - 3 Vehicles available (%)
Vehicles available in owner-occupied houses - 4 Vehicles available (%)
Vehicles available in owner-occupied houses - 5+ Vehicles available (%)
Vehicles available in renter-occupied houses - no vehicle available (%)
Vehicles available in renter-occupied houses - 1 vehicle available (%)
Vehicles available in renter-occupied houses - 2 Vehicles available (%)
Vehicles available in renter-occupied houses - 3 Vehicles available (%)
Vehicles available in renter-occupied houses - 4 Vehicles available (%)
Vehicles available in renter-occupied houses - 5+ Vehicles available (%)
Housing units in structures - 1, detached (%)
Housing units in structures - 1, attached (%)
Housing units in structures - 2 (%)
Housing units in structures - 3 or 4 (%)
Housing units in structures - 5 to 9 (%)
Housing units in structures - 10 to 19 (%)
Housing units in structures - 20 to 49 (%)
Housing units in structures - 50 or more (%)
Housing units in structures - Mobile home (%)
Housing units in structures - Boat, RV, van, etc. (%)
Housing units in structures - Owners - 1, detached (%)
Housing units in structures - Owners - 1, attached (%)
Housing units in structures - Owners - 2 (%)
Housing units in structures - Owners - 3 or 4 (%)
Housing units in structures - Owners - 5 to 9 (%)
Housing units in structures - Owners - 10 to 19 (%)
Housing units in structures - Owners - 20 to 49 (%)
Housing units in structures - Owners - 50 or more (%)
Housing units in structures - Owners - Mobile home (%)
Housing units in structures - Owners - Boat, RV, van, etc. (%)
Housing units in structures - Renters - 1, detached (%)
Housing units in structures - Renters - 1, attached (%)
Housing units in structures - Renters - 2 (%)
Housing units in structures - Renters - 3 or 4 (%)
Housing units in structures - Renters - 5 to 9 (%)
Housing units in structures - Renters - 10 to 19 (%)
Housing units in structures - Renters - 20 to 49 (%)
Housing units in structures - Renters - 50 or more (%)
Housing units in structures - Renters - Mobile home (%)
Housing units in structures - Renters - Boat, RV, van, etc. (%)
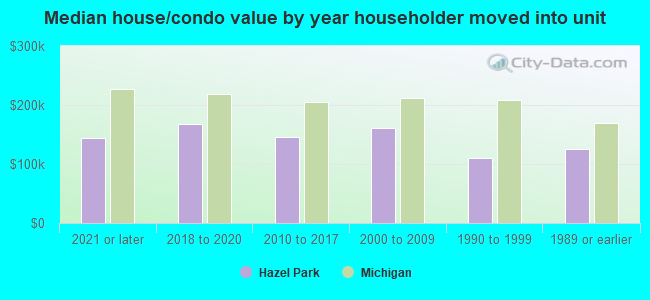
House/condo owner moved in on average (years ago)
Renter moved in on average (years ago)
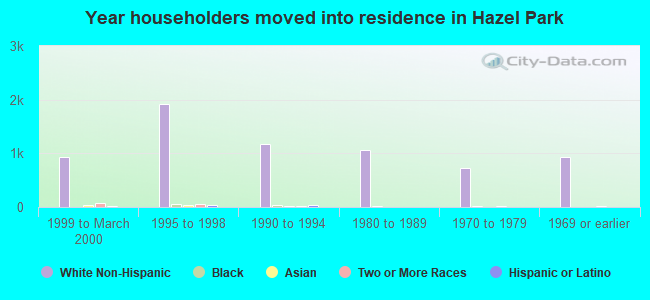
Year householder moved into unit - Moved in 1999 to March 2000 (%)
Year householder moved into unit - Moved in 1999 to March 2000 (%) - White
Year householder moved into unit - Moved in 1999 to March 2000 (%) - Black or African American
Year householder moved into unit - Moved in 1999 to March 2000 (%) - Asian
Year householder moved into unit - Moved in 1999 to March 2000 (%) - Hispanic or Latino
Year householder moved into unit - Moved in 1999 to March 2000 (%) - American Indian and Alaska Native
Year householder moved into unit - Moved in 1999 to March 2000 (%) - Multirace
Year householder moved into unit - Moved in 1999 to March 2000 (%) - Other Race
Year householder moved into unit - Moved in 1995 to 1998 (%)
Year householder moved into unit - Moved in 1995 to 1998 (%) - White
Year householder moved into unit - Moved in 1995 to 1998 (%) - Black or African American
Year householder moved into unit - Moved in 1995 to 1998 (%) - Asian
Year householder moved into unit - Moved in 1995 to 1998 (%) - Hispanic or Latino
Year householder moved into unit - Moved in 1995 to 1998 (%) - American Indian and Alaska Native
Year householder moved into unit - Moved in 1995 to 1998 (%) - Multirace
Year householder moved into unit - Moved in 1995 to 1998 (%) - Other Race
Year householder moved into unit - Moved in 1990 to 1994 (%)
Year householder moved into unit - Moved in 1990 to 1994 (%) - White
Year householder moved into unit - Moved in 1990 to 1994 (%) - Black or African American
Year householder moved into unit - Moved in 1990 to 1994 (%) - Asian
Year householder moved into unit - Moved in 1990 to 1994 (%) - Hispanic or Latino
Year householder moved into unit - Moved in 1990 to 1994 (%) - American Indian and Alaska Native
Year householder moved into unit - Moved in 1990 to 1994 (%) - Multirace
Year householder moved into unit - Moved in 1990 to 1994 (%) - Other Race
Year householder moved into unit - Moved in 1980 to 1989 (%)
Year householder moved into unit - Moved in 1980 to 1989 (%) - White
Year householder moved into unit - Moved in 1980 to 1989 (%) - Black or African American
Year householder moved into unit - Moved in 1980 to 1989 (%) - Asian
Year householder moved into unit - Moved in 1980 to 1989 (%) - Hispanic or Latino
Year householder moved into unit - Moved in 1980 to 1989 (%) - American Indian and Alaska Native
Year householder moved into unit - Moved in 1980 to 1989 (%) - Multirace
Year householder moved into unit - Moved in 1980 to 1989 (%) - Other Race
Year householder moved into unit - Moved in 1970 to 1979 (%)
Year householder moved into unit - Moved in 1970 to 1979 (%) - White
Year householder moved into unit - Moved in 1970 to 1979 (%) - Black or African American
Year householder moved into unit - Moved in 1970 to 1979 (%) - Asian
Year householder moved into unit - Moved in 1970 to 1979 (%) - Hispanic or Latino
Year householder moved into unit - Moved in 1970 to 1979 (%) - American Indian and Alaska Native
Year householder moved into unit - Moved in 1970 to 1979 (%) - Multirace
Year householder moved into unit - Moved in 1970 to 1979 (%) - Other Race
Year householder moved into unit - Moved in 1969 or earlier (%)
Year householder moved into unit - Moved in 1969 or earlier (%) - White
Year householder moved into unit - Moved in 1969 or earlier (%) - Black or African American
Year householder moved into unit - Moved in 1969 or earlier (%) - Asian
Year householder moved into unit - Moved in 1969 or earlier (%) - Hispanic or Latino
Year householder moved into unit - Moved in 1969 or earlier (%) - American Indian and Alaska Native
Year householder moved into unit - Moved in 1969 or earlier (%) - Multirace
Year householder moved into unit - Moved in 1969 or earlier (%) - Other Race
Housing units lacking complete plumbing facilities (%)
Housing units lacking complete kitchen facilities (%)
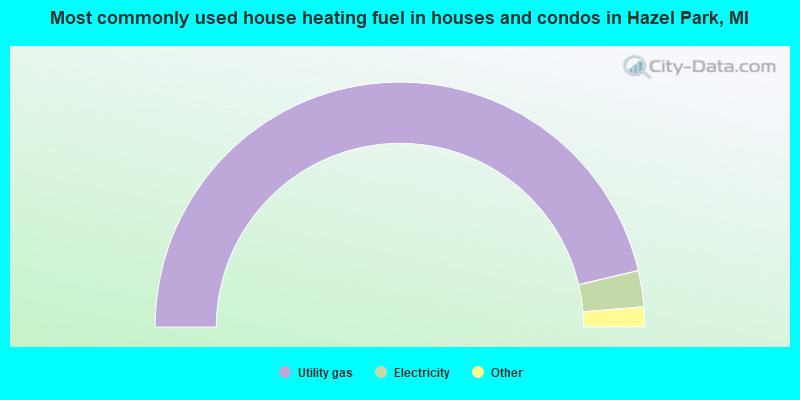
House heating fuel used in houses and condos - Utility gas (%)
House heating fuel used in houses and condos - Bottled, tank, or LP gas (%)
House heating fuel used in houses and condos - Electricity (%)
House heating fuel used in houses and condos - Fuel oil, kerosene, etc. (%)
House heating fuel used in houses and condos - Coal or coke (%)
House heating fuel used in houses and condos - Wood (%)
House heating fuel used in houses and condos - Solar energy (%)
House heating fuel used in houses and condos - Other fuel (%)
House heating fuel used in houses and condos - No fuel used (%)
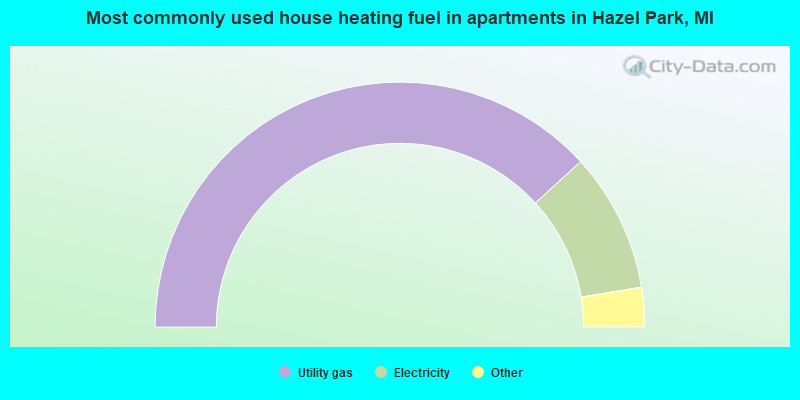
House heating fuel used in apartments - Utility gas (%)
House heating fuel used in apartments - Bottled, tank, or LP gas (%)
House heating fuel used in apartments - Electricity (%)
House heating fuel used in apartments - Fuel oil, kerosene, etc. (%)
House heating fuel used in apartments - Coal or coke (%)
House heating fuel used in apartments - Wood (%)
House heating fuel used in apartments - Solar energy (%)
House heating fuel used in apartments - Other fuel (%)
House heating fuel used in apartments - No fuel used (%)
Median year house/condo built: 1953Median year apartment built: 1964Household type by relationship:
Households: 15,031
Male householders: 3,316 (1,477 living alone ), Female householders: 3,492 (941 living alone )2,087 spouses (2,067 opposite-sex spouses ), 738 unmarried partners , (698 opposite-sex unmarried partners ), 3,215 children (3,086 natural , 38 adopted , 90 stepchildren ), 429 grandchildren , 328 brothers or sisters , 171 parents , 0 foster children , 245 other relatives , 1,006 non-relatives
Size of family households: 1,812 2-persons , 649 3-persons , 544 4-persons , 226 5-persons , 152 6-persons , 22 7-or-more-persons .
Size of nonfamily households: 2,545 1-person , 916 2-persons , 46 3-persons , 74 4-persons .
977 married couples with children. single-parent households (219 men , 797 women ).
90.0% of residents of Hazel Park speak English at home. of residents speak Spanish at home (64% speak English very well , 26% speak English well , 9% speak English not well ).of residents speak other Indo-European language at home (85% speak English very well , 8% speak English well , 7% speak English not well ).of residents speak Asian or Pacific Island language at home (43% speak English very well , 23% speak English well , 33% speak English not well ).of residents speak other language at home (51% speak English very well , 18% speak English well , 25% speak English not well , 6% don't speak English at all ).
Foreign born population: 990 (6.6%)of them are naturalized citizens )
Median number of rooms in houses and condos:
Median number of rooms in apartments
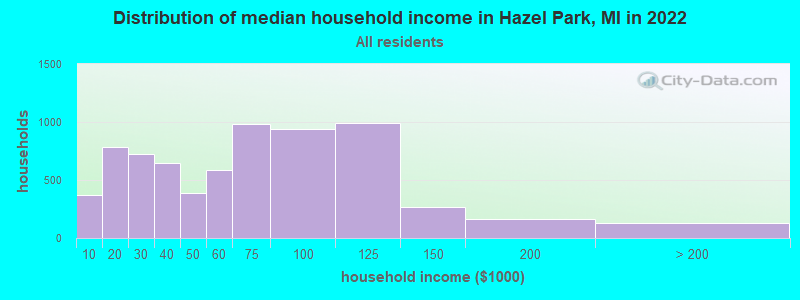
Hazel Park, MI household income distribution 370 Less than $10,000783 $10,000 to $19,999724 $20,000 to $29,999649 $30,000 to $39,999392 $40,000 to $49,999584 $50,000 to $59,999983 $60,000 to $74,999939 $75,000 to $99,999990 $100,000 to $124,999271 $125,000 to $149,999163 $150,000 to $199,999126 $200,000 or more
Home value of owner - occupied houses in 2022 in Hazel Park, MI 12 Less than $10,00027 $10,000 to $14,99922 $15,000 to $19,99954 $20,000 to $24,9999 $25,000 to $29,99986 $30,000 to $34,99966 $35,000 to $39,99979 $40,000 to $49,999124 $50,000 to $59,99998 $60,000 to $69,99957 $70,000 to $79,999283 $80,000 to $89,999146 $90,000 to $99,999631 $100,000 to $124,999722 $125,000 to $149,999413 $150,000 to $174,999283 $175,000 to $199,99977 $200,000 to $249,999161 $250,000 to $299,999102 $300,000 to $399,99918 $400,000 to $499,9993 $750,000 to $999,999Rent paid by renters in 2022 in Hazel Park, MI 124 $150 to $199197 $200 to $24913 $250 to $29910 $300 to $34973 $350 to $39924 $500 to $5497 $550 to $59937 $600 to $649110 $650 to $699167 $700 to $749129 $750 to $799242 $800 to $899569 $900 to $999655 $1,000 to $1,249243 $1,250 to $1,49977 $1,500 to $1,9999 $2,000 to $2,49927 $2,500 to $2,9993 No cash rent
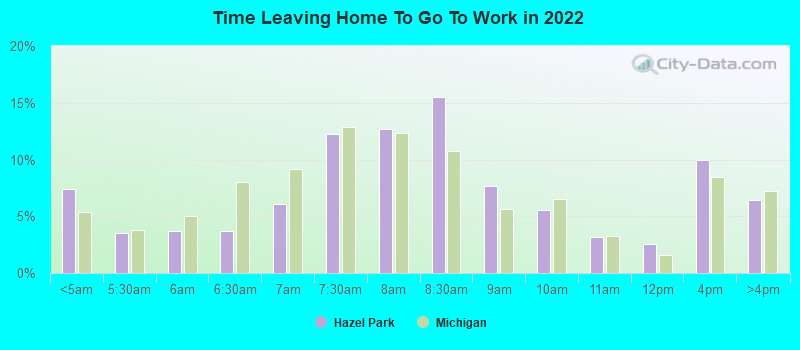
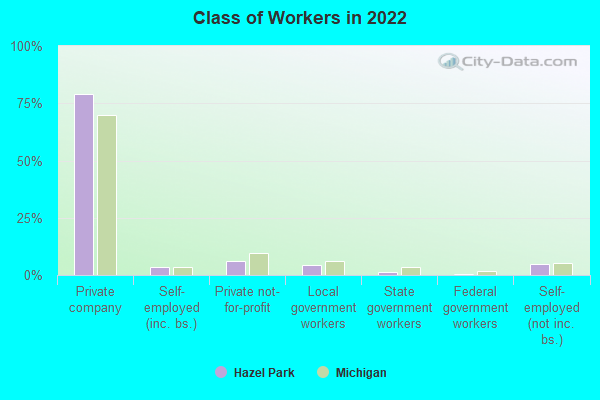
Percentage of workers working in this county: 72.3%Number of people working at home: 1,244 (15.1% of all workers )
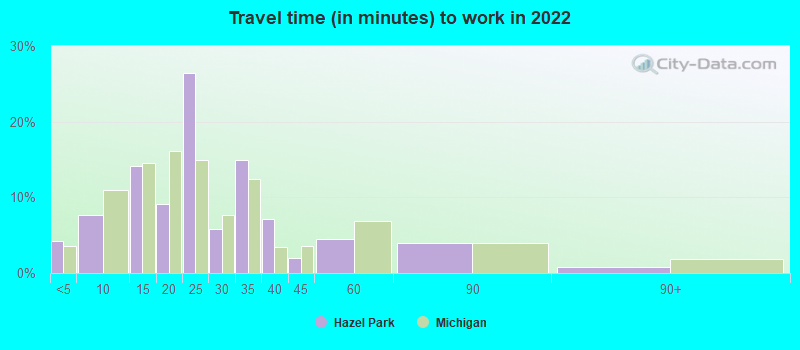
Travel time to work (commute)
Less than 5 minutes: 1715 to 9 minutes: 62810 to 14 minutes: 72615 to 19 minutes: 1,17020 to 24 minutes: 1,40025 to 29 minutes: 77930 to 34 minutes: 1,05135 to 39 minutes: 12940 to 44 minutes: 10845 to 59 minutes: 39260 to 89 minutes: 21190 or more minutes: 105
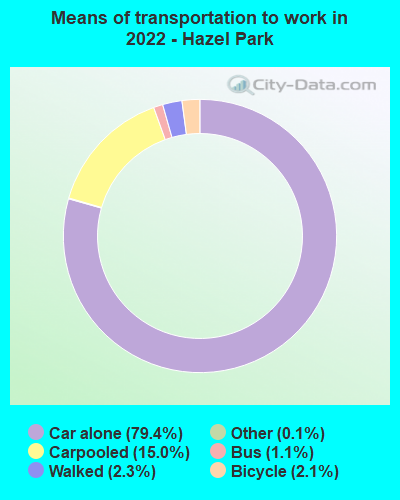
Means of transportation to work:
Drove a car alone: 3,075 (61.2%)Carpooled: 563 (11.2%)Bus : 24 (0.5%)Taxi: 5 (0.1%)Bicycle: 129 (2.6%)Walked: 105 (2.1%)Worked at home: 1,244 (24.7%)
Unemployment by race in 2022
Unemployment rate for White non-Hispanic residents 2.5% Males5.1% FemalesUnemployment rate for Black residents 6.5% FemalesUnemployment rate for Asian residents 14.0% Males33.1% FemalesUnemployment rate for other race residents 17.7% MalesUnemployment rate for two or more race residents 0.9% FemalesUnemployment rate for Hispanic or Latino residents 9.7% Males
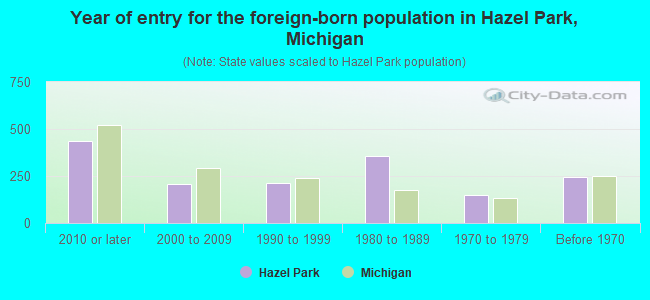
Year of entry for the foreign-born population in Hazel Park, Michigan
438 2010 or later 206 2000 to 2009 213 1990 to 1999 358 1980 to 1989 151 1970 to 1979 245 Before 1970
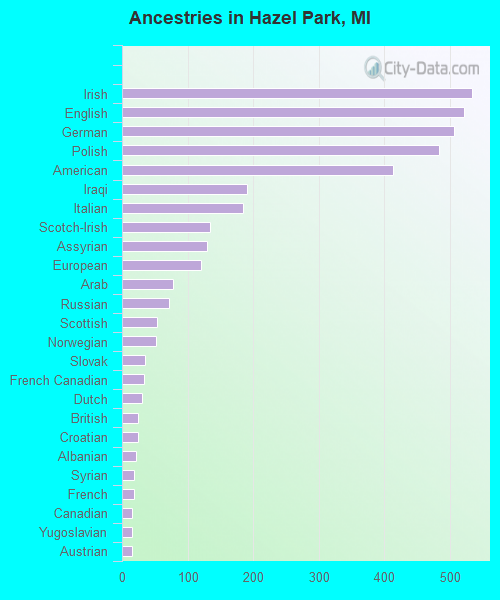
First ancestries reported:
Irish: 533 (8.8%)
English: 521 (8.6%)
German: 506 (8.3%)
Polish: 484 (8.0%)
American: 413 (6.8%)
Iraqi: 190 (3.1%)
Italian: 185 (3.0%)
Scotch-Irish: 134 (2.2%)
Assyrian: 130 (2.1%)
European: 120 (2.0%)
Arab: 78 (1.3%)
Russian: 72 (1.2%)
Scottish: 54 (0.9%)
Norwegian: 52 (0.9%)
Slovak: 35 (0.6%)
French Canadian: 34 (0.6%)
Dutch: 30 (0.5%)
British: 25 (0.4%)
Croatian: 24 (0.4%)
Albanian: 22 (0.4%)
Syrian: 19 (0.3%)
French: 18 (0.3%)
Canadian: 16 (0.3%)
Yugoslavian: 16 (0.3%)
Austrian: 15 (0.2%)
Swedish: 15 (0.2%)
Bulgarian: 12 (0.2%)
Belgian: 11 (0.2%)
Welsh: 7 (0.1%)
Greek: 6 (0.10%)
Maltese: 1 (0.02%) Most common places of birth for foreign-born residents (%): Iraq Hazel Park:
37.6% (370)Michigan:
8.1% (55,954)
China, excluding Hong Kong and Taiwan Hazel Park:
10.2% (100)Michigan:
4.9% (34,295)
Russia Hazel Park:
8.6% (85)Michigan:
0.9% (6,326)
Mexico Hazel Park:
8.4% (83)Michigan:
10.9% (75,965)
India Hazel Park:
5.8% (57)Michigan:
11.1% (77,240)
Canada Hazel Park:
5.4% (53)Michigan:
5.0% (35,052)
Philippines Hazel Park:
3.7% (36)Michigan:
2.8% (19,112)
Thailand Hazel Park:
3.3% (32)Michigan:
0.4% (3,080)
Syria Hazel Park:
2.0% (20)Michigan:
0.9% (5,978)
England Hazel Park:
1.9% (19)Michigan:
0.9% (6,424)
Egypt Hazel Park:
1.8% (18)Michigan:
0.6% (3,827)
Nigeria Hazel Park:
1.7% (17)Michigan:
0.9% (5,964)
Place of birth for U.S.-born residents:
This state: 11,666Other state: 2,307Northeast: 594Midwest: 443South: 952West: 319 84.5% of Hazel Park residents lived in the same house 1 years ago.
Out of people who lived in different houses, 39.2% lived in this county.
Out of people who lived in different counties, 78.1% lived in Michigan.
Hazel Park:
84.5%State average:
88.4%
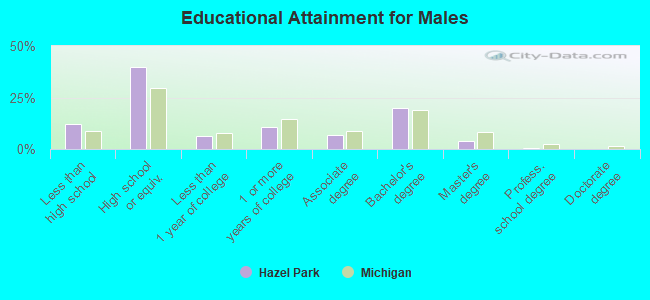
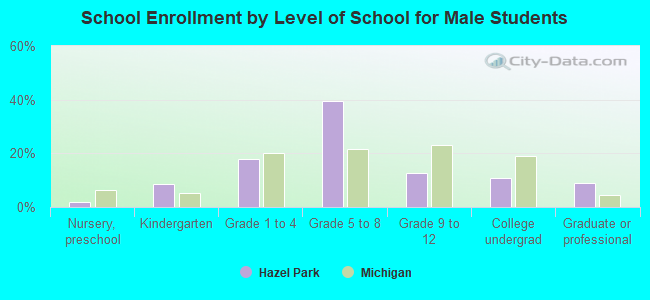
Education attainment for males 25 years and older:
No schooling: 68Nursery to 4th grade: 465th and 6th grade: 787th and 8th grade: 359th grade: 710th grade: 18311th grade: 12212th grade, no diploma: 157High school graduate (or equivalency): 2,300Less than 1 year of college: 358Some college more than 1 year, no degree: 608Associate degree: 379Bachelor's degree: 1,142Master's degree: 231Professional school degree: 35Doctorate degree: 0
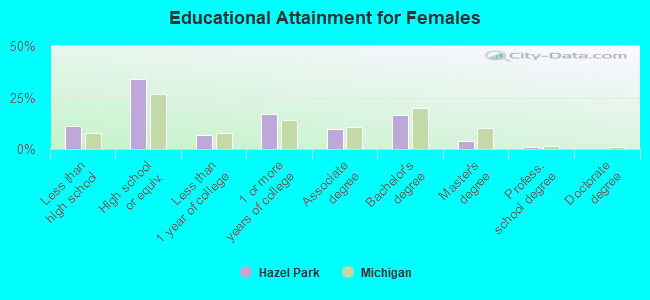
Education attainment for females 25 years and older:
No schooling: 124Nursery to 4th grade: 275th and 6th grade: 377th and 8th grade: 1219th grade: 5710th grade: 10111th grade: 4012th grade, no diploma: 78High school graduate (or equivalency): 1,822Less than 1 year of college: 375Some college more than 1 year, no degree: 898Associate degree: 506Bachelor's degree: 895Master's degree: 220Professional school degree: 45Doctorate degree: 0
Housing units in structures:
One, detached: 6,391One, attached: 69Two: 643 or 4: 2410 to 19: 7920 to 49: 14350 or more: 450Mobile homes: 110Housing units lacking complete plumbing facilities in 2022: 0.7%Housing units lacking complete kitchen facilities in 2022: 1.6%House/condo owner moved in on average 13 years ago
Renter moved in on average 2 years ago
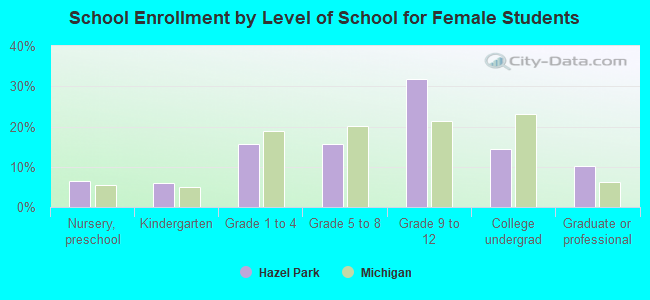
Private vs. public school enrollment:
Students in private schools in grades 1 to 8 (elementary and middle school): 5 Students in private schools in grades 9 to 12 (high school): 0 Students in private undergraduate colleges: 17