Hendersonville, NC (North Carolina) Houses and Residents
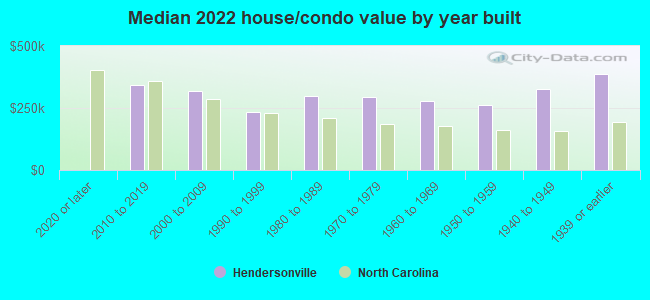
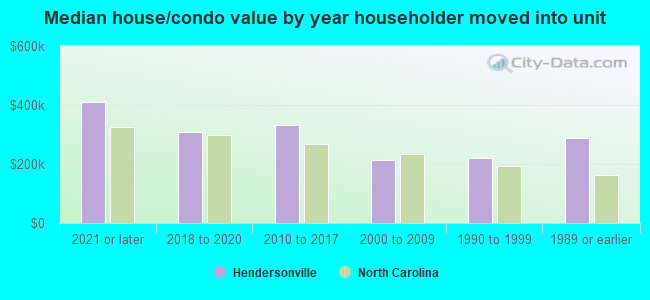
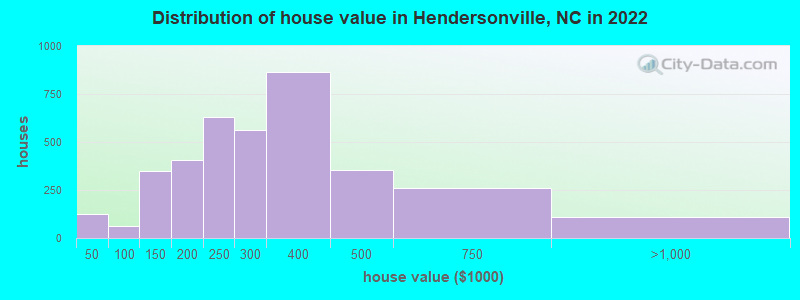
Estimated median house or condo value in 2022: $289,819 (it was $106,000 in 2000 )
Hendersonville:
$289,819North Carolina:
$280,600
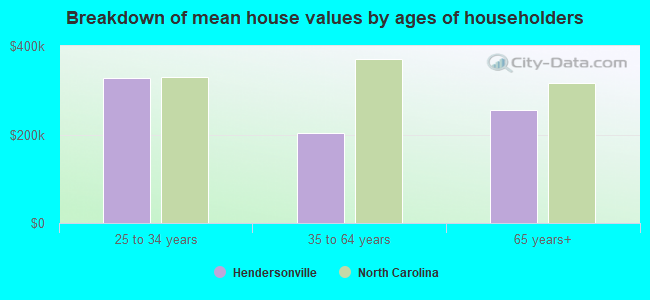
Lower value quartile - upper value quartile: $228,985 - $403,282Mean price in 2022: Detached houses: $324,587 Here:
$324,587State:
$375,326
Townhouses or other attached units: $279,802 Here:
$279,802State:
$317,935
In 2-unit structures: $267,808 Here:
$267,808State:
$250,488
In 3-to-4-unit structures: $158,457 Here:
$158,457State:
$254,939
In 5-or-more-unit structures: $270,530 Here:
$270,530State:
$329,290
Mobile homes: $154,723 Here:
$154,723State:
$124,933
Total population: 13,650 (Urban population: 10,359, Rural population: 13 (all nonfarm) )
Houses: 8,454 (7,802 occupied: 3,826 owner occupied, 4,223 renter occupied )
% of renters here:
52%State:
33%
Housing density: 1,420 houses/condos per square mile
Median price asked for vacant for-sale houses and condos in 2022: $266,915.
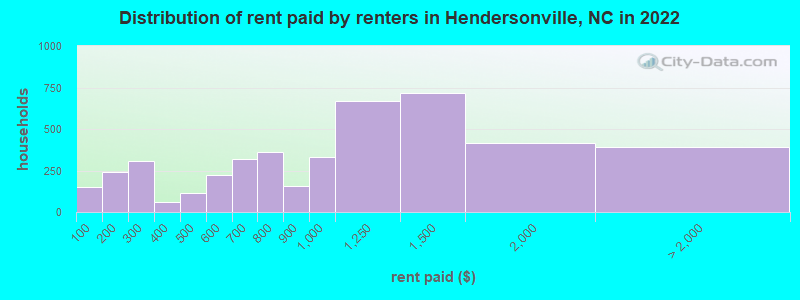
Median contract rent in 2022: $972 (lower quartile is $623, upper quartile is $1,429)
Median rent asked for vacant for-rent units in 2022: $1,308
Median gross rent in Hendersonville, NC in 2022: $1,071
Housing units in Hendersonville with a mortgage: 1,753 (103 second mortgage, 0 home equity loan, 99 both second mortgage and home equity loan )Houses without a mortgage: 51
Median household income for houses/condos with a mortgage: $82,845
Median household income for apartments without a mortgage: $49,351
Median monthly housing costs: $908
Data:
Median house or condo value ($)
Median house or condo value ($ change since 2000)
Median house or condo value ($) - White
Median house or condo value ($) - Black or African American
Median house or condo value ($) - Asian
Median house or condo value ($) - Hispanic or Latino
Median house or condo value ($) - American Indian and Alaska Native
Median house or condo value ($) - Multirace
Median house or condo value ($) - Other Race
Median price asked for mobile homes ($)
Household density (households per square mile)
Mean house or condo value by units in structure - 1, detached ($)
Mean house or condo value by units in structure - 1, attached ($)
Mean house or condo value by units in structure - 2 ($)
Mean house or condo value by units in structure by units in structure - 3 or 4 ($)
Mean house or condo value by units in structure - 5 or more ($)
Mean house or condo value by units in structure - Boat, RV, van, etc. ($)
Mean house or condo value by units in structure - Mobile home ($)
Median contract rent ($)
Median contract rent - Lower quartile ($)
Median contract rent - Upper quartile ($)
Median gross rent ($)
Urban houses (%)
Rural houses (%)
Houses occupied (%)
Houses occupied (% change since 2000)
Houses owner occupied (%)
Houses owner occupied (% change since 2000)
Houses renter occupied (%)
Houses renter occupied (% change since 2000)
Vacant housing units - For rent (%)
Vacant housing units - For rent (% change since 2000)
Vacant housing units - For sale only (%)
Vacant housing units - For sale only (% change since 2000)
Vacant housing units - Rented or sold, not occupied (%)
Vacant housing units - Rented or sold, not occupied (% change since 2000)
Vacant housing units - For seasonal, recreational, or occasional use (%)
Vacant housing units - For seasonal, recreational, or occasional use (% change since 2000)
Vacant housing units - For migrant workers (%)
Vacant housing units - For migrant workers (% change since 2000)
Vacant housing units - Other vacant (%)
Vacant housing units - Other vacant (% change since 2000)
Median monthly housing costs ($)
Median household income for houses/condos with a mortgage ($)
Median household income for houses/condos without a mortgage ($)
Median household income ($)
Median household income ($) - White
Median household income ($) - Black or African American
Median household income ($) - Asian
Median household income ($) - Hispanic or Latino
Median household income ($) - American Indian and Alaska Native
Median household income ($) - Multirace
Median household income ($) - Other Race
Mortgage status - with mortgage (%)
Mortgage status - with second mortgage (%)
Mortgage status - with home equity loan (%)
Mortgage status - with both second mortgage and home equity loan (%)
Mortgage status - without a mortgage (%)
Median year house/condo built
Median year apartment built
Household type by relationship - Male householder living alone (%)
Household type by relationship - Male householder not living alone (%)
Household type by relationship - Female householder living alone (%)
Household type by relationship - Female householder not living alone (%)
Household type by relationship - Opposite-Sex spouse (%)
Household type by relationship - Same-Sex spouse (%)
Household type by relationship - Opposite-Sex unmarried partner (%)
Household type by relationship - Same-Sex unmarried partner (%)
Household type by relationship - In group quarters (%)
Size of family households - 2-person household (%)
Size of family households - 3-person household (%)
Size of family households - 4-person household (%)
Size of family households - 5-person household (%)
Size of family households - 6-person household (%)
Size of family households - 7-or-more-person household (%)
Size of nonfamily households - 1-person household (%)
Size of nonfamily households - 2-person household (%)
Size of nonfamily households - 3-person household (%)
Size of nonfamily households - 4-person household (%)
Size of nonfamily households - 5-person household (%)
Size of nonfamily households - 6-person household (%)
Size of nonfamily households - 7-or-moreperson household (%)
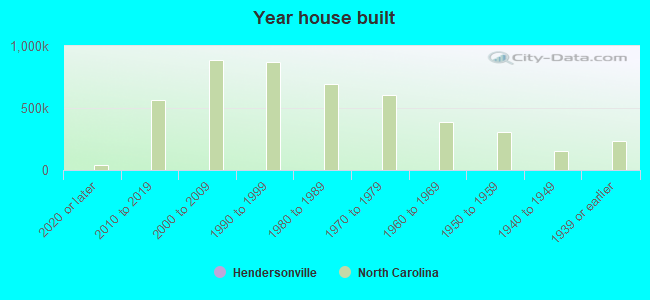
Year house built - Built 2010 or later (%)
Year house built - Built 2000 to 2009 (%)
Year house built - Built 1990 to 1999 (%)
Year house built - Built 1980 to 1989 (%)
Year house built - Built 1970 to 1979 (%)
Year house built - Built 1960 to 1969 (%)
Year house built - Built 1950 to 1959 (%)
Year house built - Built 1940 to 1949 (%)
Year house built - Built 1939 or earlier (%)
Median number of rooms in houses and condos
Median number of rooms in apartments
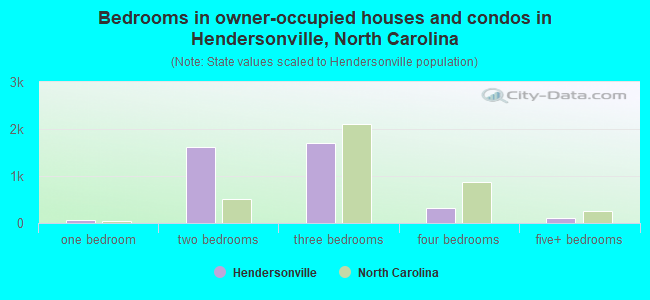
Median number of bedrooms in owner occupied houses
Mean number of bedrooms in owner occupied houses
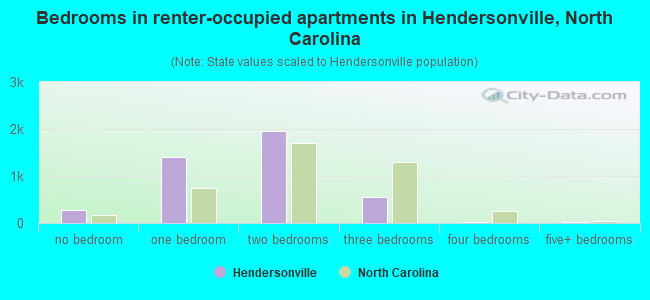
Median number of bedrooms in renter occupied houses
Mean number of bedrooms in renter occupied houses
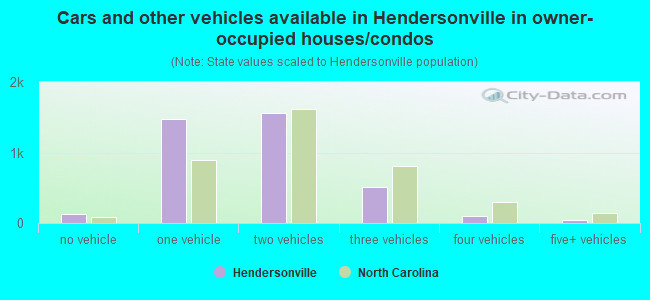
Median number of vehichles in owner occupied houses
Mean number of vehichles in owner occupied houses
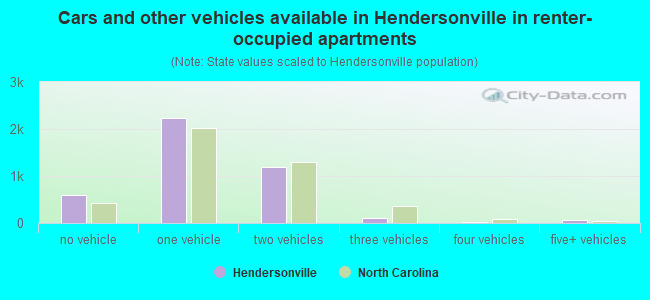
Median number of vehichles in renter occupied houses
Mean number of vehichles in renter occupied houses
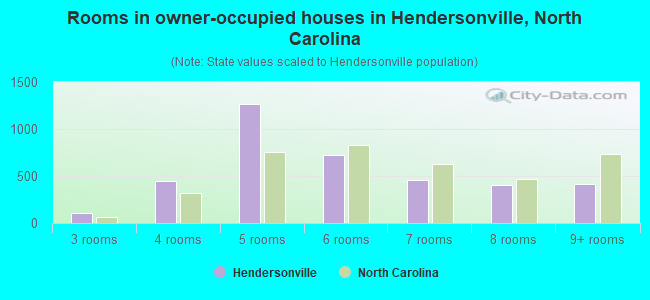
Rooms in owner-occupied houses - 1 room (%)
Rooms in owner-occupied houses - 2 rooms (%)
Rooms in owner-occupied houses - 3 rooms (%)
Rooms in owner-occupied houses - 4 rooms (%)
Rooms in owner-occupied houses - 5 rooms (%)
Rooms in owner-occupied houses - 6 rooms (%)
Rooms in owner-occupied houses - 7 rooms (%)
Rooms in owner-occupied houses - 8 rooms (%)
Rooms in owner-occupied houses - 9+ rooms (%)
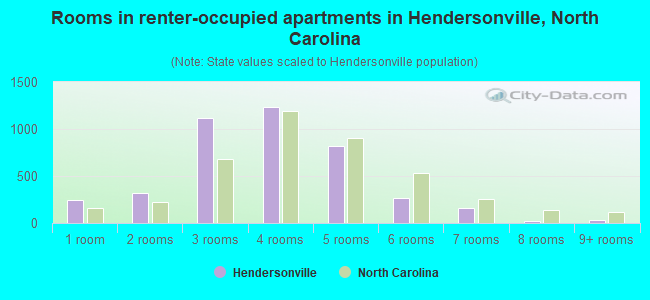
Rooms in renter-occupied houses - 1 room (%)
Rooms in renter-occupied houses - 2 rooms (%)
Rooms in renter-occupied houses - 3 rooms (%)
Rooms in renter-occupied houses - 4 rooms (%)
Rooms in renter-occupied houses - 5 rooms (%)
Rooms in renter-occupied houses - 6 rooms (%)
Rooms in renter-occupied houses - 7 rooms (%)
Rooms in renter-occupied houses - 8 rooms (%)
Rooms in renter-occupied houses - 9+ rooms (%)
Bedrooms in owner-occupied houses - no bedrooms (%)
Bedrooms in owner-occupied houses - 1 bedroom (%)
Bedrooms in owner-occupied houses - 2 bedrooms (%)
Bedrooms in owner-occupied houses - 3 bedrooms (%)
Bedrooms in owner-occupied houses - 4 bedrooms (%)
Bedrooms in owner-occupied houses - 5+ bedrooms (%)
Bedrooms in renter-occupied houses - no bedrooms (%)
Bedrooms in renter-occupied houses - 1 bedroom (%)
Bedrooms in renter-occupied houses - 2 bedrooms (%)
Bedrooms in renter-occupied houses - 3 bedrooms (%)
Bedrooms in renter-occupied houses - 4 bedrooms (%)
Bedrooms in renter-occupied houses - 5+ bedrooms (%)
Vehicles available in owner-occupied houses - no vehicle available (%)
Vehicles available in owner-occupied houses - 1 vehicle available(%)
Vehicles available in owner-occupied houses - 2 Vehicles available (%)
Vehicles available in owner-occupied houses - 3 Vehicles available (%)
Vehicles available in owner-occupied houses - 4 Vehicles available (%)
Vehicles available in owner-occupied houses - 5+ Vehicles available (%)
Vehicles available in renter-occupied houses - no vehicle available (%)
Vehicles available in renter-occupied houses - 1 vehicle available (%)
Vehicles available in renter-occupied houses - 2 Vehicles available (%)
Vehicles available in renter-occupied houses - 3 Vehicles available (%)
Vehicles available in renter-occupied houses - 4 Vehicles available (%)
Vehicles available in renter-occupied houses - 5+ Vehicles available (%)
Housing units in structures - 1, detached (%)
Housing units in structures - 1, attached (%)
Housing units in structures - 2 (%)
Housing units in structures - 3 or 4 (%)
Housing units in structures - 5 to 9 (%)
Housing units in structures - 10 to 19 (%)
Housing units in structures - 20 to 49 (%)
Housing units in structures - 50 or more (%)
Housing units in structures - Mobile home (%)
Housing units in structures - Boat, RV, van, etc. (%)
Housing units in structures - Owners - 1, detached (%)
Housing units in structures - Owners - 1, attached (%)
Housing units in structures - Owners - 2 (%)
Housing units in structures - Owners - 3 or 4 (%)
Housing units in structures - Owners - 5 to 9 (%)
Housing units in structures - Owners - 10 to 19 (%)
Housing units in structures - Owners - 20 to 49 (%)
Housing units in structures - Owners - 50 or more (%)
Housing units in structures - Owners - Mobile home (%)
Housing units in structures - Owners - Boat, RV, van, etc. (%)
Housing units in structures - Renters - 1, detached (%)
Housing units in structures - Renters - 1, attached (%)
Housing units in structures - Renters - 2 (%)
Housing units in structures - Renters - 3 or 4 (%)
Housing units in structures - Renters - 5 to 9 (%)
Housing units in structures - Renters - 10 to 19 (%)
Housing units in structures - Renters - 20 to 49 (%)
Housing units in structures - Renters - 50 or more (%)
Housing units in structures - Renters - Mobile home (%)
Housing units in structures - Renters - Boat, RV, van, etc. (%)
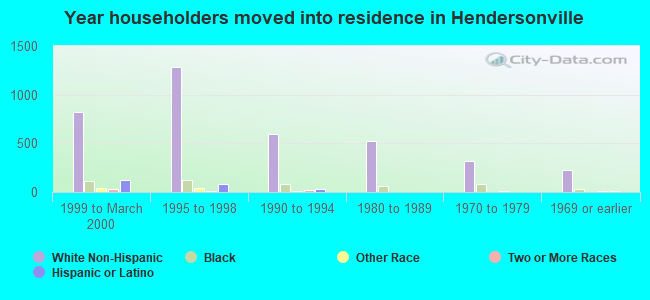
House/condo owner moved in on average (years ago)
Renter moved in on average (years ago)
Year householder moved into unit - Moved in 1999 to March 2000 (%)
Year householder moved into unit - Moved in 1999 to March 2000 (%) - White
Year householder moved into unit - Moved in 1999 to March 2000 (%) - Black or African American
Year householder moved into unit - Moved in 1999 to March 2000 (%) - Asian
Year householder moved into unit - Moved in 1999 to March 2000 (%) - Hispanic or Latino
Year householder moved into unit - Moved in 1999 to March 2000 (%) - American Indian and Alaska Native
Year householder moved into unit - Moved in 1999 to March 2000 (%) - Multirace
Year householder moved into unit - Moved in 1999 to March 2000 (%) - Other Race
Year householder moved into unit - Moved in 1995 to 1998 (%)
Year householder moved into unit - Moved in 1995 to 1998 (%) - White
Year householder moved into unit - Moved in 1995 to 1998 (%) - Black or African American
Year householder moved into unit - Moved in 1995 to 1998 (%) - Asian
Year householder moved into unit - Moved in 1995 to 1998 (%) - Hispanic or Latino
Year householder moved into unit - Moved in 1995 to 1998 (%) - American Indian and Alaska Native
Year householder moved into unit - Moved in 1995 to 1998 (%) - Multirace
Year householder moved into unit - Moved in 1995 to 1998 (%) - Other Race
Year householder moved into unit - Moved in 1990 to 1994 (%)
Year householder moved into unit - Moved in 1990 to 1994 (%) - White
Year householder moved into unit - Moved in 1990 to 1994 (%) - Black or African American
Year householder moved into unit - Moved in 1990 to 1994 (%) - Asian
Year householder moved into unit - Moved in 1990 to 1994 (%) - Hispanic or Latino
Year householder moved into unit - Moved in 1990 to 1994 (%) - American Indian and Alaska Native
Year householder moved into unit - Moved in 1990 to 1994 (%) - Multirace
Year householder moved into unit - Moved in 1990 to 1994 (%) - Other Race
Year householder moved into unit - Moved in 1980 to 1989 (%)
Year householder moved into unit - Moved in 1980 to 1989 (%) - White
Year householder moved into unit - Moved in 1980 to 1989 (%) - Black or African American
Year householder moved into unit - Moved in 1980 to 1989 (%) - Asian
Year householder moved into unit - Moved in 1980 to 1989 (%) - Hispanic or Latino
Year householder moved into unit - Moved in 1980 to 1989 (%) - American Indian and Alaska Native
Year householder moved into unit - Moved in 1980 to 1989 (%) - Multirace
Year householder moved into unit - Moved in 1980 to 1989 (%) - Other Race
Year householder moved into unit - Moved in 1970 to 1979 (%)
Year householder moved into unit - Moved in 1970 to 1979 (%) - White
Year householder moved into unit - Moved in 1970 to 1979 (%) - Black or African American
Year householder moved into unit - Moved in 1970 to 1979 (%) - Asian
Year householder moved into unit - Moved in 1970 to 1979 (%) - Hispanic or Latino
Year householder moved into unit - Moved in 1970 to 1979 (%) - American Indian and Alaska Native
Year householder moved into unit - Moved in 1970 to 1979 (%) - Multirace
Year householder moved into unit - Moved in 1970 to 1979 (%) - Other Race
Year householder moved into unit - Moved in 1969 or earlier (%)
Year householder moved into unit - Moved in 1969 or earlier (%) - White
Year householder moved into unit - Moved in 1969 or earlier (%) - Black or African American
Year householder moved into unit - Moved in 1969 or earlier (%) - Asian
Year householder moved into unit - Moved in 1969 or earlier (%) - Hispanic or Latino
Year householder moved into unit - Moved in 1969 or earlier (%) - American Indian and Alaska Native
Year householder moved into unit - Moved in 1969 or earlier (%) - Multirace
Year householder moved into unit - Moved in 1969 or earlier (%) - Other Race
Housing units lacking complete plumbing facilities (%)
Housing units lacking complete kitchen facilities (%)
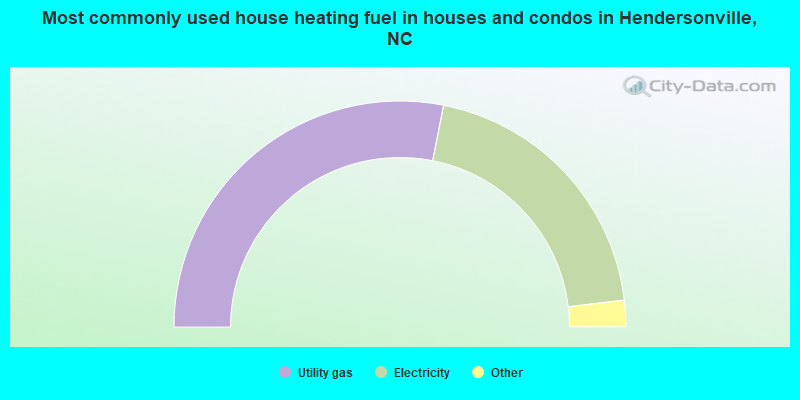
House heating fuel used in houses and condos - Utility gas (%)
House heating fuel used in houses and condos - Bottled, tank, or LP gas (%)
House heating fuel used in houses and condos - Electricity (%)
House heating fuel used in houses and condos - Fuel oil, kerosene, etc. (%)
House heating fuel used in houses and condos - Coal or coke (%)
House heating fuel used in houses and condos - Wood (%)
House heating fuel used in houses and condos - Solar energy (%)
House heating fuel used in houses and condos - Other fuel (%)
House heating fuel used in houses and condos - No fuel used (%)
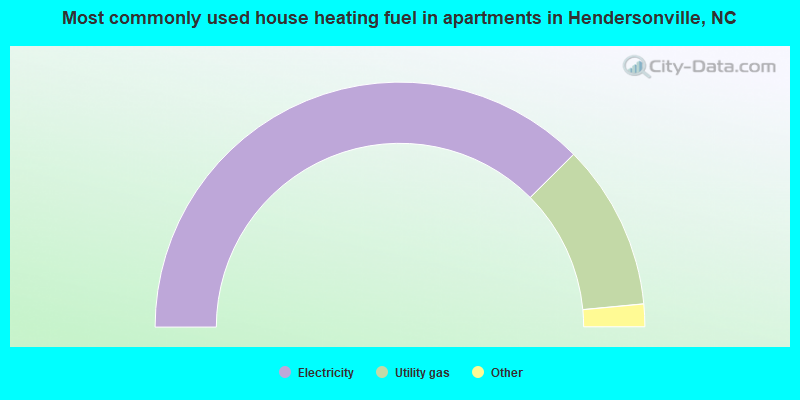
House heating fuel used in apartments - Utility gas (%)
House heating fuel used in apartments - Bottled, tank, or LP gas (%)
House heating fuel used in apartments - Electricity (%)
House heating fuel used in apartments - Fuel oil, kerosene, etc. (%)
House heating fuel used in apartments - Coal or coke (%)
House heating fuel used in apartments - Wood (%)
House heating fuel used in apartments - Solar energy (%)
House heating fuel used in apartments - Other fuel (%)
House heating fuel used in apartments - No fuel used (%)
Latest news about housing in Hendersonville, NC collected exclusively by city-data.com from local newspapers, TV, and radio stations
Median year house/condo built: 1978Median year apartment built: 1990Household type by relationship:
Households: 15,314
Male householders: 3,127 (1,397 living alone ), Female householders: 4,631 (2,255 living alone )2,582 spouses (2,544 opposite-sex spouses ), 483 unmarried partners , (446 opposite-sex unmarried partners ), 3,020 children (2,773 natural , 66 adopted , 180 stepchildren ), 109 grandchildren , 102 brothers or sisters , 58 parents , 0 foster children , 267 other relatives , 464 non-relatives In group quarters: 465
Size of family households: 2,304 2-persons , 862 3-persons , 452 4-persons , 108 5-persons , 122 6-persons , 5 7-or-more-persons .
Size of nonfamily households: 3,686 1-person , 341 2-persons , 5 4-persons .
921 married couples with children. single-parent households (165 men , 1,146 women ).
94.4% of residents of Hendersonville speak English at home. of residents speak Spanish at home (59% speak English very well , 15% speak English well , 26% speak English not well ).of residents speak other Indo-European language at home (94% speak English very well , 6% speak English well ).of residents speak Asian or Pacific Island language at home (47% speak English very well , 25% speak English well , 28% speak English not well ).
Foreign born population: 809 (5.3%)of them are naturalized citizens )
Median number of rooms in houses and condos:
Median number of rooms in apartments
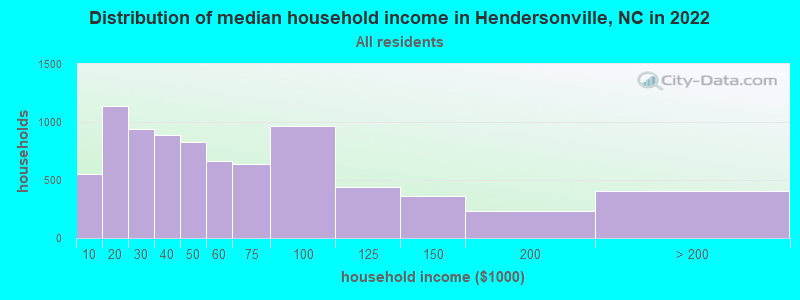
Hendersonville, NC household income distribution 551 Less than $10,0001,136 $10,000 to $19,999940 $20,000 to $29,999886 $30,000 to $39,999827 $40,000 to $49,999663 $50,000 to $59,999637 $60,000 to $74,999968 $75,000 to $99,999440 $100,000 to $124,999359 $125,000 to $149,999234 $150,000 to $199,999402 $200,000 or more
Home value of owner - occupied houses in 2022 in Hendersonville, NC 7 Less than $10,00026 $10,000 to $14,9998 $20,000 to $24,99933 $25,000 to $29,99948 $35,000 to $39,9996 $60,000 to $69,9997 $70,000 to $79,9993 $80,000 to $89,99945 $90,000 to $99,999288 $100,000 to $124,99960 $125,000 to $149,99981 $150,000 to $174,999324 $175,000 to $199,999631 $200,000 to $249,999563 $250,000 to $299,999862 $300,000 to $399,999356 $400,000 to $499,999257 $500,000 to $749,99996 $750,000 to $999,9991 $1,000,000 to $1,499,9999 $2,000,000 or moreRent paid by renters in 2022 in Hendersonville, NC 153 Less than $10030 $100 to $149210 $150 to $19976 $200 to $249228 $250 to $29946 $300 to $34914 $350 to $39985 $400 to $44926 $450 to $499110 $500 to $549110 $550 to $59968 $600 to $649251 $650 to $699261 $700 to $749101 $750 to $799154 $800 to $899329 $900 to $999666 $1,000 to $1,249718 $1,250 to $1,499418 $1,500 to $1,99948 $2,000 to $2,499101 $3,000 to $3,499157 $3,500 or more82 No cash rent
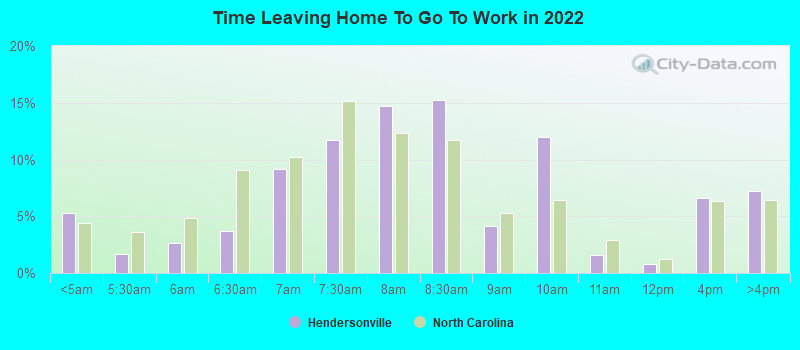
Percentage of workers working in this county: 77.1%Number of people working at home: 588 (8.9% of all workers )
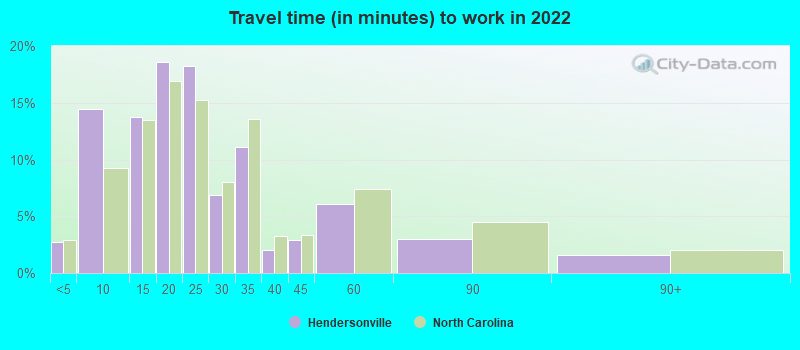
Travel time to work (commute)
Less than 5 minutes: 3035 to 9 minutes: 1,10710 to 14 minutes: 82315 to 19 minutes: 1,16520 to 24 minutes: 92225 to 29 minutes: 31330 to 34 minutes: 60835 to 39 minutes: 5640 to 44 minutes: 18545 to 59 minutes: 37260 to 89 minutes: 6690 or more minutes: 24
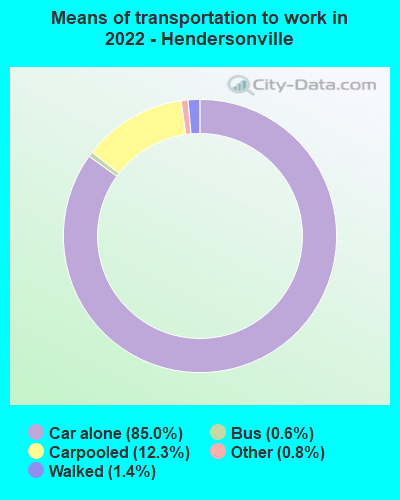
Means of transportation to work:
Drove a car alone: 14,941 (78.1%)Carpooled: 2,249 (11.8%)Bus : 67 (0.4%)Taxi: 150 (0.8%)Walked: 263 (1.4%)Worked at home: 733 (3.8%)
Unemployment by race in 2022
Unemployment rate for White non-Hispanic residents 1.5% Males0.7% FemalesUnemployment rate for Black residents 4.1% Males3.8% FemalesUnemployment rate for two or more race residents 7.0% Males4.7% Females
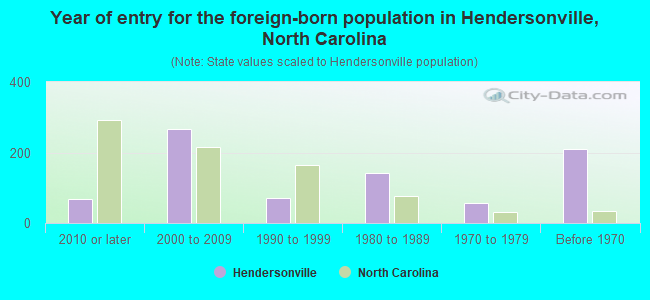
Year of entry for the foreign-born population in Hendersonville, North Carolina
67 2010 or later 268 2000 to 2009 72 1990 to 1999 141 1980 to 1989 57 1970 to 1979 211 Before 1970
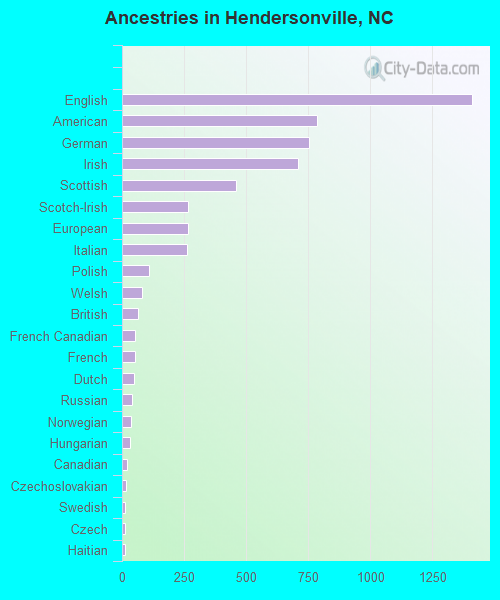
First ancestries reported:
English: 1,408 (19.3%)
American: 785 (10.8%)
German: 754 (10.3%)
Irish: 711 (9.8%)
Scottish: 458 (6.3%)
Scotch-Irish: 266 (3.6%)
European: 265 (3.6%)
Italian: 261 (3.6%)
Polish: 107 (1.5%)
Welsh: 79 (1.1%)
British: 63 (0.9%)
French Canadian: 53 (0.7%)
French: 52 (0.7%)
Dutch: 47 (0.6%)
Russian: 41 (0.6%)
Norwegian: 36 (0.5%)
Hungarian: 34 (0.5%)
Canadian: 20 (0.3%)
Czechoslovakian: 16 (0.2%)
Swedish: 14 (0.2%)
Czech: 13 (0.2%)
Haitian: 13 (0.2%)
Eastern European: 10 (0.1%)
Swiss: 10 (0.1%)
Northern European: 9 (0.1%)
Slovak: 6 (0.08%)
Portuguese: 4 (0.05%)
Kenyan: 4 (0.05%) Most common places of birth for foreign-born residents (%): Micronesia Hendersonville:
16.7% (127)North Carolina:
0.0% (298)
Mexico Hendersonville:
13.9% (106)North Carolina:
24.7% (214,776)
Colombia Hendersonville:
10.9% (83)North Carolina:
2.1% (18,275)
Canada Hendersonville:
10.5% (80)North Carolina:
2.1% (18,105)
Honduras Hendersonville:
7.6% (58)North Carolina:
4.7% (40,707)
El Salvador Hendersonville:
6.3% (48)North Carolina:
3.8% (33,379)
Germany Hendersonville:
5.5% (42)North Carolina:
1.8% (15,534)
Hungary Hendersonville:
4.5% (34)North Carolina:
0.2% (1,491)
England Hendersonville:
4.5% (34)North Carolina:
1.2% (10,140)
Poland Hendersonville:
4.5% (34)North Carolina:
0.4% (3,607)
Netherlands Hendersonville:
2.8% (21)North Carolina:
0.2% (1,461)
China, excluding Hong Kong and Taiwan Hendersonville:
2.5% (19)North Carolina:
3.2% (27,477)
Cambodia Hendersonville:
2.2% (17)North Carolina:
0.3% (2,583)
Nicaragua Hendersonville:
1.8% (14)North Carolina:
0.5% (4,128)
Argentina Hendersonville:
1.7% (13)North Carolina:
0.4% (3,710)
Place of birth for U.S.-born residents:
This state: 6,081Other state: 8,402Northeast: 1,989Midwest: 1,709South: 3,961West: 742 82.0% of Hendersonville residents lived in the same house 1 years ago.
Out of people who lived in different houses, 28.0% lived in this county.
Out of people who lived in different counties, 42.6% lived in North Carolina.
Hendersonville:
82.0%State average:
87.3%
Education attainment for males 25 years and older:
No schooling: 141Nursery to 4th grade: 925th and 6th grade: 147th and 8th grade: 929th grade: 510th grade: 2411th grade: 9512th grade, no diploma: 72High school graduate (or equivalency): 1,098Less than 1 year of college: 389Some college more than 1 year, no degree: 604Associate degree: 456Bachelor's degree: 1,347Master's degree: 406Professional school degree: 206Doctorate degree: 159
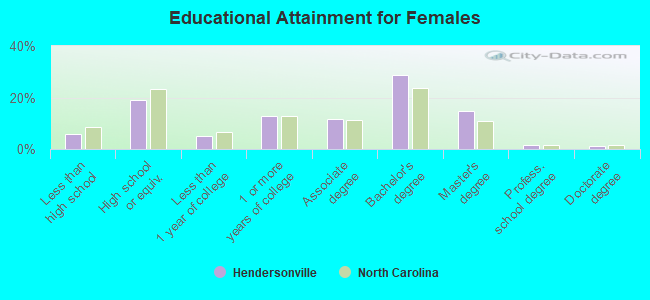
Education attainment for females 25 years and older:
No schooling: 19Nursery to 4th grade: 05th and 6th grade: 117th and 8th grade: 719th grade: 3410th grade: 13611th grade: 3312th grade, no diploma: 100High school graduate (or equivalency): 1,297Less than 1 year of college: 332Some college more than 1 year, no degree: 857Associate degree: 786Bachelor's degree: 1,944Master's degree: 990Professional school degree: 102Doctorate degree: 69
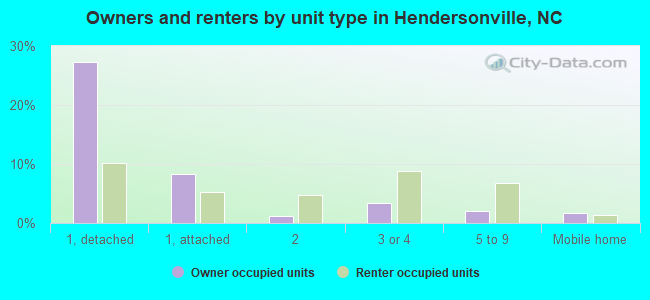
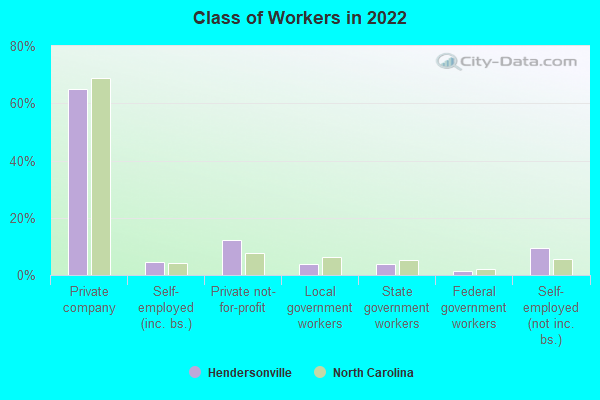
Housing units in structures:
One, detached: 3,473One, attached: 691Two: 5433 or 4: 1,0385 to 9: 76010 to 19: 66920 to 49: 45550 or more: 561Mobile homes: 251Boats, RVs, vans, etc.: 8Median worth of mobile homes: $45,121
Housing units lacking complete plumbing facilities in 2022: 0.9%Housing units lacking complete kitchen facilities in 2022: 1.9%House/condo owner moved in on average 8 years ago
Renter moved in on average 3 years ago
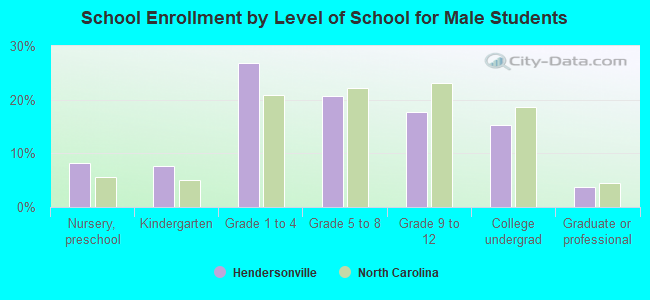
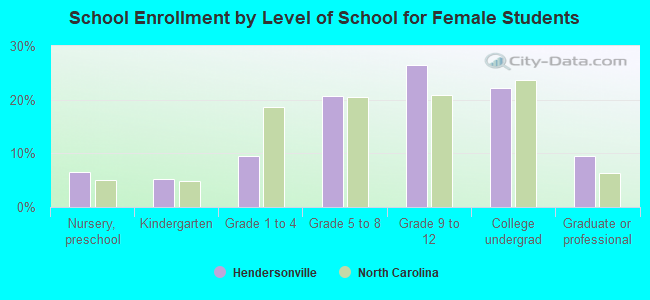
Private vs. public school enrollment:
Students in private schools in grades 1 to 8 (elementary and middle school): 283 Here:
27.3%North Carolina:
13.8%
Students in private schools in grades 9 to 12 (high school): 78 Here:
14.3%North Carolina:
11.9%
Students in private undergraduate colleges: 49 Here:
10.1%North Carolina:
19.3%