Henrietta, TX (Texas) Houses and Residents
| Henrietta: | $148,114 |
| Texas: | $275,400 |
Mean price in 2022:
Detached houses: $156,387
Here: $156,387 State: $369,058 Mobile homes: $78,121
Here: $78,121 State: $124,413
Total population: 3,016 (Urban population: 2,966 (all inside urban clusters), Rural population: 340 (all nonfarm))
Houses: 1,510 (1,328 occupied: 1,024 owner occupied, 324 renter occupied)
| % of renters here: | 24% |
| State: | 38% |
Housing density: 321 houses/condos per square mile
Median price asked for vacant for-sale houses and condos in 2022 in this county: $115,218.
Median contract rent in 2022: $530 (lower quartile is $452, upper quartile is $826)
Median rent asked for vacant for-rent units in 2022: $21,023
Median gross rent in Henrietta, TX in 2022: $747
Housing units in Henrietta with a mortgage: 474 (22 second mortgage, 0 home equity loan, 24 both second mortgage and home equity loan)
Houses without a mortgage: 0
Median household income for houses/condos with a mortgage: $87,200
Median household income for apartments without a mortgage: $44,328
Median monthly housing costs: $857
Compare current foreclosures near Henrietta, TX:
| Photo | Address | Area | Beds / Baths | Price | Details |
|---|---|---|---|---|---|

|
#1
S Red River St
Henrietta, TX 76365
|
928 sq. feet
|
1 baths 2 beds |
show details | |

|
#2
W Lamar St
Henrietta, TX 76365
|
- sq. feet
|
- baths - beds |
show details | |

|
#3
W Omega St
Henrietta, TX 76365
|
- sq. feet
|
- baths - beds |
show details | |

|
#4
E Crafton St
Henrietta, TX 76365
|
- sq. feet
|
- baths - beds |
show details | |

|
#5
Chisholm Trl
Henrietta, TX 76365
|
1,401 sq. feet
|
- baths - beds |
show details | |

|
#6
Crow Trce
Henrietta, TX 76365
|
- sq. feet
|
- baths - beds |
show details | |

|
#7
E Crafton St
Henrietta, TX 76365
|
1,418 sq. feet
|
- baths - beds |
show details | |

|
#8
N Hammond St
Henrietta, TX 76365
|
1,152 sq. feet
|
- baths - beds |
show details | |

|
#9
E Ikard St
Henrietta, TX 76365
|
2,502 sq. feet
|
- baths - beds |
show details | |

|
#10
Fm 172
Henrietta, TX 76365
|
- sq. feet
|
- baths - beds |
show details |
| Photo | Address | Area | Beds / Baths | Price | Details |
|---|---|---|---|---|---|

|
#11
E Gilbert St
Henrietta, TX 76365
|
- sq. feet
|
- baths - beds |
show details | |

|
#12
S Central Avenue
Petrolia, TX 76377
|
1,100 sq. feet
|
2 baths 3 beds |
show details | |

|
#13
S Prairie Avenue
Petrolia, TX 76377
|
14,000 sq. feet
|
3 baths 4 beds |
show details | |

|
#14
N Morgan Street
Petrolia, TX 76377
|
1,140 sq. feet
|
4 baths 3 beds |
show details | |

|
#15
Harding St
Wichita Falls, TX 76301
|
1,725 sq. feet
|
1 baths 3 beds |
show details | |

|
#16
Star Ave
Wichita Falls, TX 76301
|
2,236 sq. feet
|
2 baths 3 beds |
show details | |

|
#17
Osage Ave
Wichita Falls, TX 76301
|
- sq. feet
|
- baths - beds |
show details | |

|
#18
Thompson Rd Apt 1021
Wichita Falls, TX 76301
|
- sq. feet
|
- baths - beds |
show details | |

|
#19
Old Windthorst Rd
Wichita Falls, TX 76301
|
- sq. feet
|
- baths - beds |
show details | |

|
#20
Wallace Rd
Wichita Falls, TX 76305
|
1,318 sq. feet
|
- baths - beds |
show details |
| Photo | Address | Area | Beds / Baths | Price | Details |
|---|---|---|---|---|---|

|
#21
Oceola Ave
Wichita Falls, TX 76301
|
- sq. feet
|
- baths - beds |
show details | |

|
#22
State Highway 79 N
Wichita Falls, TX 76305
|
2,292 sq. feet
|
- baths - beds |
show details | |

|
#23
War Path Trl
Wichita Falls, TX 76310
|
- sq. feet
|
- baths - beds |
show details | |

|
#24
Piegan Trl
Wichita Falls, TX 76310
|
1,160 sq. feet
|
- baths - beds |
show details | |

|
#25
Thompson Rd Apt 1022
Wichita Falls, TX 76301
|
- sq. feet
|
- baths - beds |
show details | |

|
Check over 1 million property listings on Foreclosure.com!
|
browse all offers | |||

Latest news about housing in Henrietta, TX collected exclusively by city-data.com from local newspapers, TV, and radio stations

 | Where in Dallas can I find reasonable Houses under $100 k (20 replies) |
| Frisco, Plano, or Mckinney? (a ramble) (37 replies) |
| Iowa park vs. Henrietta vs. Marquez? Which is the best area to live and raise a family? (0 replies) |
| Legends of Hutto vs Riverwalk? (21 replies) |
| Help me decide where to move! (22 replies) |
| Looking for Place to Retire (14 replies) |

Median year apartment built: 1961
Household type by relationship:
Households: 3,198- Male householders: 594 (194 living alone), Female householders: 715 (265 living alone)
727 spouses (703 opposite-sex spouses), 3 unmarried partners, (0 opposite-sex unmarried partners), 828 children (799 natural, 10 adopted, 18 stepchildren), 113 grandchildren, 0 brothers or sisters, 22 parents, 0 foster children, 67 other relatives, 35 non-relatives
- In group quarters: 89
Size of family households: 404 2-persons, 211 3-persons, 112 4-persons, 95 5-persons, 26 7-or-more-persons.
Size of nonfamily households: 484 1-person, 14 2-persons, 3 5-persons.
369 married couples with children.
242 single-parent households (16 men, 226 women).
97.8% of residents of Henrietta speak English at home.
2.0% of residents speak Spanish at home (29% speak English very well, 37% speak English well, 13% speak English not well, 21% don't speak English at all).
0.4% of residents speak Asian or Pacific Island language at home (100% speak English very well).
Foreign born population: 53 (1.7%)
(62.3% of them are naturalized citizens)
| Here: | 6.1 |
| State: | 6.3 |
| Here: | 4.6 |
| State: | 4.0 |

- Bedrooms in owner-occupied houses and condos in Henrietta, Texas
- 0no bedroom
- 241 bedroom
- 2052 bedrooms
- 6653 bedrooms
- 1134 bedrooms
- 175+ bedrooms

- Bedrooms in renter-occupied apartments in Henrietta, Texas
- 0no bedroom
- 221 bedroom
- 1302 bedrooms
- 1323 bedrooms
- 404 bedrooms
- 05+ bedrooms

- Cars and other vehicles available in Henrietta in owner-occupied houses/condos
- 29no vehicle
- 3441 vehicle
- 4112 vehicles
- 1533 vehicles
- 614 vehicles
- 265+ vehicles

- Cars and other vehicles available in Henrietta in renter-occupied apartments
- 15no vehicle
- 1621 vehicle
- 1442 vehicles
- 43 vehicles
- 04 vehicles
- 05+ vehicles

- Rooms in owner-occupied houses in Henrietta, Texas
- 01 room
- 112 rooms
- 313 rooms
- 754 rooms
- 2175 rooms
- 3006 rooms
- 2297 rooms
- 888 rooms
- 749+ rooms

- Rooms in renter-occupied apartments in Henrietta, Texas
- 01 room
- 02 rooms
- 413 rooms
- 1074 rooms
- 755 rooms
- 326 rooms
- 707 rooms
- 08 rooms
- 09+ rooms


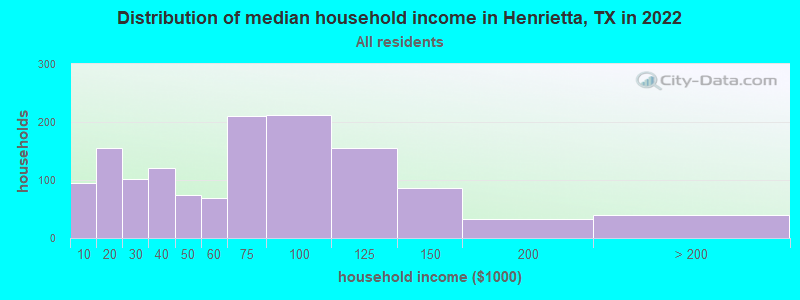
Henrietta, TX household income distribution

- 94Less than $10,000
- 156$10,000 to $19,999
- 101$20,000 to $29,999
- 120$30,000 to $39,999
- 75$40,000 to $49,999
- 69$50,000 to $59,999
- 211$60,000 to $74,999
- 212$75,000 to $99,999
- 155$100,000 to $124,999
- 87$125,000 to $149,999
- 33$150,000 to $199,999
- 39$200,000 or more
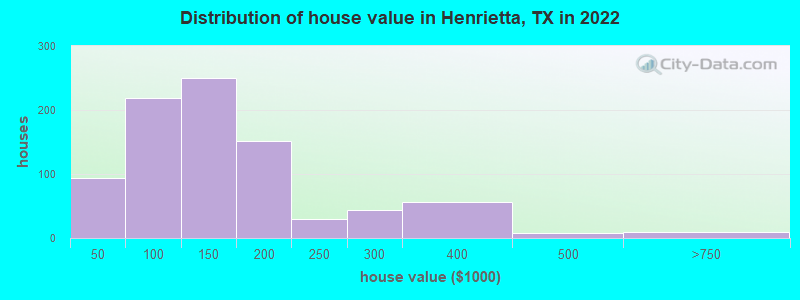
Home value of owner - occupied houses in 2022 in Henrietta, TX
-
- 33Less than $10,000
- 15$10,000 to $14,999
- 8$20,000 to $24,999
- 12$25,000 to $29,999
- 10$30,000 to $34,999
- 13$40,000 to $49,999
- 40$50,000 to $59,999
- 18$60,000 to $69,999
- 6$70,000 to $79,999
- 95$80,000 to $89,999
- 42$90,000 to $99,999
- 103$100,000 to $124,999
- 146$125,000 to $149,999
- 95$150,000 to $174,999
- 57$175,000 to $199,999
- 29$200,000 to $249,999
- 43$250,000 to $299,999
- 55$300,000 to $399,999
- 8$400,000 to $499,999
- 8$500,000 to $749,999
Rent paid by renters in 2022 in Henrietta, TX
-
- 7$150 to $199
- 9$200 to $249
- 12$250 to $299
- 50$400 to $449
- 40$450 to $499
- 48$500 to $549
- 14$600 to $649
- 19$700 to $749
- 10$750 to $799
- 4$800 to $899
- 22$900 to $999
- 13$1,250 to $1,499
- 34$1,500 to $1,999
- 23No cash rent


Percentage of workers working in this county: 32.6%
Number of people working at home: 87 (6.2% of all workers)
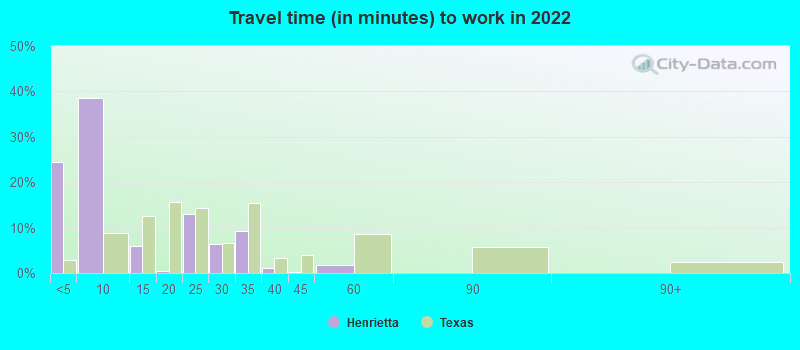
Travel time to work (commute)
- Less than 5 minutes: 156
- 5 to 9 minutes: 191
- 10 to 14 minutes: 28
- 15 to 19 minutes: 26
- 20 to 24 minutes: 216
- 25 to 29 minutes: 347
- 30 to 34 minutes: 173
- 35 to 39 minutes: 6
- 40 to 44 minutes: 33
- 45 to 59 minutes: 9
- 60 to 89 minutes: 0
- 90 or more minutes: 110
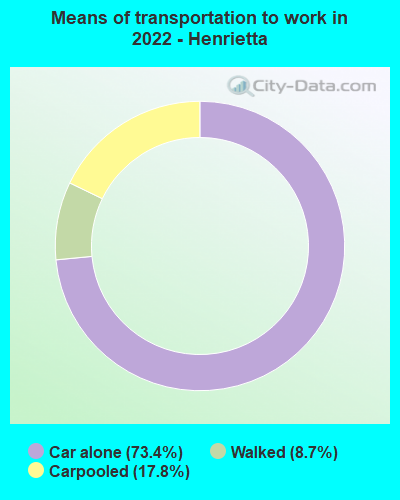
Means of transportation to work:
- Drove a car alone: 434 (62.9%)
- Carpooled: 114 (16.5%)
- Walked: 55 (8.0%)
- Worked at home: 87 (12.6%)

- Unemployment by race in 2022
- Unemployment rate for White non-Hispanic residents
- 2.3%Males
- 0.4%Females

- Year of entry for the foreign-born population in Henrietta, Texas
- 222010 or later
- 82000 to 2009
- 21990 to 1999
- 41980 to 1989
- 31970 to 1979
- 17Before 1970

First ancestries reported:
- English: 337 (34.1%)
- American: 185 (18.7%)
- Irish: 114 (11.5%)
- German: 112 (11.3%)
- Scotch-Irish: 42 (4.2%)
- Czechoslovakian: 25 (2.5%)
- European: 22 (2.2%)
- Swedish: 6 (0.6%)
- French: 4 (0.4%)
- Norwegian: 4 (0.4%)
Most common places of birth for foreign-born residents (%):
| Henrietta: | 45.3% (24) |
| Texas: | 48.4% (2,411,723) |
| Henrietta: | 26.4% (14) |
| Texas: | 0.8% (37,989) |
| Henrietta: | 22.6% (12) |
| Texas: | 2.1% (103,148) |
Place of birth for U.S.-born residents:
- This state: 2,699
- Other state: 409
- Northeast: 29
- Midwest: 23
- South: 192
- West: 166
80.2% of Henrietta residents lived in the same house 1 years ago.
Out of people who lived in different houses, 20.0% lived in this county.
Out of people who lived in different counties, 100.0% lived in Texas.
| Henrietta: | 80.2% |
| State average: | 85.7% |
Education attainment for males 25 years and older:
- No schooling: 11
- Nursery to 4th grade: 0
- 5th and 6th grade: 11
- 7th and 8th grade: 36
- 9th grade: 12
- 10th grade: 12
- 11th grade: 0
- 12th grade, no diploma: 6
- High school graduate (or equivalency): 307
- Less than 1 year of college: 47
- Some college more than 1 year, no degree: 143
- Associate degree: 39
- Bachelor's degree: 189
- Master's degree: 82
- Professional school degree: 37
- Doctorate degree: 11

Education attainment for females 25 years and older:
- No schooling: 0
- Nursery to 4th grade: 4
- 5th and 6th grade: 0
- 7th and 8th grade: 35
- 9th grade: 0
- 10th grade: 0
- 11th grade: 53
- 12th grade, no diploma: 0
- High school graduate (or equivalency): 300
- Less than 1 year of college: 124
- Some college more than 1 year, no degree: 278
- Associate degree: 70
- Bachelor's degree: 292
- Master's degree: 74
- Professional school degree: 0
- Doctorate degree: 0


Housing units in structures:
- One, detached: 1,307
- One, attached: 31
- Two: 33
- 3 or 4: 20
- Mobile homes: 117
Housing units lacking complete kitchen facilities in 2022: 0.9%
House/condo owner moved in on average 14 years ago
Renter moved in on average 3 years ago

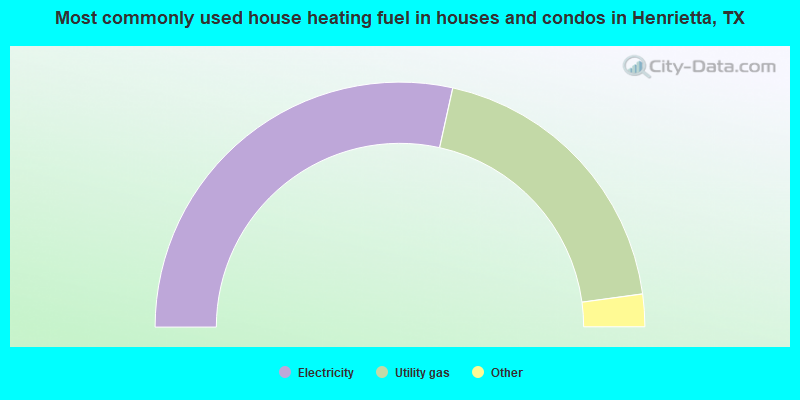
- 57.0%Electricity
- 38.8%Utility gas
- 3.0%Bottled, tank, or LP gas
- 1.2%No fuel used
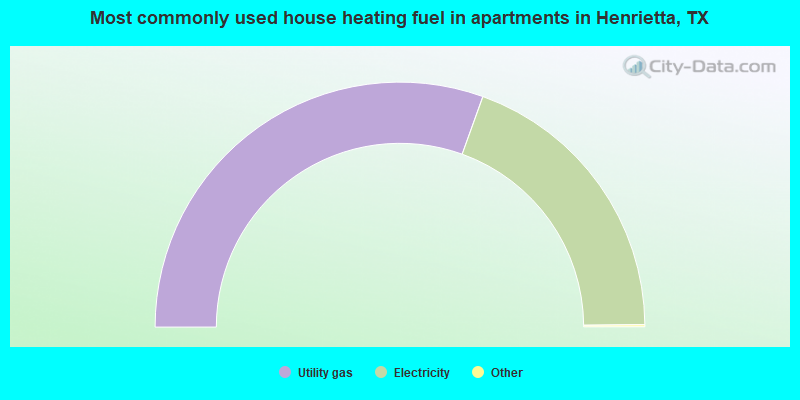
- 61.2%Utility gas
- 38.8%Electricity
Private vs. public school enrollment:
| Here: | 2.4% |
| Texas: | 8.8% |
| Here: | 0.0% |
| Texas: | 8.0% |
| Here: | 0.0% |
| Texas: | 16.2% |


