Hermosa Beach, CA (California) Houses and Residents
| Hermosa Beach: | $2,049,098 |
| California: | $715,900 |
Mean price in 2022:
Detached houses: $2,656,216
Here: $2,656,216 State: $988,808 Townhouses or other attached units: $2,229,023
Here: $2,229,023 State: $838,546 In 2-unit structures: $4,283,741
Here: $4,283,741 State: $1,138,100 In 3-to-4-unit structures: $3,582,039
Here: $3,582,039 State: $824,253 In 5-or-more-unit structures: $1,388,504
Here: $1,388,504 State: $730,996 Mobile homes: $385,791
Here: $385,791 State: $184,506
Total population: 19,891 (Urban population: 18,442, Rural population: 0)
Houses: 10,449 (8,986 occupied: 4,635 owner occupied, 4,385 renter occupied)
| % of renters here: | 49% |
| State: | 44% |
Housing density: 7,307 houses/condos per square mile
Median price asked for vacant for-sale houses and condos in 2022: $2,096,629.
Median contract rent in 2022: over $2,000 (lower quartile is over $2,000, upper quartile is over $2,000)
Median rent asked for vacant for-rent units in 2022: $2,579
Median gross rent in Hermosa Beach, CA in 2022: over $2,000
Housing units in Hermosa Beach with a mortgage: 3,239 (483 second mortgage, 26 home equity loan, 424 both second mortgage and home equity loan)
Houses without a mortgage: 19
Median household income for houses/condos with a mortgage: $248,703
Median household income for apartments without a mortgage: $108,722
Median monthly housing costs: $2,909
Compare current foreclosures near Hermosa Beach, CA:
| Photo | Address | Area | Beds / Baths | Price | Details |
|---|---|---|---|---|---|

|
#1
Bonnie Brae St
Hermosa Beach, CA 90254
|
2,471 sq. feet
|
3 baths 3 beds |
show details | |

|
#2
Manhattan Ave
Hermosa Beach, CA 90254
|
1,770 sq. feet
|
3 baths 3 beds |
show details | |

|
#3
Monterey Blvd
Hermosa Beach, CA 90254
|
716 sq. feet
|
1 baths 2 beds |
show details | |

|
#4
21st St
Hermosa Beach, CA 90254
|
912 sq. feet
|
1 baths 2 beds |
show details | |

|
#5
Bonnie Brae St
Hermosa Beach, CA 90254
|
2,471 sq. feet
|
3 baths 3 beds |
show details | |

|
#6
The Strand
Hermosa Beach, CA 90254
|
1,451 sq. feet
|
1 baths 2 beds |
show details | |

|
#7
9th St Apt A
Hermosa Beach, CA 90254
|
- sq. feet
|
- baths - beds |
show details | |

|
#8
Cedarbrook Dr
Beverly Hills, CA 90210
|
2,371 sq. feet
|
2 baths 3 beds |
$2,350,000
|
show details |

|
#9
Flicker Way
West Hollywood, CA 90069
|
1,612 sq. feet
|
3 baths 3 beds |
$1,207,500
|
show details |

|
#10
Horn Ave Apt 618
West Hollywood, CA 90069
|
797 sq. feet
|
1 baths 1 beds |
$650,000
|
show details |
| Photo | Address | Area | Beds / Baths | Price | Details |
|---|---|---|---|---|---|

|
#11
Pacific Coast Hwy
Hermosa Beach, CA 90254
|
- sq. feet
|
- baths - beds |
show details | |

|
#12
8th Pl
Hermosa Beach, CA 90254
|
- sq. feet
|
- baths - beds |
show details | |

|
#13
Wilshire Blvd Apt 703
Los Angeles, CA 90024
|
2,245 sq. feet
|
2 baths 2 beds |
$1,750,000
|
show details |

|
#14
And 1240 Exposition
Los Angeles, CA 90007
|
- sq. feet
|
2 baths 2 beds |
$614,900
|
show details |

|
#15
W Arbor St # 57
Long Beach, CA 90805
|
1,585 sq. feet
|
2 baths 3 beds |
show details | |

|
#16
W 73rd St
Los Angeles, CA 90047
|
1,700 sq. feet
|
2 baths 2 beds |
show details | |

|
#17
Marina City Dr Unit 116
Marina Del Rey, CA 90292
|
1,722 sq. feet
|
2 baths 3 beds |
show details | |

|
#18
Marina City Drive # Ph 29
Marina Del Rey, CA 90292
|
3,200 sq. feet
|
2 baths 2 beds |
show details | |

|
#19
Redondo Avenue, Units 5-8
Long Beach, CA 90804
|
3,360 sq. feet
|
4 baths 8 beds |
show details | |

|
#20
Elburg St Unit A
Paramount, CA 90723
|
1,131 sq. feet
|
2 baths 3 beds |
show details |
| Photo | Address | Area | Beds / Baths | Price | Details |
|---|---|---|---|---|---|

|
#21
E 60th St
Los Angeles, CA 90001
|
1,883 sq. feet
|
3 baths 5 beds |
show details | |

|
#22
W 110th St
Inglewood, CA 90303
|
3,481 sq. feet
|
4 baths 6 beds |
show details | |

|
#23
Greenfield Ave
Los Angeles, CA 90025
|
1,224 sq. feet
|
2 baths 2 beds |
show details | |

|
#24
6th Ave
Venice, CA 90291
|
3,192 sq. feet
|
3 baths 6 beds |
show details | |

|
#25
W 98th St
Los Angeles, CA 90044
|
1,022 sq. feet
|
2 baths 3 beds |
show details | |

|
#26
Chalon Rd
Los Angeles, CA 90077
|
3,066 sq. feet
|
6 baths 3 beds |
show details | |

|
#27
Alsace Ave
Los Angeles, CA 90019
|
4,186 sq. feet
|
4 baths 8 beds |
show details | |

|
#28
Greenfield Ave Apt 202
Los Angeles, CA 90025
|
1,540 sq. feet
|
2 baths 2 beds |
show details | |

|
#29
E 91st St
Los Angeles, CA 90002
|
1,694 sq. feet
|
2 baths 5 beds |
show details | |

|
#30
Sunlight Pl
Los Angeles, CA 90016
|
1,932 sq. feet
|
2 baths 3 beds |
show details |
| Photo | Address | Area | Beds / Baths | Price | Details |
|---|---|---|---|---|---|

|
#31
Dalkeith Ave
Los Angeles, CA 90049
|
3,624 sq. feet
|
4 baths 4 beds |
show details | |

|
#32
E Keynote St
Long Beach, CA 90808
|
1,064 sq. feet
|
1 baths 2 beds |
show details | |

|
#33
W 104th St
Inglewood, CA 90304
|
787 sq. feet
|
1 baths 2 beds |
show details | |

|
#34
4th Ave
Los Angeles, CA 90008
|
1,265 sq. feet
|
1 baths 2 beds |
show details | |

|
#35
E 7th St
Long Beach, CA 90813
|
2,456 sq. feet
|
4 baths 6 beds |
show details | |

|
#36
N Riddle Ave
Los Angeles, CA 90059
|
1,238 sq. feet
|
2 baths 2 beds |
show details | |

|
#37
S Garth Ave
Los Angeles, CA 90056
|
2,295 sq. feet
|
2 baths 3 beds |
show details | |

|
#38
S Grand Ave
San Pedro, CA 90731
|
1,280 sq. feet
|
1 baths 2 beds |
show details | |

|
#39
Ocana Ave
Bellflower, CA 90706
|
1,218 sq. feet
|
2 baths 3 beds |
show details | |

|
#40
W 76th St
Inglewood, CA 90305
|
1,668 sq. feet
|
2 baths 3 beds |
show details |
| Photo | Address | Area | Beds / Baths | Price | Details |
|---|---|---|---|---|---|

|
#41
4th Ave
Los Angeles, CA 90008
|
1,392 sq. feet
|
2 baths 2 beds |
show details | |

|
#42
W 107th St
Inglewood, CA 90304
|
873 sq. feet
|
1 baths 2 beds |
show details | |

|
#43
Village Way
Signal Hill, CA 90755
|
1,524 sq. feet
|
3 baths 3 beds |
show details | |

|
#44
S Cabrillo Ave
San Pedro, CA 90731
|
1,682 sq. feet
|
2 baths 4 beds |
show details | |

|
#45
E 107th St
Los Angeles, CA 90002
|
748 sq. feet
|
1 baths 2 beds |
show details | |

|
#46
S Broadacres Ave
Compton, CA 90220
|
2,234 sq. feet
|
2 baths 5 beds |
show details | |

|
#47
S Bentley Ave
Compton, CA 90220
|
1,738 sq. feet
|
2 baths 4 beds |
show details | |

|
#48
Liberty Blvd
South Gate, CA 90280
|
1,488 sq. feet
|
2 baths 3 beds |
show details | |

|
#49
Dinwiddie St
Downey, CA 90241
|
2,152 sq. feet
|
3 baths 4 beds |
show details | |

|
Check over 1 million property listings on Foreclosure.com!
|
browse all offers | |||


 | Why is renting houses cheaper than apartments!? (3 replies) |
| Possibly working in Hawthorne area - Advice on apartments? (2 replies) |
| Is it just me, or is most of Torrance hideous-looking? (97 replies) |
| Hermosa Beach to South Culver City? (18 replies) |
| Apartments in Hermosa Beach / Manhattan Beach (10 replies) |
| Professional couple moving from NYC Neighborhood Guidance (35 replies) |

Median year apartment built: 1970
Household type by relationship:
Households: 19,126- Male householders: 5,014 (1,735 living alone), Female householders: 3,674 (1,272 living alone)
3,745 spouses (3,678 opposite-sex spouses), 984 unmarried partners, (916 opposite-sex unmarried partners), 4,244 children (4,080 natural, 24 adopted, 139 stepchildren), 135 grandchildren, 96 brothers or sisters, 54 parents, 0 foster children, 158 other relatives, 999 non-relatives
- In group quarters: 16
Size of family households: 2,369 2-persons, 1,082 3-persons, 767 4-persons, 274 5-persons, 53 6-persons, 18 7-or-more-persons.
Size of nonfamily households: 3,226 1-person, 1,082 2-persons, 206 3-persons, 19 4-persons, 33 5-persons.
2,625 married couples with children.
770 single-parent households (228 men, 542 women).
88.4% of residents of Hermosa Beach speak English at home.
4.1% of residents speak Spanish at home (76% speak English very well, 19% speak English well, 5% speak English not well).
5.5% of residents speak other Indo-European language at home (94% speak English very well, 3% speak English well, 2% speak English not well).
2.5% of residents speak Asian or Pacific Island language at home (55% speak English very well, 32% speak English well, 13% speak English not well).
0.7% of residents speak other language at home (100% speak English very well).
Foreign born population: 2,266 (11.8%)
(67.7% of them are naturalized citizens)
| Here: | 5.8 |
| State: | 6.0 |
| Here: | 3.5 |
| State: | 3.9 |

- Bedrooms in owner-occupied houses and condos in Hermosa Beach, California
- 0no bedroom
- 1581 bedroom
- 8522 bedrooms
- 2,3633 bedrooms
- 1,0524 bedrooms
- 2095+ bedrooms

- Bedrooms in renter-occupied apartments in Hermosa Beach, California
- 377no bedroom
- 1,6561 bedroom
- 1,5552 bedrooms
- 6343 bedrooms
- 1654 bedrooms
- 05+ bedrooms

- Cars and other vehicles available in Hermosa Beach in owner-occupied houses/condos
- 95no vehicle
- 1,3021 vehicle
- 2,2352 vehicles
- 7273 vehicles
- 2614 vehicles
- 145+ vehicles

- Cars and other vehicles available in Hermosa Beach in renter-occupied apartments
- 491no vehicle
- 2,1731 vehicle
- 1,5062 vehicles
- 1563 vehicles
- 254 vehicles
- 345+ vehicles

- Rooms in owner-occupied houses in Hermosa Beach, California
- 01 room
- 762 rooms
- 1403 rooms
- 6594 rooms
- 1,0625 rooms
- 1,0516 rooms
- 6197 rooms
- 4568 rooms
- 5729+ rooms

- Rooms in renter-occupied apartments in Hermosa Beach, California
- 3301 room
- 7542 rooms
- 1,1623 rooms
- 9984 rooms
- 7855 rooms
- 2206 rooms
- 587 rooms
- 458 rooms
- 349+ rooms


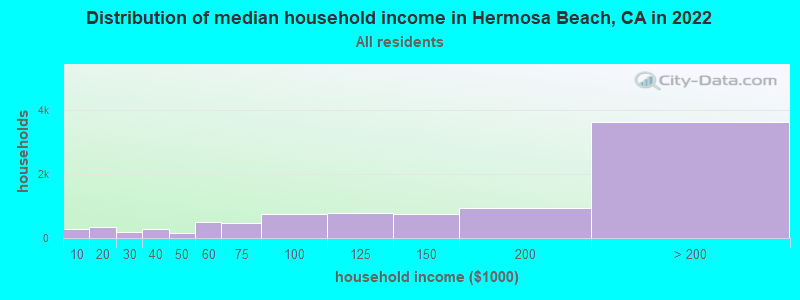
Hermosa Beach, CA household income distribution

- 293Less than $10,000
- 348$10,000 to $19,999
- 191$20,000 to $29,999
- 273$30,000 to $39,999
- 153$40,000 to $49,999
- 485$50,000 to $59,999
- 458$60,000 to $74,999
- 748$75,000 to $99,999
- 772$100,000 to $124,999
- 765$125,000 to $149,999
- 935$150,000 to $199,999
- 3,625$200,000 or more
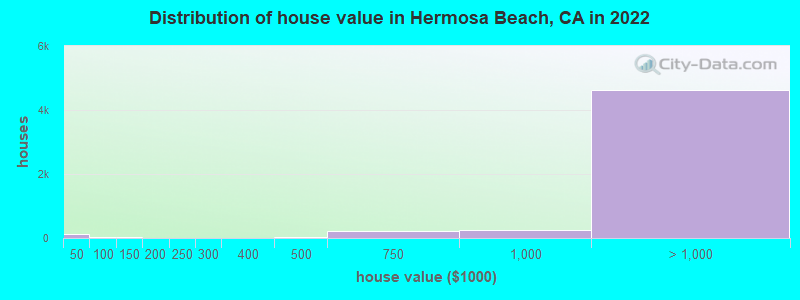
Home value of owner - occupied houses in 2022 in Hermosa Beach, CA
-
- 37Less than $10,000
- 20$15,000 to $19,999
- 6$20,000 to $24,999
- 4$25,000 to $29,999
- 35$30,000 to $34,999
- 7$35,000 to $39,999
- 24$90,000 to $99,999
- 33$100,000 to $124,999
- 3$200,000 to $249,999
- 11$250,000 to $299,999
- 14$300,000 to $399,999
- 36$400,000 to $499,999
- 208$500,000 to $749,999
- 254$750,000 to $999,999
- 751$1,000,000 to $1,499,999
- 1,449$1,500,000 to $1,999,999
- 2,423$2,000,000 or more
Rent paid by renters in 2022 in Hermosa Beach, CA
-
- 5Less than $100
- 6$300 to $349
- 83$650 to $699
- 14$700 to $749
- 13$900 to $999
- 127$1,000 to $1,249
- 87$1,250 to $1,499
- 514$1,500 to $1,999
- 1,128$2,000 to $2,499
- 937$2,500 to $2,999
- 493$3,000 to $3,499
- 948$3,500 or more
- 86No cash rent


Percentage of workers working in this county: 96.1%
Number of people working at home: 3,941 (36.5% of all workers)
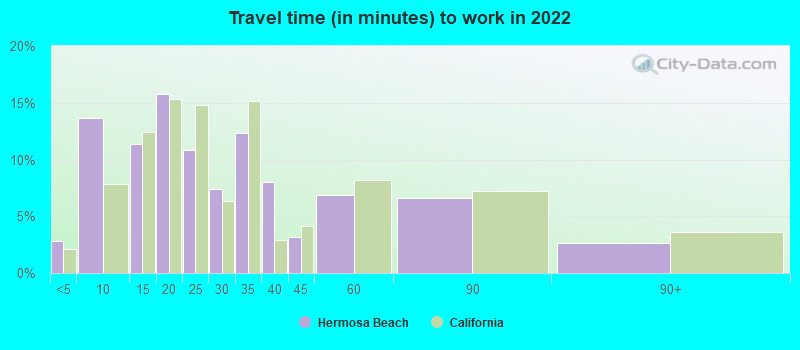
Travel time to work (commute)
- Less than 5 minutes: 120
- 5 to 9 minutes: 786
- 10 to 14 minutes: 844
- 15 to 19 minutes: 801
- 20 to 24 minutes: 1,032
- 25 to 29 minutes: 446
- 30 to 34 minutes: 865
- 35 to 39 minutes: 253
- 40 to 44 minutes: 350
- 45 to 59 minutes: 974
- 60 to 89 minutes: 776
- 90 or more minutes: 165
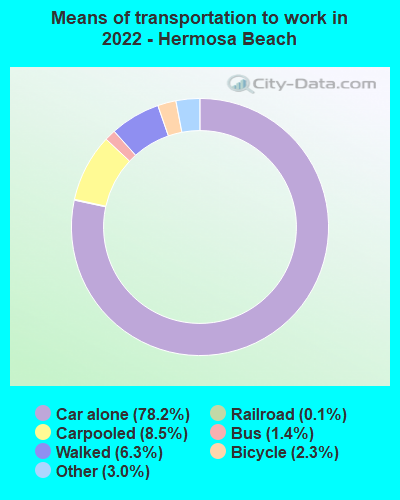
Means of transportation to work:
- Drove a car alone: 4,408 (49.0%)
- Carpooled: 529 (5.9%)
- Bus: 72 (0.8%)
- Light rail, streetcar or trolley: 4 (0.0%)
- Taxi: 187 (2.1%)
- Bicycle: 136 (1.5%)
- Walked: 386 (4.3%)
- Worked at home: 3,941 (43.8%)

- Unemployment by race in 2022
- Unemployment rate for White non-Hispanic residents
- 3.5%Males
- 4.3%Females
- Unemployment rate for Asian residents
- 1.5%Males
- 9.9%Females
- Unemployment rate for other race residents
- 4.0%Males
- Unemployment rate for two or more race residents
- 2.3%Males
- Unemployment rate for Hispanic or Latino residents
- 1.4%Males
- 12.3%Females

- Year of entry for the foreign-born population in Hermosa Beach, California
- 6472010 or later
- 3172000 to 2009
- 4291990 to 1999
- 3981980 to 1989
- 2731970 to 1979
- 395Before 1970

First ancestries reported:
- German: 772 (9.0%)
- European: 771 (8.9%)
- English: 640 (7.4%)
- Italian: 591 (6.9%)
- Irish: 500 (5.8%)
- American: 439 (5.1%)
- Iranian: 220 (2.6%)
- Polish: 212 (2.5%)
- Norwegian: 207 (2.4%)
- Eastern European: 104 (1.2%)
- Greek: 103 (1.2%)
- Dutch: 97 (1.1%)
- Russian: 94 (1.1%)
- British: 88 (1.0%)
- Northern European: 84 (1.0%)
- Czech: 76 (0.9%)
- Ukrainian: 64 (0.7%)
- Danish: 61 (0.7%)
- Serbian: 53 (0.6%)
- Portuguese: 53 (0.6%)
- Welsh: 49 (0.6%)
- Romanian: 47 (0.5%)
- Scottish: 43 (0.5%)
- Belgian: 40 (0.5%)
- Macedonian: 38 (0.4%)
- Swedish: 38 (0.4%)
- Canadian: 36 (0.4%)
- Scandinavian: 35 (0.4%)
- Lebanese: 33 (0.4%)
- French: 32 (0.4%)
- Australian: 31 (0.4%)
- Afghan: 29 (0.3%)
- African: 23 (0.3%)
- Slovene: 21 (0.2%)
- French Canadian: 20 (0.2%)
- Scotch-Irish: 20 (0.2%)
- Brazilian: 19 (0.2%)
- Armenian: 18 (0.2%)
- Syrian: 18 (0.2%)
- Nigerian: 17 (0.2%)
- Finnish: 11 (0.1%)
- Icelander: 10 (0.1%)
- Swiss: 10 (0.1%)
- Israeli: 8 (0.09%)
- Turkish: 7 (0.08%)
- Jamaican: 7 (0.08%)
- Palestinian: 6 (0.07%)
Most common places of birth for foreign-born residents (%):
| Hermosa Beach: | 8.3% (189) |
| California: | 0.7% (73,304) |
| Hermosa Beach: | 8.2% (186) |
| California: | 7.8% (818,297) |
| Hermosa Beach: | 8.1% (184) |
| California: | 4.9% (512,335) |
| Hermosa Beach: | 7.1% (160) |
| California: | 0.6% (60,582) |
| Hermosa Beach: | 6.5% (147) |
| California: | 1.2% (127,477) |
| Hermosa Beach: | 6.4% (144) |
| California: | 0.5% (53,222) |
| Hermosa Beach: | 5.8% (132) |
| California: | 2.0% (206,004) |
| Hermosa Beach: | 5.1% (116) |
| California: | 0.2% (23,338) |
| Hermosa Beach: | 4.7% (106) |
| California: | 5.2% (539,184) |
| Hermosa Beach: | 4.3% (98) |
| California: | 0.4% (39,097) |
| Hermosa Beach: | 3.5% (80) |
| California: | 37.2% (3,881,193) |
| Hermosa Beach: | 3.0% (67) |
| California: | 1.7% (176,274) |
| Hermosa Beach: | 2.1% (47) |
| California: | 0.5% (55,249) |
| Hermosa Beach: | 1.8% (41) |
| California: | 6.6% (684,672) |
| Hermosa Beach: | 1.8% (41) |
| California: | 0.1% (10,213) |
| Hermosa Beach: | 1.7% (39) |
| California: | 0.3% (31,757) |
| Hermosa Beach: | 1.5% (34) |
| California: | 0.2% (20,997) |
| Hermosa Beach: | 1.5% (34) |
| California: | 0.2% (21,276) |
Place of birth for U.S.-born residents:
- This state: 9,407
- Other state: 7,086
- Northeast: 2,388
- Midwest: 2,604
- South: 1,440
- West: 663
85.4% of Hermosa Beach residents lived in the same house 1 years ago.
Out of people who lived in different houses, 37.7% lived in this county.
Out of people who lived in different counties, 41.7% lived in California.
| Hermosa Beach: | 85.4% |
| State average: | 88.9% |
Education attainment for males 25 years and older:
- No schooling: 0
- Nursery to 4th grade: 0
- 5th and 6th grade: 0
- 7th and 8th grade: 0
- 9th grade: 0
- 10th grade: 35
- 11th grade: 0
- 12th grade, no diploma: 32
- High school graduate (or equivalency): 501
- Less than 1 year of college: 106
- Some college more than 1 year, no degree: 656
- Associate degree: 335
- Bachelor's degree: 3,828
- Master's degree: 1,913
- Professional school degree: 498
- Doctorate degree: 223

Education attainment for females 25 years and older:
- No schooling: 0
- Nursery to 4th grade: 8
- 5th and 6th grade: 0
- 7th and 8th grade: 8
- 9th grade: 0
- 10th grade: 0
- 11th grade: 0
- 12th grade, no diploma: 42
- High school graduate (or equivalency): 377
- Less than 1 year of college: 285
- Some college more than 1 year, no degree: 489
- Associate degree: 270
- Bachelor's degree: 3,419
- Master's degree: 1,619
- Professional school degree: 371
- Doctorate degree: 129


Housing units in structures:
- One, detached: 4,523
- One, attached: 1,102
- Two: 1,027
- 3 or 4: 1,050
- 5 to 9: 848
- 10 to 19: 467
- 20 to 49: 259
- 50 or more: 924
- Mobile homes: 133
- Boats, RVs, vans, etc.: 111
Median worth of mobile homes: $518,899
Housing units lacking complete kitchen facilities in 2022: 4.2%
House/condo owner moved in on average 16 years ago
Renter moved in on average 1 years ago

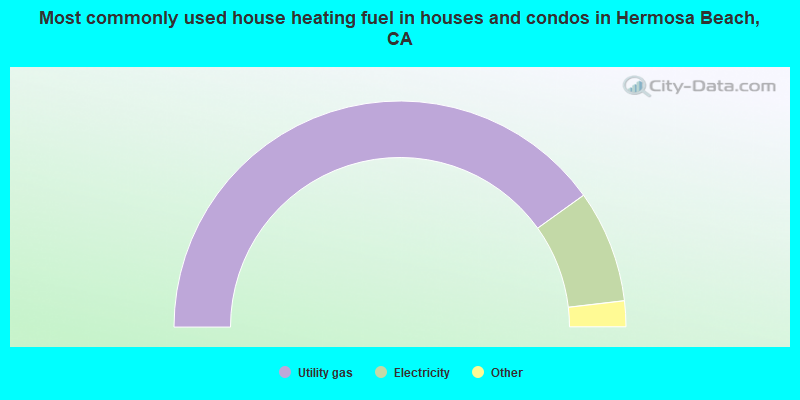
- 80.2%Utility gas
- 16.1%Electricity
- 1.5%No fuel used
- 1.4%Bottled, tank, or LP gas
- 0.8%Solar energy
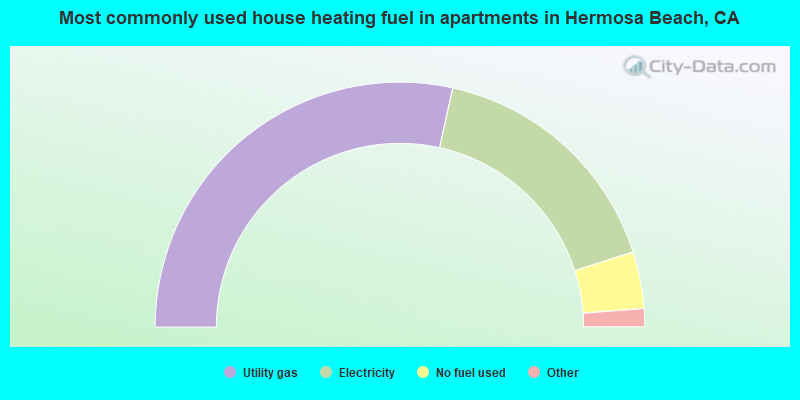
- 57.0%Utility gas
- 33.2%Electricity
- 7.5%No fuel used
- 1.7%Bottled, tank, or LP gas
- 0.2%Fuel oil, kerosene, etc.
- 0.2%Solar energy
- 0.2%Wood
Private vs. public school enrollment:
| Here: | 15.5% |
| California: | 10.5% |
| Here: | 18.1% |
| California: | 8.5% |
| Here: | 10.8% |
| California: | 15.9% |


