Herriman, UT (Utah) Houses and Residents
| Herriman: | $591,521 |
| Utah: | $499,500 |
Mean price in 2022:
Detached houses: $693,002
Here: $693,002 State: $607,750 Townhouses or other attached units: $594,263
Here: $594,263 State: $444,505 In 3-to-4-unit structures: $204,257
Here: $204,257 State: $362,850 In 5-or-more-unit structures: $409,402
Here: $409,402 State: $412,810
Total population: 28,556 (Urban population: 1,247, Rural population: 433 (67 farm, 366 nonfarm))
Houses: 17,133 (16,833 occupied: 13,613 owner occupied, 3,117 renter occupied)
| % of renters here: | 19% |
| State: | 29% |
Housing density: 1,880 houses/condos per square mile
Median price asked for vacant for-sale houses and condos in 2022: $55,161.
Median contract rent in 2022: $1,744 (lower quartile is $1,265, upper quartile is over $2,000)
Median rent asked for vacant for-rent units in 2022: $2,535
Median gross rent in Herriman, UT in 2022: $1,758
Housing units in Herriman with a mortgage: 11,029 (1,361 second mortgage, 0 home equity loan, 1,369 both second mortgage and home equity loan)
Houses without a mortgage: 195
Median household income for houses/condos with a mortgage: $130,409
Median household income for apartments without a mortgage: $120,201
Median monthly housing costs: $1,933
Compare current foreclosures in Herriman, UT:
| Photo | Address | Area | Beds / Baths | Price | Details |
|---|---|---|---|---|---|

|
#1
Mankato St
Herriman, UT 84096
|
1,468 sq. feet
|
2 baths 3 beds |
show details | |

|
#2
W Aspen Springs Dr
Herriman, UT 84096
|
1,334 sq. feet
|
2 baths 2 beds |
show details | |

|
#3
W Rose Willow Cir
Herriman, UT 84096
|
2,442 sq. feet
|
4 baths 4 beds |
show details | |

|
#4
S Duncan Meadow Ln
Herriman, UT 84096
|
1,438 sq. feet
|
2 baths 3 beds |
show details | |

|
#5
W Moon Shadow Dr
Herriman, UT 84096
|
1,300 sq. feet
|
2 baths 3 beds |
show details | |

|
#6
S Silver Trace Cir
Herriman, UT 84096
|
2,325 sq. feet
|
3 baths 4 beds |
show details | |

|
#7
W Windy Ridge Dr
Herriman, UT 84096
|
4,554 sq. feet
|
6 baths 5 beds |
show details | |

|
#8
Canary Bird Cv
Herriman, UT 84096
|
1,276 sq. feet
|
2 baths 3 beds |
show details | |

|
#9
S Pascall Bay
Herriman, UT 84096
|
1,380 sq. feet
|
2 baths 3 beds |
show details | |

|
#10
Flintlock Way
Herriman, UT 84096
|
1,683 sq. feet
|
2 baths 3 beds |
show details |
| Photo | Address | Area | Beds / Baths | Price | Details |
|---|---|---|---|---|---|

|
#11
S Lazy Creek Rd
Herriman, UT 84096
|
1,848 sq. feet
|
2 baths 3 beds |
show details | |

|
#12
Long Ridge Dr
Herriman, UT 84096
|
2,307 sq. feet
|
2 baths 3 beds |
show details | |

|
#13
W Little Water Peak Dr
Herriman, UT 84096
|
1,439 sq. feet
|
1 baths 3 beds |
show details | |

|
#14
W Heritage Hill Dr
Herriman, UT 84096
|
2,872 sq. feet
|
3 baths 5 beds |
show details | |

|
#15
S Overland Park Rd
Herriman, UT 84096
|
1,430 sq. feet
|
2 baths 3 beds |
show details | |

|
#16
W Spirit Lake Cir
Herriman, UT 84096
|
1,349 sq. feet
|
2 baths 3 beds |
show details | |

|
#17
W Black Powder Dr
Herriman, UT 84096
|
1,935 sq. feet
|
3 baths 5 beds |
show details | |

|
#18
S Eglantina Dr
Herriman, UT 84096
|
2,228 sq. feet
|
3 baths 5 beds |
show details | |

|
#19
S Murdoch Peak Dr
Herriman, UT 84096
|
1,200 sq. feet
|
2 baths 3 beds |
show details | |

|
#20
S Andreas St
Herriman, UT 84096
|
1,591 sq. feet
|
2 baths 3 beds |
show details |
| Photo | Address | Area | Beds / Baths | Price | Details |
|---|---|---|---|---|---|

|
#21
S Lamont Lowell Cir
Herriman, UT 84096
|
3,748 sq. feet
|
3 baths 4 beds |
show details | |

|
#22
W River Chase Rd
Herriman, UT 84096
|
4,100 sq. feet
|
3 baths 6 beds |
show details | |

|
#23
S Simplicity Pl
Herriman, UT 84096
|
1,617 sq. feet
|
2 baths 3 beds |
show details | |

|
#24
S Artistry Ln
Herriman, UT 84096
|
1,104 sq. feet
|
2 baths 3 beds |
show details | |

|
#25
S Rosie Ln
Herriman, UT 84096
|
3,742 sq. feet
|
2 baths 4 beds |
show details | |

|
#26
S Logans Run Cv
Herriman, UT 84096
|
1,187 sq. feet
|
2 baths 3 beds |
show details | |

|
#27
W Monument Peak Dr, Ste 418
Herriman, UT 84096
|
- sq. feet
|
- baths - beds |
show details | |

|
#28
W Mckellen Dr, # G304
Herriman, UT 84096
|
- sq. feet
|
- baths - beds |
show details | |

|
#29
W Cannavale Dr, # C202
Herriman, UT 84096
|
- sq. feet
|
- baths - beds |
show details | |

|
#30
S Mckellen Dr, # C101
Herriman, UT 84096
|
- sq. feet
|
- baths - beds |
show details |
| Photo | Address | Area | Beds / Baths | Price | Details |
|---|---|---|---|---|---|

|
#31
S Taylors Claim Ct
Herriman, UT 84096
|
- sq. feet
|
- baths - beds |
show details | |

|
#32
S Copper Oaks Dr
Herriman, UT 84096
|
- sq. feet
|
- baths - beds |
show details | |

|
#33
W Hill Shadow Way
Herriman, UT 84096
|
- sq. feet
|
- baths - beds |
show details | |

|
#34
W Terrabithia Ln # 103
Herriman, UT 84096
|
- sq. feet
|
- baths - beds |
show details | |

|
#35
S Dragonfly Ln Apt 301
Herriman, UT 84096
|
- sq. feet
|
- baths - beds |
show details | |

|
#36
W Laureston Way
Herriman, UT 84096
|
- sq. feet
|
- baths - beds |
show details | |

|
#37
W Primavue Ln
Herriman, UT 84096
|
- sq. feet
|
- baths - beds |
show details | |

|
#38
W Mirasol Ln
Herriman, UT 84096
|
- sq. feet
|
- baths - beds |
show details | |

|
#39
W Ecofax Cv
Herriman, UT 84096
|
- sq. feet
|
- baths - beds |
show details | |

|
#40
W Legacy Springs Dr Apt 1018
Herriman, UT 84096
|
- sq. feet
|
- baths - beds |
show details |
| Photo | Address | Area | Beds / Baths | Price | Details |
|---|---|---|---|---|---|

|
#41
S Garrison Ln
Herriman, UT 84096
|
- sq. feet
|
- baths - beds |
show details | |

|
#42
S Watchmen Way
Herriman, UT 84096
|
- sq. feet
|
- baths - beds |
show details | |

|
#43
S Rushmore Park Ln
Herriman, UT 84096
|
- sq. feet
|
- baths - beds |
show details | |

|
#44
W Laureston Way
Herriman, UT 84096
|
- sq. feet
|
- baths - beds |
show details | |

|
#45
W Roe Deer Ln
Herriman, UT 84096
|
- sq. feet
|
- baths - beds |
show details | |

|
#46
S Callander Ct
Herriman, UT 84096
|
- sq. feet
|
- baths - beds |
show details | |

|
#47
S Marsh Deer Rd Apt 3107
Herriman, UT 84096
|
- sq. feet
|
- baths - beds |
show details | |

|
#48
W Big Cypress Way
Herriman, UT 84096
|
- sq. feet
|
- baths - beds |
show details | |

|
#49
W Shade Crest Ln
Herriman, UT 84096
|
- sq. feet
|
- baths - beds |
show details | |

|
Check over 1 million property listings on Foreclosure.com!
|
browse all offers | |||

Latest news about housing in Herriman, UT collected exclusively by city-data.com from local newspapers, TV, and radio stations

 | Home builders (8 replies) |
| Good areas with new construction homes? (10 replies) |
| Would I like Salt Lake City? (nerd, nature, rent) (11 replies) |
| Techie Texans Looking To Move to Utah (33 replies) |
| Your thoughts on Herriman? (68 replies) |
| Olympia Hills Development (23 replies) |

Median year apartment built: 2017
Household type by relationship:
Households: 55,563- Male householders: 8,762 (860 living alone), Female householders: 7,388 (1,272 living alone)
10,969 spouses (10,775 opposite-sex spouses), 297 unmarried partners, (297 opposite-sex unmarried partners), 23,186 children (21,479 natural, 589 adopted, 1,117 stepchildren), 1,230 grandchildren, 111 brothers or sisters, 546 parents, 13 foster children, 1,387 other relatives, 1,659 non-relatives
- In group quarters: 9
Size of family households: 3,760 2-persons, 3,095 3-persons, 2,704 4-persons, 1,774 5-persons, 1,416 6-persons, 850 7-or-more-persons.
Size of nonfamily households: 2,156 1-person, 575 2-persons, 44 3-persons, 22 4-persons, 74 5-persons.
16,253 married couples with children.
1,550 single-parent households (367 men, 1,183 women).
90.9% of residents of Herriman speak English at home.
4.1% of residents speak Spanish at home (67% speak English very well, 21% speak English well, 12% speak English not well).
1.2% of residents speak other Indo-European language at home (86% speak English very well, 14% speak English well).
2.1% of residents speak Asian or Pacific Island language at home (64% speak English very well, 19% speak English well, 13% speak English not well, 4% don't speak English at all).
Foreign born population: 3,872 (7.0%)
(41.1% of them are naturalized citizens)
| Here: | 7.9 |
| State: | 7.6 |
| Here: | 4.5 |
| State: | 4.3 |

- Bedrooms in owner-occupied houses and condos in Herriman, Utah
- 42no bedroom
- 731 bedroom
- 3162 bedrooms
- 4,4583 bedrooms
- 3,9404 bedrooms
- 4,7845+ bedrooms

- Bedrooms in renter-occupied apartments in Herriman, Utah
- 52no bedroom
- 2051 bedroom
- 1,3692 bedrooms
- 1,2213 bedrooms
- 694 bedrooms
- 2025+ bedrooms

- Cars and other vehicles available in Herriman in owner-occupied houses/condos
- 194no vehicle
- 1,2901 vehicle
- 6,3942 vehicles
- 3,7513 vehicles
- 1,2844 vehicles
- 7015+ vehicles

- Cars and other vehicles available in Herriman in renter-occupied apartments
- 371no vehicle
- 1,5521 vehicle
- 9102 vehicles
- 1653 vehicles
- 1204 vehicles
- 05+ vehicles

- Rooms in owner-occupied houses in Herriman, Utah
- 421 room
- 02 rooms
- 1203 rooms
- 9644 rooms
- 1,5855 rooms
- 1,5566 rooms
- 1,6857 rooms
- 1,9148 rooms
- 5,7489+ rooms

- Rooms in renter-occupied apartments in Herriman, Utah
- 521 room
- 1262 rooms
- 5083 rooms
- 8664 rooms
- 6795 rooms
- 3846 rooms
- 467 rooms
- 3908 rooms
- 679+ rooms


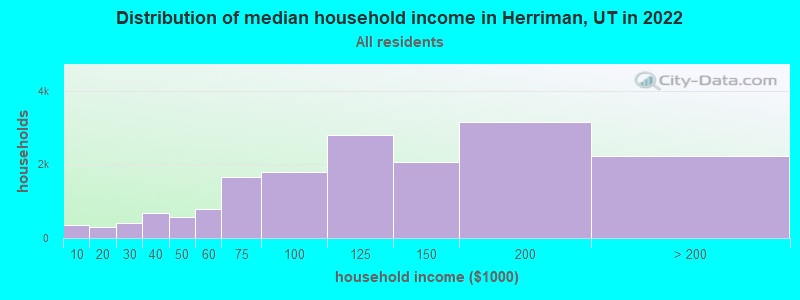
Herriman, UT household income distribution

- 352Less than $10,000
- 292$10,000 to $19,999
- 397$20,000 to $29,999
- 667$30,000 to $39,999
- 575$40,000 to $49,999
- 778$50,000 to $59,999
- 1,671$60,000 to $74,999
- 1,794$75,000 to $99,999
- 2,804$100,000 to $124,999
- 2,080$125,000 to $149,999
- 3,155$150,000 to $199,999
- 2,224$200,000 or more
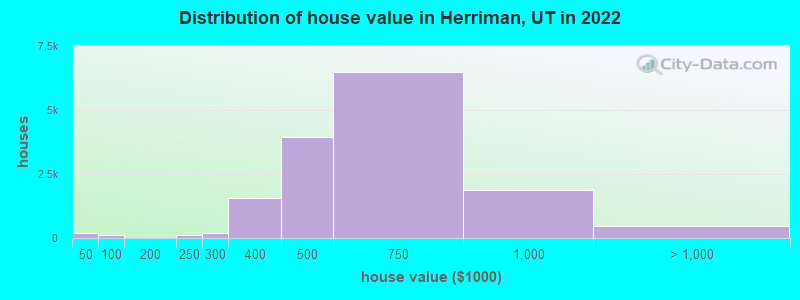
Home value of owner - occupied houses in 2022 in Herriman, UT
-
- 158Less than $10,000
- 8$10,000 to $14,999
- 30$30,000 to $34,999
- 6$40,000 to $49,999
- 66$50,000 to $59,999
- 5$70,000 to $79,999
- 20$80,000 to $89,999
- 112$200,000 to $249,999
- 202$250,000 to $299,999
- 1,575$300,000 to $399,999
- 3,964$400,000 to $499,999
- 6,473$500,000 to $749,999
- 1,880$750,000 to $999,999
- 290$1,000,000 to $1,499,999
- 77$1,500,000 to $1,999,999
- 96$2,000,000 or more
Rent paid by renters in 2022 in Herriman, UT
-
- 4$250 to $299
- 700$1,000 to $1,249
- 229$1,250 to $1,499
- 1,480$1,500 to $1,999
- 554$2,000 to $2,499
- 112$2,500 to $2,999
- 13$3,000 to $3,499
- 220No cash rent

Percentage of workers working in this county: 90.6%
Number of people working at home: 7,224 (25.6% of all workers)
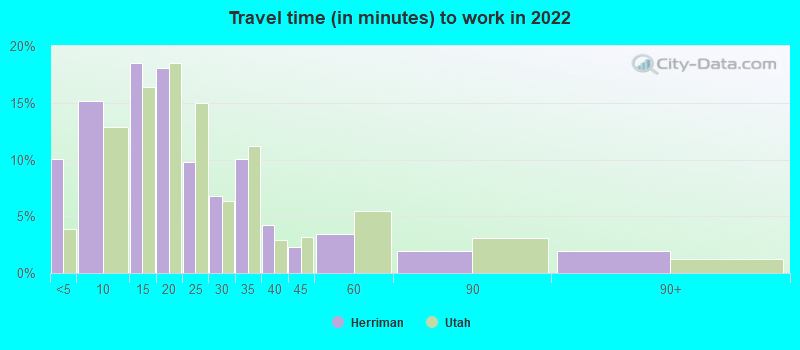
Travel time to work (commute)
- Less than 5 minutes: 653
- 5 to 9 minutes: 908
- 10 to 14 minutes: 1,862
- 15 to 19 minutes: 3,477
- 20 to 24 minutes: 3,316
- 25 to 29 minutes: 1,245
- 30 to 34 minutes: 3,415
- 35 to 39 minutes: 1,271
- 40 to 44 minutes: 2,080
- 45 to 59 minutes: 2,055
- 60 to 89 minutes: 1,071
- 90 or more minutes: 233
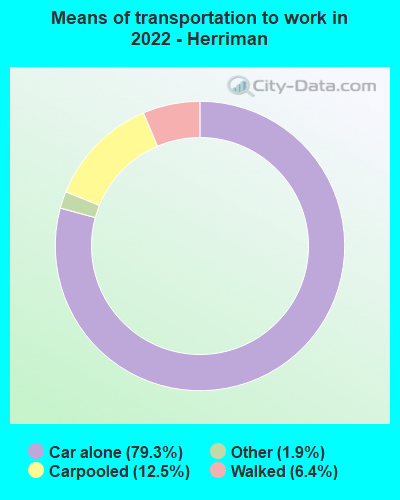
Means of transportation to work:
- Drove a car alone: 4,004 (36.4%)
- Carpooled: 678 (6.2%)
- Taxi: 98 (0.9%)
- Walked: 331 (3.0%)
- Worked at home: 7,224 (65.8%)
- Unemployment by race in 2022
- Unemployment rate for White non-Hispanic residents
- 2.9%Males
- 3.3%Females
- Unemployment rate for Black residents
- 40.4%Males
- Unemployment rate for Asian residents
- 16.4%Females
- Unemployment rate for Hispanic or Latino residents
- 1.0%Males

- Year of entry for the foreign-born population in Herriman, Utah
- 2,1432010 or later
- 7292000 to 2009
- 6101990 to 1999
- 01980 to 1989
- 01970 to 1979
- 28Before 1970

First ancestries reported:
- English: 9,690 (37.8%)
- European: 2,140 (8.4%)
- American: 1,685 (6.6%)
- German: 1,546 (6.0%)
- Irish: 1,492 (5.8%)
- Swedish: 468 (1.8%)
- British: 442 (1.7%)
- Danish: 400 (1.6%)
- Italian: 371 (1.4%)
- Scotch-Irish: 313 (1.2%)
- Belgian: 269 (1.1%)
- Norwegian: 263 (1.0%)
- Scandinavian: 261 (1.0%)
- Scottish: 242 (0.9%)
- Welsh: 192 (0.7%)
- French Canadian: 108 (0.4%)
- Polish: 101 (0.4%)
- Portuguese: 100 (0.4%)
- Dutch: 60 (0.2%)
- Jamaican: 57 (0.2%)
- Northern European: 52 (0.2%)
- French: 51 (0.2%)
- Austrian: 39 (0.2%)
- Guyanese: 27 (0.1%)
- African: 27 (0.1%)
- Hungarian: 25 (0.10%)
- Greek: 20 (0.08%)
- Swiss: 19 (0.07%)
- Yugoslavian: 12 (0.05%)
- Croatian: 10 (0.04%)
Most common places of birth for foreign-born residents (%):
| Herriman: | 18.4% (718) |
| Utah: | 3.2% (8,804) |
| Herriman: | 13.8% (540) |
| Utah: | 36.1% (99,740) |
| Herriman: | 12.0% (468) |
| Utah: | 2.7% (7,472) |
| Herriman: | 8.2% (322) |
| Utah: | 2.3% (6,468) |
| Herriman: | 7.0% (275) |
| Utah: | 2.9% (8,017) |
| Herriman: | 5.6% (219) |
| Utah: | 3.0% (8,341) |
| Herriman: | 5.1% (199) |
| Utah: | 2.6% (7,211) |
| Herriman: | 4.6% (179) |
| Utah: | 2.9% (7,901) |
| Herriman: | 4.4% (174) |
| Utah: | 1.6% (4,524) |
| Herriman: | 3.0% (119) |
| Utah: | 1.1% (2,900) |
| Herriman: | 3.0% (117) |
| Utah: | 2.0% (5,555) |
| Herriman: | 2.7% (107) |
| Utah: | 0.6% (1,529) |
| Herriman: | 1.6% (63) |
| Utah: | 2.6% (7,062) |
| Herriman: | 1.5% (60) |
| Utah: | 0.2% (527) |
Place of birth for U.S.-born residents:
- This state: 36,271
- Other state: 14,940
- Northeast: 1,899
- Midwest: 1,772
- South: 3,120
- West: 8,050
88.7% of Herriman residents lived in the same house 1 years ago.
Out of people who lived in different houses, 37.3% lived in this county.
Out of people who lived in different counties, 44.6% lived in Utah.
| Herriman: | 88.7% |
| State average: | 85.7% |
Education attainment for males 25 years and older:
- No schooling: 133
- Nursery to 4th grade: 104
- 5th and 6th grade: 0
- 7th and 8th grade: 4
- 9th grade: 5
- 10th grade: 10
- 11th grade: 0
- 12th grade, no diploma: 105
- High school graduate (or equivalency): 2,513
- Less than 1 year of college: 1,212
- Some college more than 1 year, no degree: 1,860
- Associate degree: 1,685
- Bachelor's degree: 4,332
- Master's degree: 1,877
- Professional school degree: 112
- Doctorate degree: 329

Education attainment for females 25 years and older:
- No schooling: 294
- Nursery to 4th grade: 93
- 5th and 6th grade: 0
- 7th and 8th grade: 0
- 9th grade: 0
- 10th grade: 103
- 11th grade: 59
- 12th grade, no diploma: 408
- High school graduate (or equivalency): 2,892
- Less than 1 year of college: 1,504
- Some college more than 1 year, no degree: 2,827
- Associate degree: 2,291
- Bachelor's degree: 5,003
- Master's degree: 848
- Professional school degree: 310
- Doctorate degree: 30


Housing units in structures:
- One, detached: 11,224
- One, attached: 3,357
- Two: 112
- 3 or 4: 51
- 5 to 9: 432
- 10 to 19: 860
- 20 to 49: 659
- 50 or more: 306
- Mobile homes: 128
Housing units lacking complete kitchen facilities in 2022: 0.8%

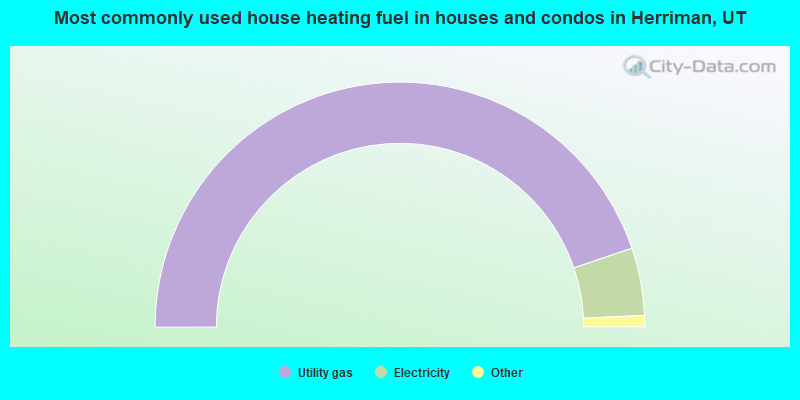
- 89.6%Utility gas
- 8.9%Electricity
- 0.9%Bottled, tank, or LP gas
- 0.6%Solar energy
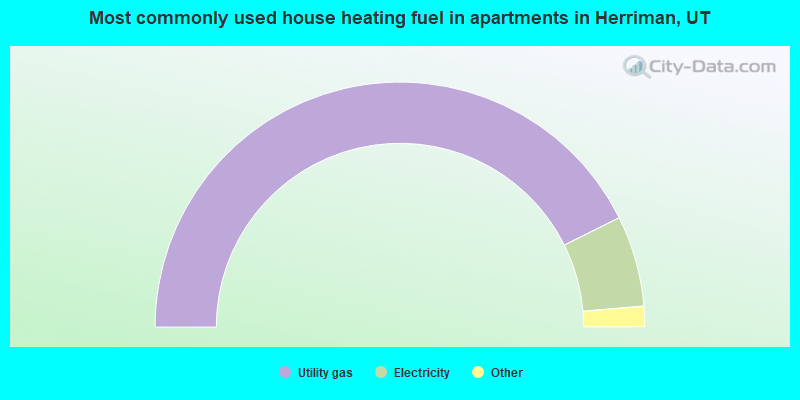
- 85.3%Utility gas
- 12.0%Electricity
- 1.8%Bottled, tank, or LP gas
- 1.0%Solar energy
Private vs. public school enrollment:
| Here: | 4.8% |
| Utah: | 7.2% |
| Here: | 0.8% |
| Utah: | 5.3% |
| Here: | 18.4% |
| Utah: | 26.7% |


