Jump to a detailed profile or search site with Google Custom Search

Hesperia, CA (California) Houses and Residents

Estimated median house or condo value in 2022: $417,300 (it was $94,300 in 2000)
Hesperia:

$417,300
California:

$715,900
Lower value quartile - upper value quartile: $329,500 - $496,400

Mean price in 2022:

Detached houses: $352,482
Here:

$352,482
State:

$988,808

Townhouses or other attached units: $438,408
Here:

$438,408
State:

$838,546

Mobile homes: $131,343
Here:

$131,343
State:

$184,506

Total population: 92,749 (Urban population: 61,608, Rural population: 970 (all nonfarm))

Houses: 29,270 (27,790 occupied: 19,399 owner occupied, 8,391 renter occupied)

% of renters here:

30%
State:

44%

Housing density: 435 houses/condos per square mile

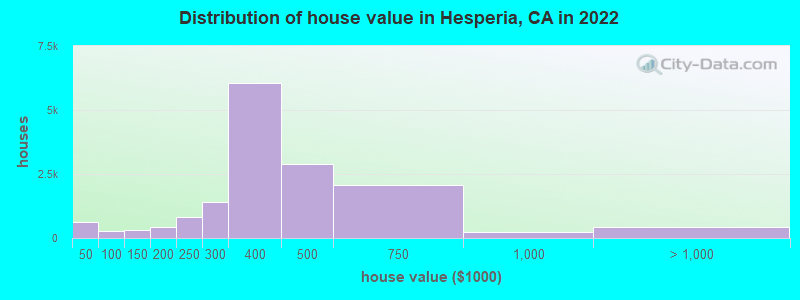
Median price asked for vacant for-sale houses and condos in 2022: $279,091.

Median contract rent in 2022: $1,183 (lower quartile is $966, upper quartile is $1,462)


Median rent asked for vacant for-rent units in 2022: $1,105


Median gross rent in Hesperia, CA in 2022: $1,412

Housing units in Hesperia with a mortgage: 13,585 (492 second mortgage, 3 home equity loan, 236 both second mortgage and home equity loan)
Houses without a mortgage: 0

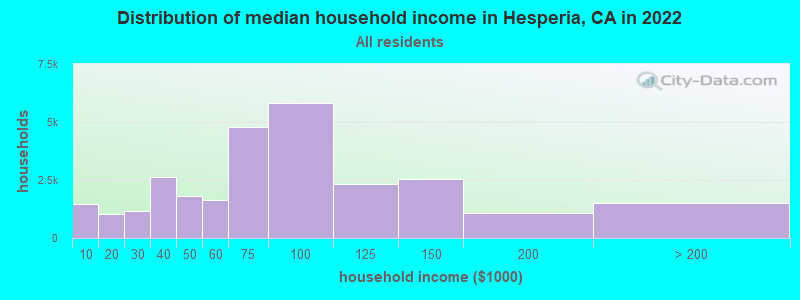
Median household income for houses/condos with a mortgage: $84,766

Median household income for apartments without a mortgage: $62,192

Median monthly housing costs: $1,565

Compare current foreclosures in Hesperia, CA:

Check out more offers in Hesperia, CA.
Powered by Foreclosure.com

Settings
X
Data:
Loading data...
Based on 2000-2022 data
Loading data...

123
Hide US histogram

Latest news about housing in Hesperia, CA collected exclusively by city-data.com from local newspapers, TV, and radio stations

Hesperia, California Age and Sex of Residents
Median year house/condo built: 1989

Median year apartment built: 1988

Household type by relationship:

Households: 100,766
  • Male householders: 13,383 (1,381 living alone), Female householders: 14,407 (1,460 living alone)
  • 16,749 spouses (16,684 opposite-sex spouses), 2,914 unmarried partners, (2,867 opposite-sex unmarried partners), 40,041 children (34,713 natural, 2,094 adopted, 3,234 stepchildren), 4,519 grandchildren, 1,762 brothers or sisters, 3,014 parents, 184 foster children, 1,983 other relatives, 1,626 non-relatives
  • In group quarters: 184

Size of family households: 5,556 2-persons, 4,811 3-persons, 5,355 4-persons, 3,478 5-persons, 2,298 6-persons, 1,871 7-or-more-persons.

Size of nonfamily households: 2,841 1-person, 1,580 2-persons.

20,091 married couples with children.
7,223 single-parent households (2,806 men, 4,417 women).

61.2% of residents of Hesperia speak English at home.
36.0% of residents speak Spanish at home (67% speak English very well, 15% speak English well, 14% speak English not well, 4% don't speak English at all).
0.4% of residents speak other Indo-European language at home (64% speak English very well, 33% speak English well, 3% speak English not well).
1.1% of residents speak Asian or Pacific Island language at home (52% speak English very well, 34% speak English well, 14% speak English not well).
0.3% of residents speak other language at home (73% speak English very well, 17% speak English well, 10% speak English not well).

Foreign born population: 16,613 (16.5%)
(55.5% of them are naturalized citizens)

Median number of rooms in houses and condos:
Here:

6.3
State:

6.0

Median number of rooms in apartments
Here:

4.8
State:

3.9

Owner-occupied Renter-occupied
Bedrooms in owner-occupied houses and condos in Hesperia, California
  • Bedrooms in owner-occupied houses and condos in Hesperia, California
  • 0no bedroom
  • 2331 bedroom
  • 1,6312 bedrooms
  • 9,6533 bedrooms
  • 6,3714 bedrooms
  • 1,5115+ bedrooms
Bedrooms in renter-occupied apartments in Hesperia, California
  • Bedrooms in renter-occupied apartments in Hesperia, California
  • 240no bedroom
  • 3911 bedroom
  • 3,8892 bedrooms
  • 2,5743 bedrooms
  • 1,1214 bedrooms
  • 1765+ bedrooms
Owner-occupied Renter-occupied
Cars and other vehicles available in Hesperia in owner-occupied houses/condos
  • Cars and other vehicles available in Hesperia in owner-occupied houses/condos
  • 449no vehicle
  • 2,7081 vehicle
  • 5,3372 vehicles
  • 6,2533 vehicles
  • 2,9324 vehicles
  • 1,7205+ vehicles
Cars and other vehicles available in Hesperia in renter-occupied apartments
  • Cars and other vehicles available in Hesperia in renter-occupied apartments
  • 307no vehicle
  • 2,8301 vehicle
  • 3,3412 vehicles
  • 1,2493 vehicles
  • 5824 vehicles
  • 825+ vehicles
Owner-occupied Renter-occupied
Rooms in owner-occupied houses in Hesperia, California
  • Rooms in owner-occupied houses in Hesperia, California
  • 01 room
  • 302 rooms
  • 973 rooms
  • 1,6394 rooms
  • 3,8715 rooms
  • 5,3226 rooms
  • 3,7157 rooms
  • 3,1158 rooms
  • 1,6109+ rooms
Rooms in renter-occupied apartments in Hesperia, California
  • Rooms in renter-occupied apartments in Hesperia, California
  • 1771 room
  • 852 rooms
  • 1,0993 rooms
  • 2,3234 rooms
  • 1,4925 rooms
  • 1,1786 rooms
  • 1,1687 rooms
  • 6318 rooms
  • 2389+ rooms
Year house built
Median 2022 house/condo value by year built
Median house/condo value by year householder moved into unit
Breakdown of mean house values by ages of householders
Owners and renters by unit type in Hesperia, CA
  • Hesperia, CA household income distribution

  • Distribution of median household income in Hesperia, CA in 2022
  • 1,477Less than $10,000
  • 1,030$10,000 to $19,999
  • 1,148$20,000 to $29,999
  • 2,618$30,000 to $39,999
  • 1,807$40,000 to $49,999
  • 1,642$50,000 to $59,999
  • 4,787$60,000 to $74,999
  • 5,812$75,000 to $99,999
  • 2,343$100,000 to $124,999
  • 2,529$125,000 to $149,999
  • 1,092$150,000 to $199,999
  • 1,505$200,000 or more
  • Home value of owner - occupied houses in 2022 in Hesperia, CA

  • Distribution of house value in Hesperia, CA in 2022
  • 245Less than $10,000
  • 47$10,000 to $14,999
  • 46$15,000 to $19,999
  • 50$20,000 to $24,999
  • 81$25,000 to $29,999
  • 55$30,000 to $34,999
  • 14$35,000 to $39,999
  • 87$40,000 to $49,999
  • 48$50,000 to $59,999
  • 30$60,000 to $69,999
  • 8$70,000 to $79,999
  • 51$80,000 to $89,999
  • 33$90,000 to $99,999
  • 193$100,000 to $124,999
  • 111$125,000 to $149,999
  • 242$150,000 to $174,999
  • 171$175,000 to $199,999
  • 830$200,000 to $249,999
  • 1,423$250,000 to $299,999
  • 6,059$300,000 to $399,999
  • 2,871$400,000 to $499,999
  • 2,053$500,000 to $749,999
  • 241$750,000 to $999,999
  • 188$1,000,000 to $1,499,999
  • 96$1,500,000 to $1,999,999
  • 124$2,000,000 or more
  • Rent paid by renters in 2022 in Hesperia, CA

  • Distribution of rent paid by renters in Hesperia, CA in 2022
  • 15$100 to $149
  • 211$200 to $249
  • 24$300 to $349
  • 49$350 to $399
  • 21$400 to $449
  • 93$450 to $499
  • 148$500 to $549
  • 83$550 to $599
  • 109$600 to $649
  • 129$650 to $699
  • 107$700 to $749
  • 284$750 to $799
  • 514$800 to $899
  • 907$900 to $999
  • 2,143$1,000 to $1,249
  • 1,614$1,250 to $1,499
  • 2,144$1,500 to $1,999
  • 776$2,000 to $2,499
  • 8$2,500 to $2,999
  • 573No cash rent
Time Leaving Home To Go To Work in 2022

Percentage of workers working in this county: 85.1%
Number of people working at home: 3,888 (10.1% of all workers)

Travel time (in minutes) to work in 2022

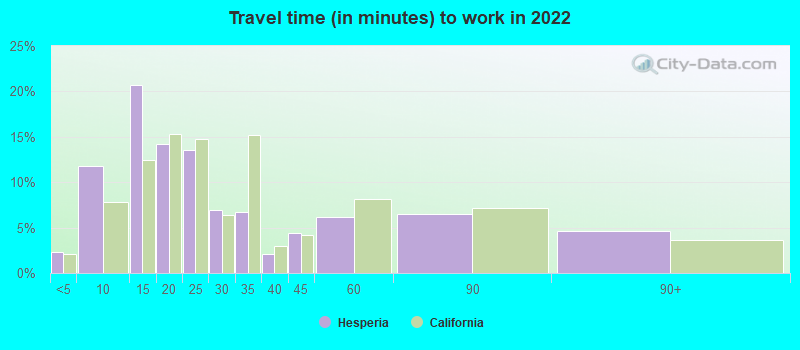
Travel time to work (commute)

  • Less than 5 minutes: 308
  • 5 to 9 minutes: 2,488
  • 10 to 14 minutes: 3,941
  • 15 to 19 minutes: 2,917
  • 20 to 24 minutes: 2,825
  • 25 to 29 minutes: 1,382
  • 30 to 34 minutes: 3,939
  • 35 to 39 minutes: 832
  • 40 to 44 minutes: 372
  • 45 to 59 minutes: 4,945
  • 60 to 89 minutes: 4,331
  • 90 or more minutes: 4,837
Means of transportation to work in 2022 - Hesperia

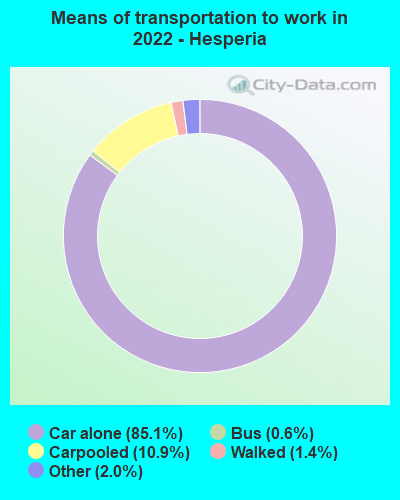
Means of transportation to work:

  • Drove a car alone: 16,013 (70.6%)
  • Carpooled: 2,203 (9.7%)
  • Bus: 117 (0.5%)
  • Taxi: 431 (1.9%)
  • Walked: 278 (1.2%)
  • Worked at home: 3,888 (17.1%)
Class of Workers in 2022
  • Unemployment by race in 2022
  • Unemployment rate for White non-Hispanic residents
  • 2.0%Males
  • 12.5%Females
  • Unemployment rate for Black residents
  • 2.2%Males
  • 21.5%Females
  • Unemployment rate for American Indian and Alaska Native residents
  • 9.3%Males
  • 2.6%Females
  • Unemployment rate for other race residents
  • 6.5%Males
  • 10.8%Females
  • Unemployment rate for two or more race residents
  • 6.4%Males
  • 16.4%Females
  • Unemployment rate for Hispanic or Latino residents
  • 6.5%Males
  • 12.9%Females
Year of entry for the foreign-born population in Hesperia, California
  • Year of entry for the foreign-born population in Hesperia, California
  • 2,1712010 or later
  • 3,4342000 to 2009
  • 4,3451990 to 1999
  • 2,0651980 to 1989
  • 1,3181970 to 1979
  • 1,465Before 1970
Ancestries in Hesperia, CA

First ancestries reported:

  • Irish: 2,013 (3.3%)
  • German: 2,010 (3.3%)
  • American: 1,204 (1.9%)
  • Italian: 1,113 (1.8%)
  • English: 1,091 (1.8%)
  • European: 780 (1.3%)
  • Polish: 312 (0.5%)
  • French: 291 (0.5%)
  • Dutch: 211 (0.3%)
  • African: 208 (0.3%)
  • Scottish: 188 (0.3%)
  • Norwegian: 171 (0.3%)
  • Nigerian: 152 (0.2%)
  • Swedish: 134 (0.2%)
  • Scotch-Irish: 118 (0.2%)
  • Romanian: 111 (0.2%)
  • Arab: 107 (0.2%)
  • Canadian: 75 (0.1%)
  • Northern European: 66 (0.1%)
  • Ukrainian: 57 (0.09%)
  • Russian: 55 (0.09%)
  • Jamaican: 48 (0.08%)
  • French Canadian: 46 (0.07%)
  • Iranian: 46 (0.07%)
  • Haitian: 44 (0.07%)
  • British: 43 (0.07%)
  • Lithuanian: 39 (0.06%)
  • Jordanian: 36 (0.06%)
  • Hungarian: 34 (0.06%)
  • Danish: 33 (0.05%)
  • Scandinavian: 27 (0.04%)
  • Eastern European: 22 (0.04%)
  • Swiss: 22 (0.04%)
  • Palestinian: 21 (0.03%)
  • Basque: 11 (0.02%)
  • Ethiopian: 11 (0.02%)
  • Portuguese: 9 (0.01%)
  • Croatian: 9 (0.01%)
  • New Zealander: 6 (0.01%)
  • Pennsylvania German: 6 (0.01%)
  • Czechoslovakian: 6 (0.01%)
  • Australian: 4 (0.01%)
  • Armenian: 4 (0.01%)
  • Welsh: 4 (0.01%)

Most common places of birth for foreign-born residents (%):

Mexico
Hesperia:

70.5% (12,380)
California:

37.2% (3,881,193)

El Salvador
Hesperia:

5.5% (960)
California:

4.2% (440,287)

Guatemala
Hesperia:

4.6% (809)
California:

2.8% (290,436)

Philippines
Hesperia:

2.6% (455)
California:

7.8% (818,297)

Nicaragua
Hesperia:

2.6% (448)
California:

0.6% (58,161)

Place of birth for U.S.-born residents:

  • This state: 74,178
  • Other state: 9,226
  • Northeast: 2,183
  • Midwest: 2,183
  • South: 2,032
  • West: 2,828

94.4% of Hesperia residents lived in the same house 1 years ago.
   Out of people who lived in different houses, 39.6% lived in this county.
   Out of people who lived in different counties, 79.9% lived in California.


Hesperia:

94.4%
State average:

88.9%

Education attainment for males 25 years and older:

  • No schooling: 1,473
  • Nursery to 4th grade: 363
  • 5th and 6th grade: 780
  • 7th and 8th grade: 575
  • 9th grade: 1,195
  • 10th grade: 191
  • 11th grade: 259
  • 12th grade, no diploma: 2,301
  • High school graduate (or equivalency): 10,648
  • Less than 1 year of college: 3,280
  • Some college more than 1 year, no degree: 4,341
  • Associate degree: 1,472
  • Bachelor's degree: 2,112
  • Master's degree: 551
  • Professional school degree: 40
  • Doctorate degree: 0
Educational Attainment for Males

Education attainment for females 25 years and older:

  • No schooling: 2,455
  • Nursery to 4th grade: 244
  • 5th and 6th grade: 874
  • 7th and 8th grade: 545
  • 9th grade: 987
  • 10th grade: 653
  • 11th grade: 720
  • 12th grade, no diploma: 1,132
  • High school graduate (or equivalency): 9,092
  • Less than 1 year of college: 2,750
  • Some college more than 1 year, no degree: 4,719
  • Associate degree: 2,659
  • Bachelor's degree: 1,147
  • Master's degree: 1,453
  • Professional school degree: 177
  • Doctorate degree: 140
Educational Attainment for Females
Hesperia marital status for males
Hesperia marital status for females

Housing units in structures:

  • One, detached: 24,254
  • One, attached: 496
  • Two: 1,138
  • 3 or 4: 847
  • 5 to 9: 629
  • 10 to 19: 331
  • 20 to 49: 193
  • 50 or more: 524
  • Mobile homes: 858

Median worth of mobile homes: $90,741

Housing units lacking complete plumbing facilities in 2022: 1.0%

Housing units lacking complete kitchen facilities in 2022: 1.9%

House/condo owner moved in on average 9 years ago

Renter moved in on average 4 years ago

Year householders moved into residence in Hesperia
Houses and condos Apartments
Most commonly used house heating fuel in houses and condos in Hesperia, CA
  • 86.1%Utility gas
  • 8.9%Electricity
  • 2.3%Wood
  • 1.3%Bottled, tank, or LP gas
  • 0.7%No fuel used
  • 0.5%Fuel oil, kerosene, etc.
  • 0.1%Solar energy
Most commonly used house heating fuel in apartments in Hesperia, CA
  • 87.6%Utility gas
  • 10.3%Electricity
  • 1.0%Bottled, tank, or LP gas
  • 0.8%No fuel used
  • 0.4%Wood

Private vs. public school enrollment:

Students in private schools in grades 1 to 8 (elementary and middle school): 554
Here:

3.3%
California:

10.5%

Students in private schools in grades 9 to 12 (high school): 0
Here:

0.0%
California:

8.5%

Students in private undergraduate colleges: 555
Here:

10.2%
California:

15.9%
School Enrollment by Level of School for Male Students
School Enrollment by Level of School for Female Students
Age and Sex of Sensory-Disabled Noninstitutionalized Residents
Age and Sex of Physically-Disabled Noninstitutionalized Residents
Age and Sex of Mentally-Disabled Noninstitutionalized Residents
Age and Sex of Self-Care Disabled Noninstitutionalized Residents
Age and Sex of Go-Outside-Home Disabled Noninstitutionalized Residents
Age and Sex of Noninstitutionalized Residents with Employment Disability