Heyworth, IL (Illinois) Houses and Residents
| Heyworth: | $197,885 |
| Illinois: | $251,600 |
Mean price in 2022:
Detached houses: $215,613
Here: $215,613 State: $310,164 Mobile homes: $25,496
Here: $25,496 State: $78,855
Total population: 2,906 (Urban population: 0, Rural population: 2,427 (all nonfarm))
Houses: 1,028 (984 occupied: 850 owner occupied, 132 renter occupied)
| % of renters here: | 13% |
| State: | 33% |
Housing density: 665 houses/condos per square mile
Median price asked for vacant for-sale houses and condos in 2022: $2,308,801.
Median contract rent in 2022: $578 (lower quartile is $473, upper quartile is $874)
Median rent asked for vacant for-rent units in 2022: $604
Median gross rent in Heyworth, IL in 2022: $775
Housing units in Heyworth with a mortgage: 548 (40 second mortgage, 0 home equity loan, 40 both second mortgage and home equity loan)
Houses without a mortgage: 11
Median household income for houses/condos with a mortgage: $102,170
Median household income for apartments without a mortgage: $51,509
Median monthly housing costs: $1,148
Compare current foreclosures near Heyworth, IL:
| Photo | Address | Area | Beds / Baths | Price | Details |
|---|---|---|---|---|---|

|
#1
S Delane Dr
Heyworth, IL 61745
|
1,160 sq. feet
|
1 baths - beds |
show details | |

|
#2
S Walnut St, Apt 6
Heyworth, IL 61745
|
- sq. feet
|
- baths - beds |
show details | |

|
#3
Autumn Rd
Wapella, IL 61777
|
1,973 sq. feet
|
3 baths 4 beds |
show details | |

|
#4
E Main St
Stanford, IL 61774
|
- sq. feet
|
2 baths 3 beds |
show details | |

|
#5
S East St
Bloomington, IL 61701
|
1,868 sq. feet
|
2 baths 3 beds |
show details | |

|
#6
Knollbrook Way
Bloomington, IL 61705
|
2,497 sq. feet
|
2 baths 4 beds |
show details | |

|
#7
S Prairie St
Bloomington, IL 61701
|
1,544 sq. feet
|
1 baths 3 beds |
show details | |

|
#8
Rowe Dr
Bloomington, IL 61701
|
1,188 sq. feet
|
3 baths 3 beds |
show details | |

|
#9
W Monroe St
Bloomington, IL 61701
|
758 sq. feet
|
1 baths 2 beds |
show details | |

|
#10
S Walnut St
Wapella, IL 61777
|
1,455 sq. feet
|
1 baths 3 beds |
show details |
| Photo | Address | Area | Beds / Baths | Price | Details |
|---|---|---|---|---|---|

|
#11
S Catherine St
Atlanta, IL 61723
|
- sq. feet
|
2 baths 3 beds |
show details | |

|
#12
N Grove St
Normal, IL 61761
|
1,514 sq. feet
|
- baths 3 beds |
show details | |

|
#13
Inez Ln
Normal, IL 61761
|
1,826 sq. feet
|
- baths 3 beds |
show details | |

|
#14
Fieldcrest Ct
Normal, IL 61761
|
1,326 sq. feet
|
- baths 2 beds |
show details | |

|
#15
E Sycamore St
Normal, IL 61761
|
2,884 sq. feet
|
- baths 4 beds |
show details | |

|
#16
Currie Ct
Bloomington, IL 61704
|
3,177 sq. feet
|
3 baths - beds |
show details | |

|
#17
Tompkins Dr
Normal, IL 61761
|
1,304 sq. feet
|
- baths 3 beds |
show details | |

|
#18
Rebecca Ln
Normal, IL 61761
|
1,074 sq. feet
|
- baths 3 beds |
show details | |

|
#19
Meadow Lane St
Le Roy, IL 61752
|
948 sq. feet
|
1 baths - beds |
show details | |

|
#20
W Elm St
Le Roy, IL 61752
|
864 sq. feet
|
2 baths - beds |
show details |
| Photo | Address | Area | Beds / Baths | Price | Details |
|---|---|---|---|---|---|

|
#21
S Hemlock St
Le Roy, IL 61752
|
528 sq. feet
|
1 baths - beds |
show details | |

|
#22
Highpoint Rd
Normal, IL 61761
|
1,114 sq. feet
|
- baths 3 beds |
show details | |

|
#23
Highpoint Rd
Normal, IL 61761
|
1,141 sq. feet
|
- baths 3 beds |
show details | |

|
#24
Hovey Ave
Normal, IL 61761
|
1,013 sq. feet
|
- baths 3 beds |
show details | |

|
#25
S Fell Ave
Normal, IL 61761
|
1,930 sq. feet
|
- baths 3 beds |
show details | |

|
#26
Walton Pl
Normal, IL 61761
|
2,170 sq. feet
|
- baths 3 beds |
show details | |

|
#27
Allen St
Le Roy, IL 61752
|
1,104 sq. feet
|
1 baths - beds |
show details | |

|
#28
Abercorn St
Normal, IL 61761
|
2,069 sq. feet
|
- baths 4 beds |
show details | |

|
#29
Surrey Cir
Bloomington, IL 61705
|
2,029 sq. feet
|
1 baths - beds |
show details | |

|
#30
Bull St
Normal, IL 61761
|
1,086 sq. feet
|
- baths 3 beds |
show details |
| Photo | Address | Area | Beds / Baths | Price | Details |
|---|---|---|---|---|---|

|
#31
Belview Ave
Normal, IL 61761
|
1,020 sq. feet
|
- baths 4 beds |
show details | |

|
#32
Partridge Pt
Normal, IL 61761
|
1,856 sq. feet
|
- baths 3 beds |
show details | |

|
#33
Parktrail Rd
Normal, IL 61761
|
1,344 sq. feet
|
- baths 3 beds |
show details | |

|
#34
S Division St
Stanford, IL 61774
|
1,385 sq. feet
|
1 baths - beds |
show details | |

|
#35
N Linden St
Normal, IL 61761
|
1,524 sq. feet
|
- baths 3 beds |
show details | |

|
#36
Labrador Ln
Normal, IL 61761
|
2,243 sq. feet
|
- baths 5 beds |
show details | |

|
#37
East St
Mc Lean, IL 61754
|
868 sq. feet
|
1 baths - beds |
show details | |

|
#38
N Towanda Ave
Normal, IL 61761
|
2,052 sq. feet
|
- baths 3 beds |
show details | |

|
#39
Ironwood Cc Dr
Normal, IL 61761
|
2,971 sq. feet
|
- baths 4 beds |
show details | |

|
#40
N Western Ave
Bloomington, IL 61701
|
- sq. feet
|
- baths - beds |
show details |
| Photo | Address | Area | Beds / Baths | Price | Details |
|---|---|---|---|---|---|

|
#41
Yotzonot Dr Apt 303
Bloomington, IL 61704
|
- sq. feet
|
- baths - beds |
show details | |

|
#42
Bobwhite Way
Normal, IL 61761
|
- sq. feet
|
- baths - beds |
show details | |

|
#43
N Alexander St
Kenney, IL 61749
|
- sq. feet
|
- baths - beds |
show details | |

|
#44
Warbler Way # 8
Bloomington, IL 61704
|
- sq. feet
|
- baths - beds |
show details | |

|
#45
N Linden St Apt I205
Normal, IL 61761
|
- sq. feet
|
- baths - beds |
show details | |

|
#46
Bobolink Way Apt 2
Bloomington, IL 61704
|
- sq. feet
|
- baths - beds |
show details | |

|
#47
E Howard St
Kenney, IL 61749
|
- sq. feet
|
- baths - beds |
show details | |

|
#48
Rainbow Ave
Bloomington, IL 61704
|
- sq. feet
|
- baths - beds |
show details | |

|
#49
N Lambert Dr
Normal, IL 61761
|
- sq. feet
|
- baths - beds |
show details | |

|
Check over 1 million property listings on Foreclosure.com!
|
browse all offers | |||

Latest news about housing in Heyworth, IL collected exclusively by city-data.com from local newspapers, TV, and radio stations

 | Looking for small town in central illinois (7 replies) |
| Bloomington Illinois sitting in a bowl? (40 replies) |
| looking for information on Clinton area (7 replies) |

Median year apartment built: 1957
Household type by relationship:
Households: 2,722- Male householders: 399 (50 living alone), Female householders: 577 (161 living alone)
611 spouses (597 opposite-sex spouses), 42 unmarried partners, (42 opposite-sex unmarried partners), 960 children (908 natural, 9 adopted, 41 stepchildren), 48 grandchildren, 6 brothers or sisters, 4 parents, 3 foster children, 39 other relatives, 25 non-relatives
Size of family households: 312 2-persons, 160 3-persons, 100 4-persons, 73 5-persons, 40 6-persons, 3 7-or-more-persons.
Size of nonfamily households: 237 1-person, 34 2-persons.
645 married couples with children.
108 single-parent households (21 men, 87 women).
96.8% of residents of Heyworth speak English at home.
2.3% of residents speak Spanish at home (64% speak English very well, 36% speak English well).
0.2% of residents speak other Indo-European language at home (100% speak English well).
Foreign born population: 39 (1.4%)
(94.9% of them are naturalized citizens)
| Here: | 6.9 |
| State: | 6.4 |
| Here: | 4.9 |
| State: | 4.1 |

- Bedrooms in owner-occupied houses and condos in Heyworth, Illinois
- 0no bedroom
- 81 bedroom
- 1672 bedrooms
- 4003 bedrooms
- 2334 bedrooms
- 425+ bedrooms

- Bedrooms in renter-occupied apartments in Heyworth, Illinois
- 0no bedroom
- 201 bedroom
- 412 bedrooms
- 713 bedrooms
- 04 bedrooms
- 05+ bedrooms

- Cars and other vehicles available in Heyworth in owner-occupied houses/condos
- 19no vehicle
- 1351 vehicle
- 3482 vehicles
- 2603 vehicles
- 824 vehicles
- 65+ vehicles

- Cars and other vehicles available in Heyworth in renter-occupied apartments
- 24no vehicle
- 541 vehicle
- 222 vehicles
- 323 vehicles
- 04 vehicles
- 05+ vehicles

- Rooms in owner-occupied houses in Heyworth, Illinois
- 01 room
- 02 rooms
- 143 rooms
- 244 rooms
- 1295 rooms
- 1856 rooms
- 1197 rooms
- 2238 rooms
- 1579+ rooms

- Rooms in renter-occupied apartments in Heyworth, Illinois
- 01 room
- 112 rooms
- 203 rooms
- 144 rooms
- 355 rooms
- 336 rooms
- 07 rooms
- 88 rooms
- 119+ rooms


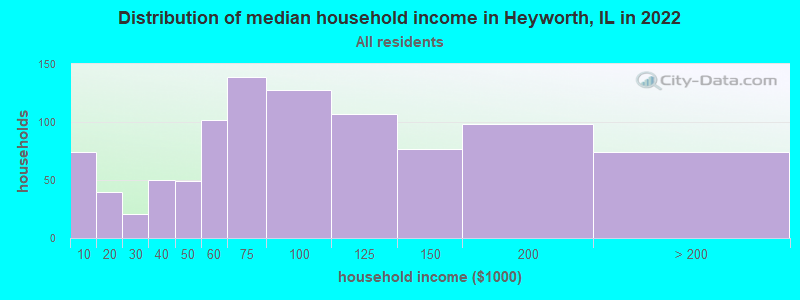
Heyworth, IL household income distribution

- 74Less than $10,000
- 40$10,000 to $19,999
- 21$20,000 to $29,999
- 50$30,000 to $39,999
- 49$40,000 to $49,999
- 102$50,000 to $59,999
- 139$60,000 to $74,999
- 128$75,000 to $99,999
- 107$100,000 to $124,999
- 77$125,000 to $149,999
- 98$150,000 to $199,999
- 74$200,000 or more
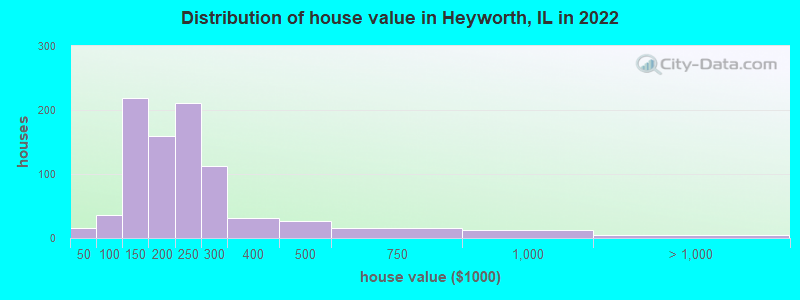
Home value of owner - occupied houses in 2022 in Heyworth, IL
-
- 3Less than $10,000
- 8$15,000 to $19,999
- 3$25,000 to $29,999
- 13$60,000 to $69,999
- 2$70,000 to $79,999
- 5$80,000 to $89,999
- 14$90,000 to $99,999
- 74$100,000 to $124,999
- 144$125,000 to $149,999
- 87$150,000 to $174,999
- 72$175,000 to $199,999
- 210$200,000 to $249,999
- 112$250,000 to $299,999
- 30$300,000 to $399,999
- 26$400,000 to $499,999
- 16$500,000 to $749,999
- 13$750,000 to $999,999
- 4$1,500,000 to $1,999,999
Rent paid by renters in 2022 in Heyworth, IL
-
- 24$350 to $399
- 16$450 to $499
- 13$500 to $549
- 6$550 to $599
- 7$650 to $699
- 20$800 to $899
- 10$900 to $999
- 17$1,000 to $1,249
- 6No cash rent


Percentage of workers working in this county: 84.5%
Number of people working at home: 210 (16.9% of all workers)

Travel time to work (commute)
- Less than 5 minutes: 67
- 5 to 9 minutes: 102
- 10 to 14 minutes: 37
- 15 to 19 minutes: 121
- 20 to 24 minutes: 367
- 25 to 29 minutes: 94
- 30 to 34 minutes: 123
- 35 to 39 minutes: 14
- 40 to 44 minutes: 14
- 45 to 59 minutes: 51
- 60 to 89 minutes: 0
- 90 or more minutes: 51
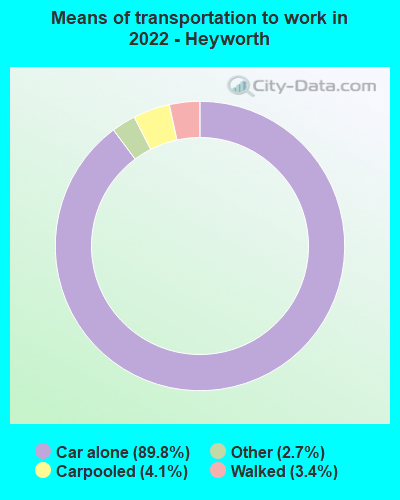
Means of transportation to work:
- Drove a car alone: 551 (69.7%)
- Carpooled: 21 (2.7%)
- Taxi: 9 (1.1%)
- Walked: 19 (2.4%)
- Worked at home: 210 (26.5%)

- Unemployment by race in 2022
- Unemployment rate for White non-Hispanic residents
- 3.7%Males
- 0.9%Females
- Unemployment rate for other race residents
- 100.0%Males
- Unemployment rate for Hispanic or Latino residents
- 52.7%Males

- Year of entry for the foreign-born population in Heyworth, Illinois
- 42010 or later
- 182000 to 2009
- 41990 to 1999
- 61980 to 1989
- 81970 to 1979
- 1Before 1970
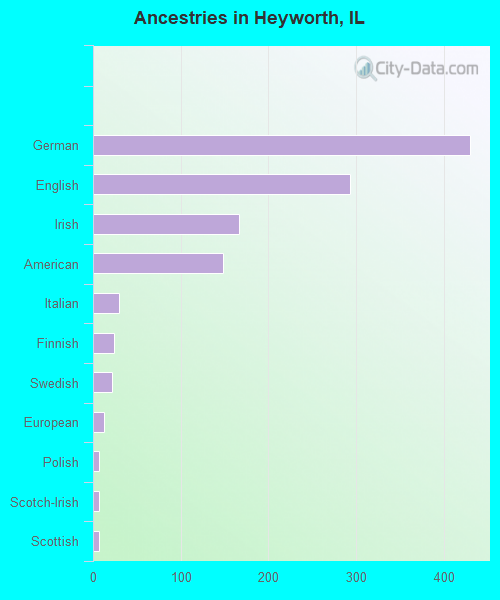
First ancestries reported:
- German: 430 (32.8%)
- English: 293 (22.4%)
- Irish: 167 (12.8%)
- American: 148 (11.3%)
- Italian: 30 (2.3%)
- Finnish: 24 (1.8%)
- Swedish: 22 (1.7%)
- European: 13 (1.0%)
- Polish: 7 (0.5%)
- Scotch-Irish: 7 (0.5%)
- Scottish: 7 (0.5%)
- Northern European: 3 (0.2%)
- Norwegian: 3 (0.2%)
- British: 2 (0.2%)
Most common places of birth for foreign-born residents (%):
| Heyworth: | 40.0% (18) |
| Illinois: | 34.7% (626,958) |
| Heyworth: | 37.8% (17) |
| Illinois: | 0.1% (1,403) |
| Heyworth: | 20.0% (9) |
| Illinois: | 4.1% (74,364) |
| Heyworth: | 8.9% (4) |
| Illinois: | 0.9% (15,679) |
Place of birth for U.S.-born residents:
- This state: 2,309
- Other state: 348
- Northeast: 7
- Midwest: 164
- South: 116
- West: 47
95.9% of Heyworth residents lived in the same house 1 years ago.
Out of people who lived in different houses, 46.7% lived in this county.
Out of people who lived in different counties, 100.0% lived in Illinois.
| Heyworth: | 95.9% |
| State average: | 88.3% |
Education attainment for males 25 years and older:
- No schooling: 0
- Nursery to 4th grade: 0
- 5th and 6th grade: 0
- 7th and 8th grade: 12
- 9th grade: 2
- 10th grade: 0
- 11th grade: 4
- 12th grade, no diploma: 9
- High school graduate (or equivalency): 281
- Less than 1 year of college: 84
- Some college more than 1 year, no degree: 89
- Associate degree: 44
- Bachelor's degree: 203
- Master's degree: 29
- Professional school degree: 14
- Doctorate degree: 4

Education attainment for females 25 years and older:
- No schooling: 0
- Nursery to 4th grade: 0
- 5th and 6th grade: 0
- 7th and 8th grade: 0
- 9th grade: 8
- 10th grade: 3
- 11th grade: 8
- 12th grade, no diploma: 5
- High school graduate (or equivalency): 274
- Less than 1 year of college: 80
- Some college more than 1 year, no degree: 137
- Associate degree: 55
- Bachelor's degree: 228
- Master's degree: 98
- Professional school degree: 44
- Doctorate degree: 0


Housing units in structures:
- One, detached: 887
- One, attached: 16
- Two: 13
- 3 or 4: 61
- 10 to 19: 9
- Mobile homes: 41
Median worth of mobile homes: $27,287
House/condo owner moved in on average 12 years ago
Renter moved in on average 3 years ago

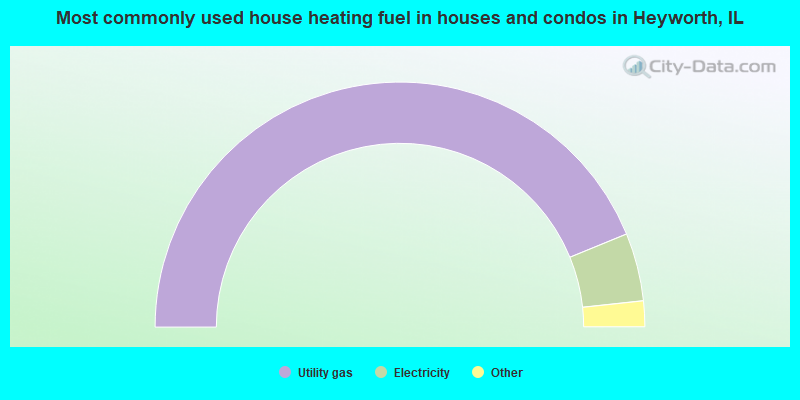
- 87.8%Utility gas
- 9.0%Electricity
- 1.8%Bottled, tank, or LP gas
- 1.4%No fuel used
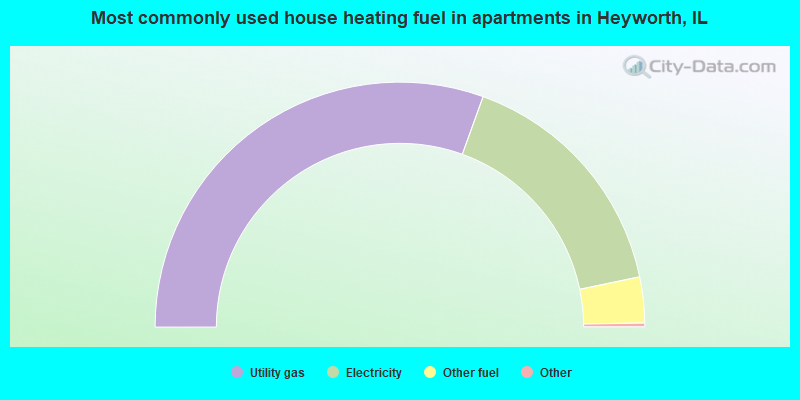
- 61.4%Utility gas
- 32.6%Electricity
- 6.1%Other fuel
Private vs. public school enrollment:
| Here: | 10.9% |
| Illinois: | 13.3% |
| Here: | 22.9% |
| Illinois: | 9.9% |
| Here: | 9.4% |
| Illinois: | 27.4% |


