Housing density: 411 houses/condos per square mile
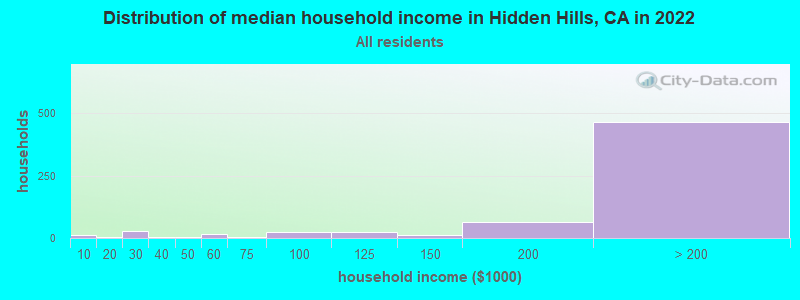
Median price asked for vacant for-sale houses and condos in 2022 in this county: $1,291,802.
Median contract rent in 2022: over $2,000 (lower quartile is over $2,000, upper quartile is over $2,000)
Median rent asked for vacant for-rent units in 2022: $6,565
Median gross rent in Hidden Hills, CA in 2022: over $2,000
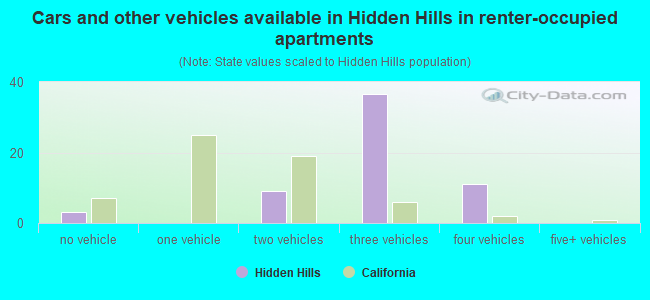
Housing units in Hidden Hills with a mortgage: 321 (37 second mortgage, 0 home equity loan, 30 both second mortgage and home equity loan) Houses without a mortgage: 23
Median household income for houses/condos with a mortgage: $248,703
Median household income for apartments without a mortgage: $243,178
Median monthly housing costs: $3,935
Compare current foreclosures near Hidden Hills, CA:
Size of family households: 259 2-persons, 113 3-persons, 90 4-persons, 66 5-persons, 44 6-persons, 8 7-or-more-persons.
Size of nonfamily households: 65 1-person, 3 2-persons.
397 married couples with children.
71 single-parent households (61 men, 10 women).
92.7% of residents of Hidden Hills speak English at home.
4.3% of residents speak Spanish at home (82% speak English very well, 13% speak English well, 6% don't speak English at all).
3.7% of residents speak other Indo-European language at home (89% speak English very well, 11% speak English well).
0.5% of residents speak Asian or Pacific Island language at home (70% speak English very well, 30% speak English well).
0.5% of residents speak other language at home (100% speak English very well).
Foreign born population: 299 (14.5%)
(63.9% of them are naturalized citizens)
Percentage of workers working in this county: 91.1% Number of people working at home: 353 (41.0% of all workers)
Travel time to work (commute)
Less than 5 minutes: 0
5 to 9 minutes: 57
10 to 14 minutes: 33
15 to 19 minutes: 141
20 to 24 minutes: 105
25 to 29 minutes: 10
30 to 34 minutes: 81
35 to 39 minutes: 8
40 to 44 minutes: 17
45 to 59 minutes: 65
60 to 89 minutes: 42
90 or more minutes: 0
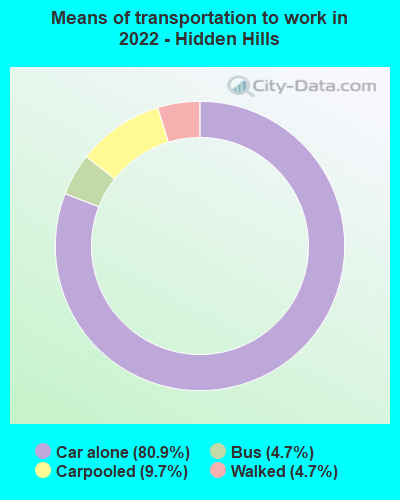
Means of transportation to work:
Drove a car alone: 181 (35.6%)
Carpooled: 24 (4.7%)
Bus: 9 (1.8%)
Walked: 11 (2.2%)
Worked at home: 353 (69.4%)
Unemployment by race in 2022
Unemployment rate for White non-Hispanic residents
4.7%Males
3.8%Females
Unemployment rate for two or more race residents
1.5%Females
Unemployment rate for Hispanic or Latino residents
1.0%Females
Year of entry for the foreign-born population in Hidden Hills, California
1442010 or later
222000 to 2009
321990 to 1999
511980 to 1989
371970 to 1979
99Before 1970
First ancestries reported:
American: 133 (15.9%)
European: 54 (6.4%)
Italian: 44 (5.3%)
Irish: 40 (4.8%)
British: 38 (4.5%)
Russian: 36 (4.3%)
Swedish: 35 (4.2%)
Canadian: 31 (3.7%)
Eastern European: 29 (3.5%)
English: 21 (2.5%)
German: 19 (2.3%)
Ukrainian: 18 (2.1%)
Greek: 12 (1.4%)
Scotch-Irish: 11 (1.3%)
Scottish: 9 (1.1%)
Australian: 8 (1.0%)
Iranian: 8 (1.0%)
Polish: 7 (0.8%)
Romanian: 7 (0.8%)
Lebanese: 5 (0.6%)
Slovak: 5 (0.6%)
Basque: 4 (0.5%)
Northern European: 4 (0.5%)
Lithuanian: 3 (0.4%)
Norwegian: 3 (0.4%)
Brazilian: 2 (0.2%)
French Canadian: 2 (0.2%)
Hungarian: 2 (0.2%)
French: 1 (0.1%)
Most common places of birth for foreign-born residents (%):
Canada
Hidden Hills:
25.4% (76)
California:
1.2% (127,477)
United Kingdom, excluding England and Scotland
Hidden Hills:
14.4% (43)
California:
0.6% (60,582)
Other Caribbean
Hidden Hills:
7.4% (22)
California:
0.0% (1,988)
El Salvador
Hidden Hills:
6.0% (18)
California:
4.2% (440,287)
Australia
Hidden Hills:
5.4% (16)
California:
0.2% (23,338)
Kazakhstan
Hidden Hills:
4.3% (13)
California:
0.1% (6,648)
Mexico
Hidden Hills:
4.3% (13)
California:
37.2% (3,881,193)
Iran
Hidden Hills:
3.0% (9)
California:
2.0% (206,004)
Sweden
Hidden Hills:
2.7% (8)
California:
0.1% (12,221)
England
Hidden Hills:
2.7% (8)
California:
0.6% (57,953)
Greece
Hidden Hills:
2.3% (7)
California:
0.1% (10,538)
Czechoslovakia (includes Czech Republic and Slovakia)
Hidden Hills:
2.3% (7)
California:
0.1% (9,241)
Taiwan
Hidden Hills:
2.0% (6)
California:
1.7% (176,274)
South Africa
Hidden Hills:
2.0% (6)
California:
0.2% (20,614)
Lebanon
Hidden Hills:
1.7% (5)
California:
0.3% (31,757)
Germany
Hidden Hills:
1.7% (5)
California:
0.7% (73,304)
Place of birth for U.S.-born residents:
This state: 1,376
Other state: 314
Northeast: 151
Midwest: 97
South: 51
West: 17
92.7% of Hidden Hills residents lived in the same house 1 years ago. Out of people who lived in different houses, 45.8% lived in this county. Out of people who lived in different counties, 33.3% lived in California.
Hidden Hills:
92.7%
State average:
88.9%
Education attainment for males 25 years and older:
No schooling: 0
Nursery to 4th grade: 0
5th and 6th grade: 0
7th and 8th grade: 0
9th grade: 0
10th grade: 0
11th grade: 0
12th grade, no diploma: 17
High school graduate (or equivalency): 14
Less than 1 year of college: 63
Some college more than 1 year, no degree: 70
Associate degree: 14
Bachelor's degree: 242
Master's degree: 168
Professional school degree: 89
Doctorate degree: 17
Education attainment for females 25 years and older:
No schooling: 5
Nursery to 4th grade: 0
5th and 6th grade: 0
7th and 8th grade: 13
9th grade: 0
10th grade: 0
11th grade: 0
12th grade, no diploma: 24
High school graduate (or equivalency): 36
Less than 1 year of college: 62
Some college more than 1 year, no degree: 70
Associate degree: 27
Bachelor's degree: 276
Master's degree: 70
Professional school degree: 63
Doctorate degree: 64
Housing units in structures:
One, detached: 676
50 or more: 3
Housing units lacking complete plumbing facilities in 2022: 0.4%
Housing units lacking complete kitchen facilities in 2022: 0.9%
House/condo owner moved in on average 17 years ago