Highland Lake, NJ (New Jersey) Houses and Residents
| Highland Lake: | $302,279 |
| New Jersey: | $428,900 |
Total population: 4,933 (Urban population: 4,905 (all inside urban clusters), Rural population: 80 (all nonfarm))
Houses: 2,551 (1,977 occupied: 1,721 owner occupied, 248 renter occupied)
| % of renters here: | 13% |
| State: | 35% |
Housing density: 506 houses/condos per square mile
Median price asked for vacant for-sale houses and condos in 2022 in this county: $113,516.
Median contract rent in 2022: $1,554 (lower quartile is $1,318, upper quartile is $1,825)
Median rent asked for vacant for-rent units in 2022: $1,510
Median gross rent in Highland Lake, NJ in 2022: $1,707
Housing units in Highland Lake with a mortgage: 1,165 (37 second mortgage, 124 home equity loan, 0 both second mortgage and home equity loan)
Houses without a mortgage: 373
Median household income for houses/condos with a mortgage: $125,530
Median household income for apartments without a mortgage: $94,825
Median monthly housing costs: $1,892


 | Information about Highland Lakes, NJ? (0 replies) |
| Affordable family friendly area between Lake Hopatcong/West Milford area and Pearl River, NY to rent in? (10 replies) |

Median year apartment built: 1958
Household type by relationship:
Households: 4,858- In family households: 4,341 (772 male householders, 705 female householders)
1,084 spouses, 1,544 children (1,327 natural, 115 adopted, 101 stepchildren), 64 grandchildren, 0 brothers or sisters, 8 parents, 0 foster children, 94 other relatives, 66 non-relatives
- In nonfamily households: 510 (175 male householders (162 living alone)), 240 female householders (156 living alone)), 94 nonrelatives
- In group quarters: 6
Size of family households: 727 2-persons, 425 3-persons, 276 4-persons, 77 5-persons, 25 6-persons.
Size of nonfamily households: 328 1-person, 102 2-persons.
727 married couples with children.
183 single-parent households (85 men, 98 women).
88.9% of residents of Highland Lake speak English at home.
5.1% of residents speak Spanish at home (77% speak English very well, 23% speak English not well).
1.6% of residents speak other Indo-European language at home (82% speak English very well, 18% speak English well).
0.1% of residents speak Asian or Pacific Island language at home (100% speak English well).
Foreign born population: 293 (6.2%)
(80.2% of them are naturalized citizens)
| Here: | 5.8 |
| State: | 6.8 |
| Here: | 4.6 |
| State: | 3.9 |

- Bedrooms in owner-occupied houses and condos in Highland Lake, New Jersey
- 0no bedroom
- 721 bedroom
- 6642 bedrooms
- 7833 bedrooms
- 2024 bedrooms
- 05+ bedrooms

- Bedrooms in renter-occupied apartments in Highland Lake, New Jersey
- 0no bedroom
- 01 bedroom
- 1512 bedrooms
- 973 bedrooms
- 04 bedrooms
- 05+ bedrooms

- Cars and other vehicles available in Highland Lake in owner-occupied houses/condos
- 50no vehicle
- 2861 vehicle
- 8432 vehicles
- 3563 vehicles
- 1394 vehicles
- 605+ vehicles

- Cars and other vehicles available in Highland Lake in renter-occupied apartments
- 0no vehicle
- 1181 vehicle
- 1332 vehicles
- 03 vehicles
- 04 vehicles
- 05+ vehicles

- Rooms in owner-occupied houses in Highland Lake, New Jersey
- 01 room
- 02 rooms
- 223 rooms
- 2884 rooms
- 5015 rooms
- 3046 rooms
- 3017 rooms
- 1968 rooms
- 1229+ rooms

- Rooms in renter-occupied apartments in Highland Lake, New Jersey
- 01 room
- 02 rooms
- 603 rooms
- 464 rooms
- 1175 rooms
- 116 rooms
- 167 rooms
- 08 rooms
- 09+ rooms


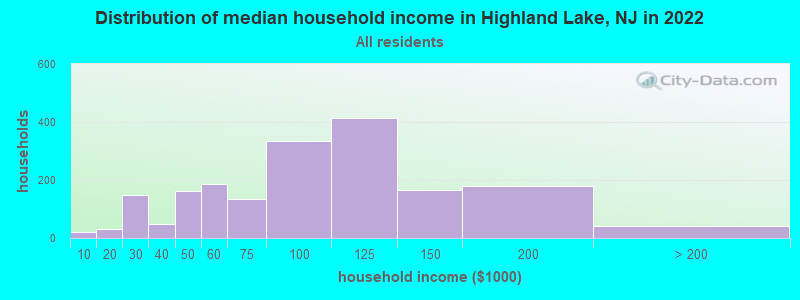
Highland Lake, NJ household income distribution

- 22Less than $10,000
- 32$10,000 to $19,999
- 147$20,000 to $29,999
- 48$30,000 to $39,999
- 163$40,000 to $49,999
- 185$50,000 to $59,999
- 134$60,000 to $74,999
- 336$75,000 to $99,999
- 413$100,000 to $124,999
- 167$125,000 to $149,999
- 178$150,000 to $199,999
- 40$200,000 or more
Rent paid by renters in 2012_5yr in Highland Lake, NJ
-
- 9$800 to $899
- 99$900 to $999
- 82$1,000 to $1,249
- 11$1,250 to $1,499
- 45$1,500 to $1,999
- 11No cash rent


Percentage of workers working in this county: 40.9%
Number of people working at home: 712 (25.0% of all workers)
Travel time to work (commute)
- Less than 5 minutes: 34
- 5 to 9 minutes: 52
- 10 to 14 minutes: 219
- 15 to 19 minutes: 64
- 20 to 24 minutes: 293
- 25 to 29 minutes: 47
- 30 to 34 minutes: 261
- 35 to 39 minutes: 29
- 40 to 44 minutes: 214
- 45 to 59 minutes: 628
- 60 to 89 minutes: 417
- 90 or more minutes: 180
Means of transportation to work:
- Drove a car alone: 2,076 (83.0%)
- Carpooled: 294 (11.8%)
- Bus or trolley bus: 27 (1.1%)
- Other means: 19 (0.8%)
- Worked at home: 85 (3.4%)

- Unemployment by race in 2022
- Unemployment rate for White non-Hispanic residents
- 6.4%Males
- 10.3%Females
- Unemployment rate for Black residents
- 100.0%Females
- Unemployment rate for Hispanic or Latino residents
- 12.5%Males
- 18.3%Females
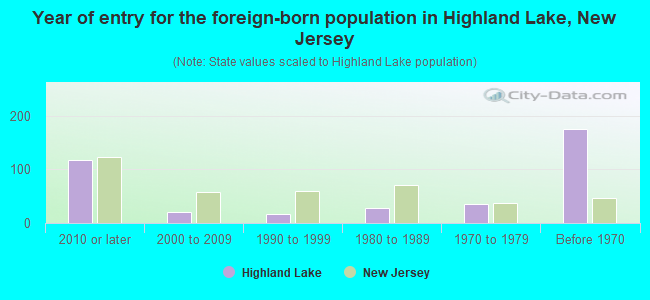
- Year of entry for the foreign-born population in Highland Lake, New Jersey
- 1182010 or later
- 202000 to 2009
- 171990 to 1999
- 281980 to 1989
- 361970 to 1979
- 175Before 1970

First ancestries reported:
- Italian: 404 (25.6%)
- Irish: 192 (12.1%)
- German: 130 (8.2%)
- Polish: 72 (4.6%)
- European: 63 (4.0%)
- Dutch: 62 (3.9%)
- Ukrainian: 61 (3.9%)
- American: 57 (3.6%)
- Northern European: 23 (1.5%)
- Norwegian: 13 (0.8%)
- Scottish: 12 (0.8%)
- Scandinavian: 11 (0.7%)
- Scotch-Irish: 9 (0.6%)
- Hungarian: 7 (0.4%)
- U.S. Virgin Islander: 1 (0.06%)
Most common places of birth for foreign-born residents (%):
| Highland Lake: | 37.7% (106) |
| New Jersey: | 100.0% (-1) |
| Highland Lake: | 21.0% (59) |
| New Jersey: | 100.0% (-1) |
| Highland Lake: | 19.6% (55) |
| New Jersey: | 100.0% (-1) |
| Highland Lake: | 12.8% (36) |
| New Jersey: | 100.0% (-1) |
| Highland Lake: | 4.3% (12) |
| New Jersey: | 100.0% (-1) |
| Highland Lake: | 3.9% (11) |
| New Jersey: | 100.0% (-1) |
Place of birth for U.S.-born residents:
- This state: 3,643
- Other state: 743
- Northeast: 686
- Midwest: 19
- South: 36
- West: 23
89.7% of Highland Lake residents lived in the same house 1 years ago.
Out of people who lived in different houses, 22.0% lived in this county.
Out of people who lived in different counties, 82.6% lived in New Jersey.
| Highland Lake: | 89.7% |
| State average: | 90.4% |
Education attainment for males 25 years and older:
- No schooling: 24
- Nursery to 4th grade: 0
- 5th and 6th grade: 0
- 7th and 8th grade: 9
- 9th grade: 0
- 10th grade: 125
- 11th grade: 12
- 12th grade, no diploma: 15
- High school graduate (or equivalency): 667
- Less than 1 year of college: 88
- Some college more than 1 year, no degree: 306
- Associate degree: 179
- Bachelor's degree: 332
- Master's degree: 133
- Professional school degree: 42
- Doctorate degree: 14

Education attainment for females 25 years and older:
- No schooling: 24
- Nursery to 4th grade: 0
- 5th and 6th grade: 0
- 7th and 8th grade: 0
- 9th grade: 1
- 10th grade: 0
- 11th grade: 4
- 12th grade, no diploma: 0
- High school graduate (or equivalency): 541
- Less than 1 year of college: 79
- Some college more than 1 year, no degree: 339
- Associate degree: 110
- Bachelor's degree: 536
- Master's degree: 125
- Professional school degree: 18
- Doctorate degree: 15


Housing units in structures:
- One, detached: 2,369
- One, attached: 12
- Two: 46
- 5 to 9: 122
House/condo owner moved in on average 19 years ago
Renter moved in on average 8 years ago

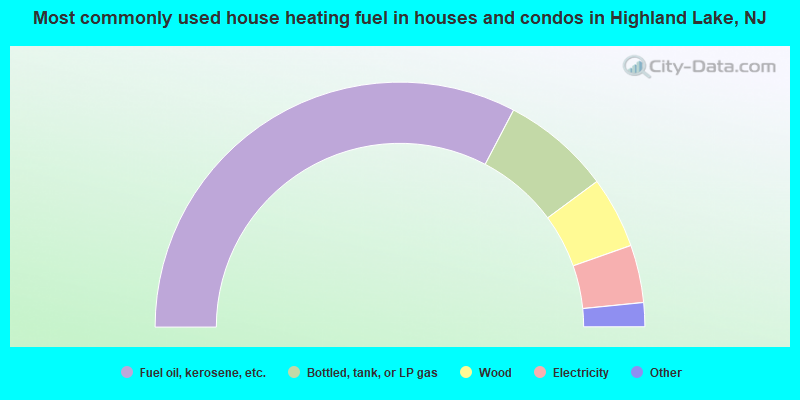
- 65.5%Fuel oil, kerosene, etc.
- 14.4%Bottled, tank, or LP gas
- 9.5%Wood
- 7.6%Electricity
- 1.4%Other fuel
- 0.9%Utility gas
- 0.9%Coal or coke
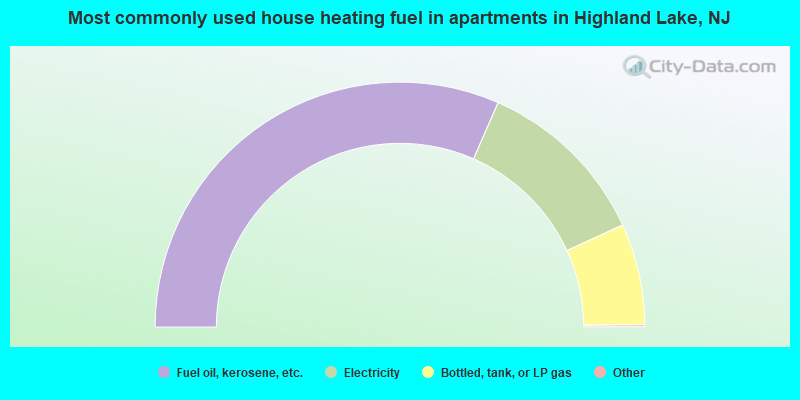
- 63.4%Fuel oil, kerosene, etc.
- 23.3%Electricity
- 13.4%Bottled, tank, or LP gas
Private vs. public school enrollment:
| Here: | 0.0% |
| New Jersey: | 12.3% |
| Here: | 14.7% |
| New Jersey: | 13.1% |
| Here: | 23.6% |
| New Jersey: | 33.2% |


