Highland Park, IL (Illinois) Houses and Residents
| Highland Park: | $619,654 |
| Illinois: | $251,600 |
Mean price in 2022:
Detached houses: $747,344
Here: $747,344 State: $310,164 Townhouses or other attached units: $489,344
Here: $489,344 State: $286,230 In 2-unit structures: $297,455
Here: $297,455 State: $299,638 In 3-to-4-unit structures: $406,713
Here: $406,713 State: $330,907 In 5-or-more-unit structures: $435,501
Here: $435,501 State: $318,887
Total population: 29,871 (All urban)
Houses: 12,681 (12,150 occupied: 10,414 owner occupied, 1,968 renter occupied)
| % of renters here: | 16% |
| State: | 33% |
Housing density: 1,026 houses/condos per square mile
Median price asked for vacant for-sale houses and condos in 2022: $514,997.
Median contract rent in 2022: $1,755 (lower quartile is $1,284, upper quartile is over $2,000)
Median rent asked for vacant for-rent units in 2022: $2,194
Median gross rent in Highland Park, IL in 2022: $1,927
Housing units in Highland Park with a mortgage: 6,712 (847 second mortgage, 10 home equity loan, 709 both second mortgage and home equity loan)
Houses without a mortgage: 508
Median household income for houses/condos with a mortgage: $209,340
Median household income for apartments without a mortgage: $135,830
Median monthly housing costs: $2,542
Compare current foreclosures near Highland Park, IL:
| Photo | Address | Area | Beds / Baths | Price | Details |
|---|---|---|---|---|---|

|
#1
Keats Ln
Highland Park, IL 60035
|
5,000 sq. feet
|
6 baths 5 beds |
show details | |

|
#2
Ridge Rd
Highland Park, IL 60035
|
3,036 sq. feet
|
3 baths 5 beds |
show details | |

|
#3
Mccraren Rd
Highland Park, IL 60035
|
2,680 sq. feet
|
2 baths 4 beds |
show details | |

|
#4
Fort Sheridan Ave
Highland Park, IL 60035
|
1,493 sq. feet
|
1 baths - beds |
show details | |

|
#5
Keats Ln
Highland Park, IL 60035
|
3,869 sq. feet
|
2 baths - beds |
show details | |

|
#6
Ridge Rd
Highland Park, IL 60035
|
3,036 sq. feet
|
4 baths - beds |
show details | |

|
#7
Magnolia Ln
Highland Park, IL 60035
|
2,840 sq. feet
|
3 baths - beds |
show details | |

|
#8
Lawrence Ln
Highland Park, IL 60035
|
7,216 sq. feet
|
3 baths - beds |
show details | |

|
#9
Winthrop Rd
Highland Park, IL 60035
|
2,052 sq. feet
|
2 baths - beds |
show details | |

|
#10
Balsam Rd
Highland Park, IL 60035
|
4,687 sq. feet
|
4 baths - beds |
show details |
| Photo | Address | Area | Beds / Baths | Price | Details |
|---|---|---|---|---|---|

|
#11
Berkeley Rd
Highland Park, IL 60035
|
1,662 sq. feet
|
3 baths - beds |
show details | |

|
#12
Sheridan Rd
Highland Park, IL 60035
|
2,903 sq. feet
|
3 baths - beds |
show details | |

|
#13
Sumac Rd
Highland Park, IL 60035
|
1,360 sq. feet
|
1 baths - beds |
show details | |

|
#14
Gray Ave
Highland Park, IL 60035
|
1,855 sq. feet
|
2 baths - beds |
show details | |

|
#15
Malory Ln
Highland Park, IL 60035
|
8,632 sq. feet
|
4 baths - beds |
show details | |

|
#16
Central Ave
Highland Park, IL 60035
|
- sq. feet
|
- baths - beds |
show details | |

|
#17
Green Bay Rd # 130
Highland Park, IL 60035
|
- sq. feet
|
- baths - beds |
show details | |

|
#18
Waverly Rd
Highland Park, IL 60035
|
- sq. feet
|
- baths - beds |
show details | |

|
#19
Western Ave
Highland Park, IL 60035
|
- sq. feet
|
- baths - beds |
show details | |

|
#20
N 4th Ave
Des Plaines, IL 60016
|
1,381 sq. feet
|
1 baths 3 beds |
$335,000
|
show details |
| Photo | Address | Area | Beds / Baths | Price | Details |
|---|---|---|---|---|---|

|
#21
N Sheridan Rd Apt 6e
Chicago, IL 60660
|
1,200 sq. feet
|
2 baths 2 beds |
$255,000
|
show details |

|
#22
S Lyman Ave
Des Plaines, IL 60016
|
2,233 sq. feet
|
2 baths 4 beds |
$330,000
|
show details |

|
#23
Carriage Way Dr
Arlington Heights, IL 60004
|
- sq. feet
|
2 baths 2 beds |
$179,900
|
show details |

|
#24
N Francisco Ave
Chicago, IL 60659
|
1,100 sq. feet
|
1 baths 2 beds |
$159,000
|
show details |

|
#25
N Austin Ave
Chicago, IL 60634
|
2,500 sq. feet
|
3 baths 4 beds |
$365,000
|
show details |

|
#26
N Olcott Ave
Chicago, IL 60634
|
2,161 sq. feet
|
2 baths 4 beds |
$559,000
|
show details |

|
#27
Main St
Skokie, IL 60076
|
1,428 sq. feet
|
1 baths 3 beds |
$455,000
|
show details |

|
#28
Webster Ln
Des Plaines, IL 60018
|
1,608 sq. feet
|
3 baths 3 beds |
$515,000
|
show details |

|
#29
Christiana Ave # 1
Skokie, IL 60076
|
1,400 sq. feet
|
1 baths 3 beds |
$319,000
|
show details |

|
#30
Wilke Rd
Rolling Meadows, IL 60008
|
1,061 sq. feet
|
1 baths 2 beds |
$319,900
|
show details |
| Photo | Address | Area | Beds / Baths | Price | Details |
|---|---|---|---|---|---|

|
#31
Avenida Serra Test
Des Plaines, IL 60018
|
- sq. feet
|
2 baths 3 beds |
$100,000
|
show details |

|
#32
Woods Dr Unit Unit 2004
Skokie, IL 60077
|
- sq. feet
|
2 baths 3 beds |
$572,000
|
show details |

|
#33
Scarsdale Ct Unit C2
Schaumburg, IL 60193
|
950 sq. feet
|
1 baths 2 beds |
show details | |

|
#34
N Marmora Ave
Chicago, IL 60634
|
2,036 sq. feet
|
3 baths 4 beds |
show details | |

|
#35
N Greentree Rd
Grayslake, IL 60030
|
2,008 sq. feet
|
2 baths 4 beds |
show details | |

|
#36
N Lakewood Ave
Chicago, IL 60660
|
1,600 sq. feet
|
1 baths 4 beds |
show details | |

|
#37
Emerson St
Morton Grove, IL 60053
|
1,296 sq. feet
|
2 baths 3 beds |
show details | |

|
#38
W Windsor Ave
Chicago, IL 60630
|
1,461 sq. feet
|
2 baths 4 beds |
show details | |

|
#39
N Ridge Ave Apt 1w
Chicago, IL 60660
|
875 sq. feet
|
1 baths 2 beds |
show details | |

|
#40
Oliphant Ave
Morton Grove, IL 60053
|
1,728 sq. feet
|
2 baths 4 beds |
show details |
| Photo | Address | Area | Beds / Baths | Price | Details |
|---|---|---|---|---|---|

|
#41
N California Ave
Chicago, IL 60625
|
1,767 sq. feet
|
2 baths 3 beds |
show details | |

|
#42
E Lake Ave
Glenview, IL 60025
|
2,300 sq. feet
|
5 baths 4 beds |
show details | |

|
#43
Thompson Blvd
Buffalo Grove, IL 60089
|
1,670 sq. feet
|
3 baths 4 beds |
show details | |

|
#44
N Whipple St
Chicago, IL 60618
|
1,121 sq. feet
|
2 baths 4 beds |
show details | |

|
#45
Montrose Ave
Schiller Park, IL 60176
|
961 sq. feet
|
1 baths 3 beds |
show details | |

|
#46
Flora Ave
Glenview, IL 60025
|
2,100 sq. feet
|
3 baths 4 beds |
show details | |

|
#47
Bentley Pl
Buffalo Grove, IL 60089
|
1,592 sq. feet
|
2 baths 2 beds |
show details | |

|
#48
Sheryl Ln
Glenview, IL 60025
|
1,269 sq. feet
|
2 baths 3 beds |
show details | |

|
#49
Winston Dr
Schaumburg, IL 60192
|
1,379 sq. feet
|
2 baths 3 beds |
show details | |

|
Check over 1 million property listings on Foreclosure.com!
|
browse all offers | |||


 | Buying a condo to rent out in Highland Park? (5 replies) |
| Chicago Suburbs With The Most Beautiful Houses (26 replies) |
| Never Thought I'd See The Day...Highland Park (51 replies) |
| Very weak housing market in Highland Park (66 replies) |
| Highland Park Schools vs other North Shore Suburbs (4 replies) |
| Deciding between north shore villages for our "forever ish" home (15 replies) |

Median year apartment built: 1971
Household type by relationship:
Households: 30,039- Male householders: 6,227 (864 living alone), Female householders: 5,799 (2,129 living alone)
7,764 spouses (7,712 opposite-sex spouses), 367 unmarried partners, (367 opposite-sex unmarried partners), 8,609 children (8,149 natural, 200 adopted, 258 stepchildren), 251 grandchildren, 136 brothers or sisters, 256 parents, 0 foster children, 102 other relatives, 209 non-relatives
- In group quarters: 314
Size of family households: 4,416 2-persons, 1,750 3-persons, 1,939 4-persons, 580 5-persons, 131 6-persons, 66 7-or-more-persons.
Size of nonfamily households: 3,161 1-person, 363 2-persons, 5 3-persons.
6,299 married couples with children.
514 single-parent households (188 men, 326 women).
83.6% of residents of Highland Park speak English at home.
8.5% of residents speak Spanish at home (43% speak English very well, 43% speak English well, 7% speak English not well, 6% don't speak English at all).
6.7% of residents speak other Indo-European language at home (74% speak English very well, 23% speak English well, 2% speak English not well, 2% don't speak English at all).
1.8% of residents speak Asian or Pacific Island language at home (63% speak English very well, 30% speak English well, 6% speak English not well, 1% don't speak English at all).
0.4% of residents speak other language at home (95% speak English very well, 5% speak English well).
Foreign born population: 3,555 (11.8%)
(69.5% of them are naturalized citizens)
| Here: | 7.9 |
| State: | 6.4 |
| Here: | 4.9 |
| State: | 4.1 |

- Bedrooms in owner-occupied houses and condos in Highland Park, Illinois
- 0no bedroom
- 371 bedroom
- 1,2572 bedrooms
- 3,6443 bedrooms
- 3,7144 bedrooms
- 1,7625+ bedrooms

- Bedrooms in renter-occupied apartments in Highland Park, Illinois
- 131no bedroom
- 3041 bedroom
- 8182 bedrooms
- 4663 bedrooms
- 2104 bedrooms
- 405+ bedrooms

- Cars and other vehicles available in Highland Park in owner-occupied houses/condos
- 206no vehicle
- 2,7971 vehicle
- 5,4902 vehicles
- 1,5103 vehicles
- 3004 vehicles
- 1125+ vehicles

- Cars and other vehicles available in Highland Park in renter-occupied apartments
- 210no vehicle
- 9701 vehicle
- 6412 vehicles
- 1053 vehicles
- 74 vehicles
- 365+ vehicles

- Rooms in owner-occupied houses in Highland Park, Illinois
- 01 room
- 02 rooms
- 1063 rooms
- 3364 rooms
- 8345 rooms
- 1,3846 rooms
- 1,6667 rooms
- 2,4238 rooms
- 3,6649+ rooms

- Rooms in renter-occupied apartments in Highland Park, Illinois
- 1201 room
- 1092 rooms
- 1643 rooms
- 4284 rooms
- 4125 rooms
- 2216 rooms
- 2057 rooms
- 1348 rooms
- 1779+ rooms


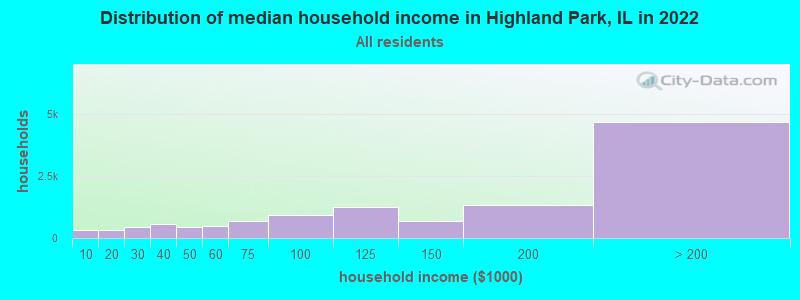
Highland Park, IL household income distribution

- 314Less than $10,000
- 316$10,000 to $19,999
- 456$20,000 to $29,999
- 552$30,000 to $39,999
- 453$40,000 to $49,999
- 469$50,000 to $59,999
- 691$60,000 to $74,999
- 926$75,000 to $99,999
- 1,254$100,000 to $124,999
- 669$125,000 to $149,999
- 1,344$150,000 to $199,999
- 4,694$200,000 or more
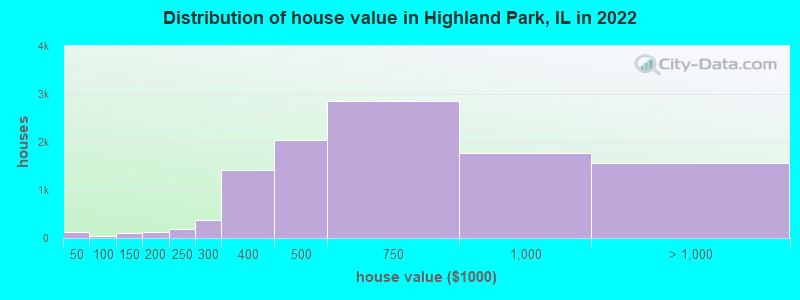
Home value of owner - occupied houses in 2022 in Highland Park, IL
-
- 42Less than $10,000
- 38$20,000 to $24,999
- 28$25,000 to $29,999
- 14$30,000 to $34,999
- 5$35,000 to $39,999
- 6$50,000 to $59,999
- 12$60,000 to $69,999
- 18$70,000 to $79,999
- 40$100,000 to $124,999
- 72$125,000 to $149,999
- 78$150,000 to $174,999
- 44$175,000 to $199,999
- 191$200,000 to $249,999
- 365$250,000 to $299,999
- 1,423$300,000 to $399,999
- 2,046$400,000 to $499,999
- 2,858$500,000 to $749,999
- 1,764$750,000 to $999,999
- 1,147$1,000,000 to $1,499,999
- 212$1,500,000 to $1,999,999
- 194$2,000,000 or more
Rent paid by renters in 2022 in Highland Park, IL
-
- 3$200 to $249
- 6$250 to $299
- 36$300 to $349
- 16$400 to $449
- 4$450 to $499
- 7$500 to $549
- 28$550 to $599
- 58$800 to $899
- 75$900 to $999
- 208$1,000 to $1,249
- 230$1,250 to $1,499
- 449$1,500 to $1,999
- 252$2,000 to $2,499
- 261$2,500 to $2,999
- 60$3,000 to $3,499
- 77$3,500 or more
- 176No cash rent


Percentage of workers working in this county: 65.8%
Number of people working at home: 4,195 (28.0% of all workers)
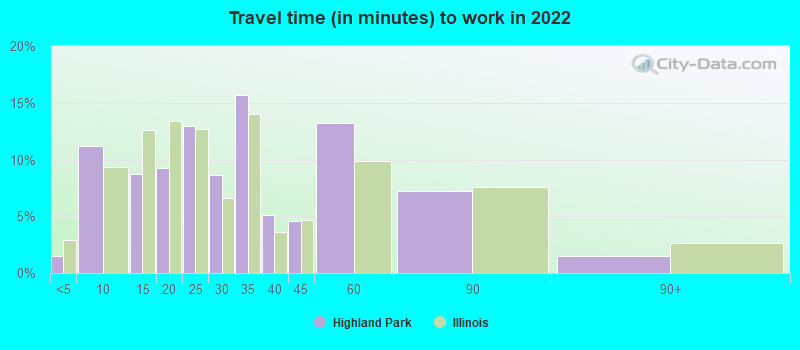
Travel time to work (commute)
- Less than 5 minutes: 212
- 5 to 9 minutes: 1,588
- 10 to 14 minutes: 1,105
- 15 to 19 minutes: 1,442
- 20 to 24 minutes: 1,606
- 25 to 29 minutes: 1,280
- 30 to 34 minutes: 1,211
- 35 to 39 minutes: 179
- 40 to 44 minutes: 392
- 45 to 59 minutes: 888
- 60 to 89 minutes: 1,187
- 90 or more minutes: 165
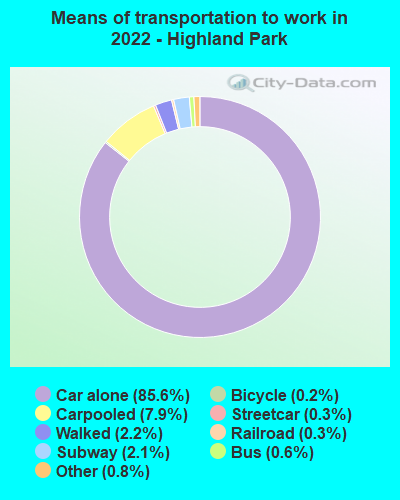
Means of transportation to work:
- Drove a car alone: 9,881 (64.0%)
- Carpooled: 928 (6.0%)
- Bus: 75 (0.5%)
- Subway or elevated rail: 55 (0.4%)
- Long-distance train or commuter rail: 216 (1.4%)
- Light rail, streetcar or trolley: 36 (0.2%)
- Taxi: 94 (0.6%)
- Bicycle: 37 (0.2%)
- Walked: 251 (1.6%)
- Worked at home: 4,195 (27.2%)

- Unemployment by race in 2022
- Unemployment rate for White non-Hispanic residents
- 1.5%Males
- 2.4%Females
- Unemployment rate for Black residents
- 4.5%Females
- Unemployment rate for Asian residents
- 0.5%Males
- Unemployment rate for two or more race residents
- 0.7%Males
- 5.7%Females
- Unemployment rate for Hispanic or Latino residents
- 5.1%Males
- 7.1%Females

- Year of entry for the foreign-born population in Highland Park, Illinois
- 7112010 or later
- 4682000 to 2009
- 1,1841990 to 1999
- 1,0691980 to 1989
- 7561970 to 1979
- 982Before 1970

First ancestries reported:
- German: 1,266 (9.2%)
- American: 1,185 (8.6%)
- Eastern European: 1,094 (7.9%)
- Russian: 979 (7.1%)
- Polish: 746 (5.4%)
- European: 739 (5.4%)
- Italian: 584 (4.2%)
- Irish: 379 (2.7%)
- Ukrainian: 354 (2.6%)
- English: 326 (2.4%)
- Lithuanian: 290 (2.1%)
- Hungarian: 255 (1.8%)
- Iranian: 103 (0.7%)
- Swedish: 99 (0.7%)
- French: 81 (0.6%)
- Latvian: 80 (0.6%)
- Bulgarian: 76 (0.6%)
- Yugoslavian: 72 (0.5%)
- Greek: 71 (0.5%)
- Norwegian: 69 (0.5%)
- Northern European: 50 (0.4%)
- Turkish: 49 (0.4%)
- Romanian: 48 (0.3%)
- Czech: 41 (0.3%)
- Austrian: 40 (0.3%)
- Scandinavian: 39 (0.3%)
- Brazilian: 31 (0.2%)
- Belgian: 28 (0.2%)
- Danish: 27 (0.2%)
- Dutch: 23 (0.2%)
- Jamaican: 22 (0.2%)
- Scottish: 20 (0.1%)
- Scotch-Irish: 20 (0.1%)
- British: 19 (0.1%)
- Welsh: 14 (0.1%)
- Barbadian: 14 (0.1%)
- Egyptian: 13 (0.09%)
- Israeli: 13 (0.09%)
- Luxembourger: 11 (0.08%)
- Portuguese: 11 (0.08%)
- Czechoslovakian: 10 (0.07%)
- Serbian: 10 (0.07%)
- Slovene: 9 (0.07%)
- Canadian: 8 (0.06%)
- Lebanese: 7 (0.05%)
- Assyrian: 7 (0.05%)
- Armenian: 6 (0.04%)
Most common places of birth for foreign-born residents (%):
| Highland Park: | 23.3% (793) |
| Illinois: | 34.7% (626,958) |
| Highland Park: | 6.3% (215) |
| Illinois: | 0.9% (15,679) |
| Highland Park: | 5.5% (188) |
| Illinois: | 9.2% (166,409) |
| Highland Park: | 5.5% (187) |
| Illinois: | 1.6% (29,316) |
| Highland Park: | 5.0% (172) |
| Illinois: | 0.2% (2,988) |
| Highland Park: | 5.0% (170) |
| Illinois: | 1.0% (18,753) |
| Highland Park: | 5.0% (169) |
| Illinois: | 5.2% (93,003) |
| Highland Park: | 3.8% (128) |
| Illinois: | 0.8% (14,165) |
| Highland Park: | 3.5% (120) |
| Illinois: | 4.1% (74,364) |
| Highland Park: | 3.1% (107) |
| Illinois: | 1.1% (19,306) |
| Highland Park: | 2.9% (99) |
| Illinois: | 0.6% (10,776) |
| Highland Park: | 2.7% (93) |
| Illinois: | 0.9% (16,308) |
| Highland Park: | 2.7% (92) |
| Illinois: | 0.3% (4,823) |
| Highland Park: | 2.4% (83) |
| Illinois: | 6.9% (124,474) |
| Highland Park: | 2.0% (67) |
| Illinois: | 2.2% (40,393) |
| Highland Park: | 1.8% (61) |
| Illinois: | 0.3% (6,186) |
| Highland Park: | 1.6% (53) |
| Illinois: | 0.6% (10,943) |
Place of birth for U.S.-born residents:
- This state: 17,905
- Other state: 8,036
- Northeast: 1,908
- Midwest: 3,555
- South: 1,277
- West: 1,209
87.5% of Highland Park residents lived in the same house 1 years ago.
Out of people who lived in different houses, 28.3% lived in this county.
Out of people who lived in different counties, 68.1% lived in Illinois.
| Highland Park: | 87.5% |
| State average: | 88.3% |
Education attainment for males 25 years and older:
- No schooling: 47
- Nursery to 4th grade: 1
- 5th and 6th grade: 33
- 7th and 8th grade: 102
- 9th grade: 0
- 10th grade: 63
- 11th grade: 13
- 12th grade, no diploma: 40
- High school graduate (or equivalency): 748
- Less than 1 year of college: 122
- Some college more than 1 year, no degree: 765
- Associate degree: 223
- Bachelor's degree: 3,935
- Master's degree: 1,726
- Professional school degree: 2,173
- Doctorate degree: 650

Education attainment for females 25 years and older:
- No schooling: 24
- Nursery to 4th grade: 0
- 5th and 6th grade: 61
- 7th and 8th grade: 47
- 9th grade: 26
- 10th grade: 0
- 11th grade: 0
- 12th grade, no diploma: 40
- High school graduate (or equivalency): 829
- Less than 1 year of college: 333
- Some college more than 1 year, no degree: 970
- Associate degree: 480
- Bachelor's degree: 4,164
- Master's degree: 3,081
- Professional school degree: 1,023
- Doctorate degree: 536


Housing units in structures:
- One, detached: 9,526
- One, attached: 704
- Two: 215
- 3 or 4: 250
- 5 to 9: 212
- 10 to 19: 317
- 20 to 49: 909
- 50 or more: 535
- Mobile homes: 9
Housing units lacking complete kitchen facilities in 2022: 1.4%
House/condo owner moved in on average 14 years ago
Renter moved in on average 5 years ago

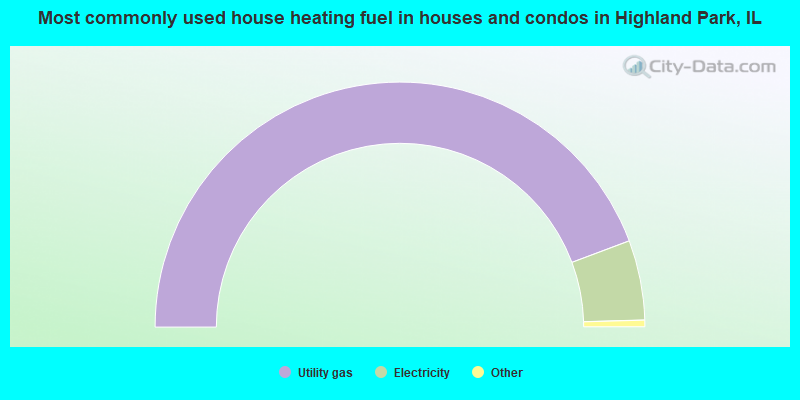
- 88.5%Utility gas
- 10.5%Electricity
- 0.5%Other fuel
- 0.4%Bottled, tank, or LP gas
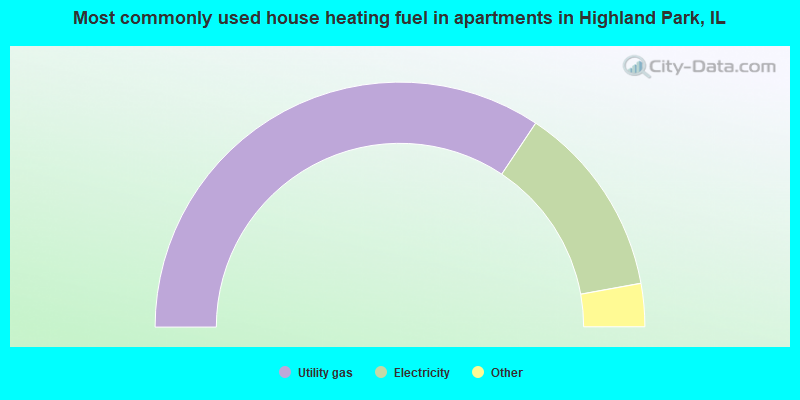
- 68.7%Utility gas
- 25.6%Electricity
- 3.1%No fuel used
- 1.3%Bottled, tank, or LP gas
- 1.2%Other fuel
Private vs. public school enrollment:
| Here: | 9.6% |
| Illinois: | 13.3% |
| Here: | 19.5% |
| Illinois: | 9.9% |
| Here: | 46.1% |
| Illinois: | 27.4% |


