Highland Springs, VA (Virginia) Houses and Residents
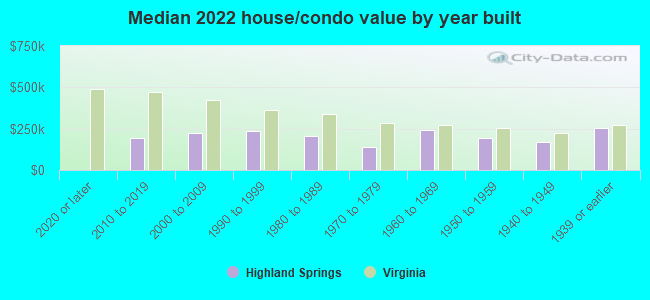
| Highland Springs: | $210,521 |
| Virginia: | $365,700 |
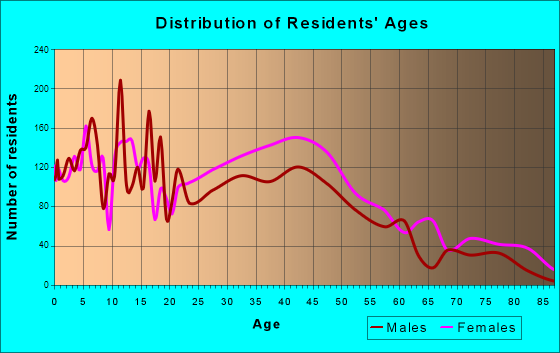
Total population: 15,711 (Urban population: 15,268, Rural population: 0)
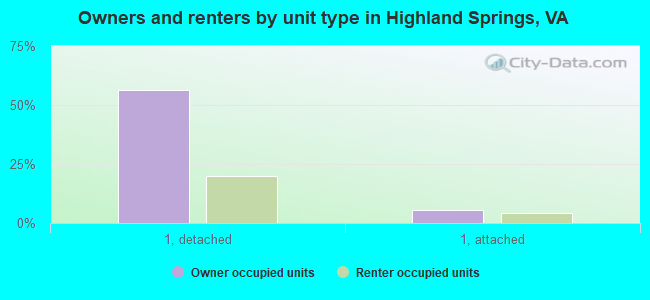
Houses: 6,485 (6,024 occupied: 3,819 owner occupied, 2,210 renter occupied)
| % of renters here: | 37% |
| State: | 33% |
Housing density: 761 houses/condos per square mile
Median price asked for vacant for-sale houses and condos in 2022: $121,268.
Median contract rent in 2022: $996 (lower quartile is $812, upper quartile is $1,332)
Median rent asked for vacant for-rent units in 2022: $21,846
Median gross rent in Highland Springs, VA in 2022: $1,159
Housing units in Highland Springs with a mortgage: 2,653 (179 second mortgage, 0 home equity loan, 77 both second mortgage and home equity loan)
Houses without a mortgage: 88
Median household income for houses/condos with a mortgage: $58,715
Median household income for apartments without a mortgage: $50,616
Median monthly housing costs: $1,115
Compare current foreclosures in Highland Springs, VA:
| Photo | Address | Area | Beds / Baths | Price | Details |
|---|---|---|---|---|---|

|
#1
Wales Dr
Highland Springs, VA 23075
|
4,488 sq. feet
|
3 baths 6 beds |
show details | |

|
#2
N Fern Ave
Highland Springs, VA 23075
|
1,300 sq. feet
|
1 baths 3 beds |
show details | |

|
#3
N Juniper Ave
Highland Springs, VA 23075
|
1,014 sq. feet
|
1 baths 3 beds |
show details | |

|
#4
S Fern Ave
Highland Springs, VA 23075
|
672 sq. feet
|
1 baths 2 beds |
show details | |

|
#5
N Fern Ave
Highland Springs, VA 23075
|
980 sq. feet
|
1 baths 3 beds |
show details | |

|
#6
S Holly Ave
Highland Springs, VA 23075
|
1,080 sq. feet
|
2 baths 3 beds |
show details | |

|
#7
Beaver Rd
Highland Springs, VA 23075
|
1,456 sq. feet
|
2 baths 3 beds |
show details | |

|
#8
Longstreet Ave
Highland Springs, VA 23075
|
1,547 sq. feet
|
1 baths 3 beds |
show details | |

|
#9
Pleasant St
Highland Springs, VA 23075
|
1,218 sq. feet
|
1 baths 3 beds |
show details | |

|
#10
N Grove Ave
Highland Springs, VA 23075
|
960 sq. feet
|
1 baths 3 beds |
show details |
| Photo | Address | Area | Beds / Baths | Price | Details |
|---|---|---|---|---|---|

|
#11
N Daisy Ave
Highland Springs, VA 23075
|
756 sq. feet
|
1 baths 2 beds |
show details | |

|
#12
N Oak Ave
Highland Springs, VA 23075
|
1,080 sq. feet
|
1 baths 2 beds |
show details | |

|
#13
S Holly Ave
Highland Springs, VA 23075
|
1,536 sq. feet
|
1 baths 3 beds |
show details | |

|
#14
N Cedar Ave
Highland Springs, VA 23075
|
792 sq. feet
|
1 baths 2 beds |
show details | |

|
#15
Mornell St
Highland Springs, VA 23075
|
1,048 sq. feet
|
1 baths 3 beds |
show details | |

|
#16
N Grove Ave
Highland Springs, VA 23075
|
1,170 sq. feet
|
1 baths 3 beds |
show details | |

|
#17
S Holly Ave
Highland Springs, VA 23075
|
1,968 sq. feet
|
1 baths 3 beds |
show details | |

|
#18
E Jerald St
Highland Springs, VA 23075
|
1,160 sq. feet
|
1 baths 3 beds |
show details | |

|
#19
N Juniper Ave
Highland Springs, VA 23075
|
952 sq. feet
|
1 baths 3 beds |
show details | |

|
#20
Hart St
Highland Springs, VA 23075
|
1,920 sq. feet
|
2 baths 4 beds |
show details |
| Photo | Address | Area | Beds / Baths | Price | Details |
|---|---|---|---|---|---|

|
#21
N Ivy Ave
Highland Springs, VA 23075
|
1,350 sq. feet
|
1 baths 3 beds |
show details | |

|
#22
W Washington St
Highland Springs, VA 23075
|
1,300 sq. feet
|
1 baths 3 beds |
show details | |

|
#23
E Jerald St
Highland Springs, VA 23075
|
1,300 sq. feet
|
1 baths 3 beds |
show details | |

|
#24
Elsing Green Pl
Highland Springs, VA 23075
|
1,026 sq. feet
|
2 baths 4 beds |
show details | |

|
#25
W Washington St
Highland Springs, VA 23075
|
1,056 sq. feet
|
1 baths 3 beds |
show details | |

|
#26
W Washington St
Highland Springs, VA 23075
|
1,140 sq. feet
|
1 baths 2 beds |
show details | |

|
#27
N Beech Ave
Highland Springs, VA 23075
|
935 sq. feet
|
1 baths 3 beds |
show details | |

|
#28
Wales Dr
Highland Springs, VA 23075
|
2,052 sq. feet
|
3 baths 3 beds |
show details | |

|
#29
N Linden Ave
Highland Springs, VA 23075
|
1,020 sq. feet
|
1 baths 3 beds |
show details | |

|
#30
N Fern Ave
Highland Springs, VA 23075
|
884 sq. feet
|
1 baths 3 beds |
show details |
| Photo | Address | Area | Beds / Baths | Price | Details |
|---|---|---|---|---|---|

|
#31
N Juniper Ave
Highland Springs, VA 23075
|
1,284 sq. feet
|
1 baths 2 beds |
show details | |

|
#32
Airycrest Dr
Highland Springs, VA 23075
|
1,344 sq. feet
|
1 baths 3 beds |
show details | |

|
#33
N Linden Ave
Highland Springs, VA 23075
|
990 sq. feet
|
1 baths 3 beds |
show details | |

|
#34
N New Ave
Highland Springs, VA 23075
|
1,625 sq. feet
|
1 baths 3 beds |
show details | |

|
#35
Kramer Dr
Highland Springs, VA 23075
|
2,000 sq. feet
|
2 baths 3 beds |
show details | |

|
#36
Pleasant St
Highland Springs, VA 23075
|
1,102 sq. feet
|
1 baths 2 beds |
show details | |

|
#37
S Fern Ave
Highland Springs, VA 23075
|
1,754 sq. feet
|
2 baths 4 beds |
show details | |

|
#38
Pleasant St
Highland Springs, VA 23075
|
1,218 sq. feet
|
1 baths 3 beds |
show details | |

|
#39
W Washington St
Highland Springs, VA 23075
|
2,303 sq. feet
|
2 baths 4 beds |
show details | |

|
#40
N Kalmia Ave
Highland Springs, VA 23075
|
980 sq. feet
|
1 baths 3 beds |
show details |
| Photo | Address | Area | Beds / Baths | Price | Details |
|---|---|---|---|---|---|

|
#41
Wales Dr
Highland Springs, VA 23075
|
1,378 sq. feet
|
2 baths 4 beds |
show details | |

|
#42
Pleasant St
Highland Springs, VA 23075
|
1,334 sq. feet
|
2 baths 3 beds |
show details | |

|
#43
S Ivy Ave
Highland Springs, VA 23075
|
944 sq. feet
|
1 baths 3 beds |
show details | |

|
#44
Hitchcock Ave
Highland Springs, VA 23075
|
- sq. feet
|
- baths - beds |
show details | |

|
#45
Airport Ct
Highland Springs, VA 23075
|
- sq. feet
|
- baths - beds |
show details | |

|
#46
N Ivy Ave
Highland Springs, VA 23075
|
- sq. feet
|
- baths - beds |
show details | |

|
#47
N Juniper Ave
Highland Springs, VA 23075
|
- sq. feet
|
- baths - beds |
show details | |

|
#48
Repp Cir
Highland Springs, VA 23075
|
- sq. feet
|
- baths - beds |
show details | |

|
#49
Pleasant St
Highland Springs, VA 23075
|
- sq. feet
|
- baths - beds |
show details | |

|
Check over 1 million property listings on Foreclosure.com!
|
browse all offers | |||


 | Hows Glen Allen & Short Pump to live in? (8 replies) |
| Why is Varina Undeveloped? (19 replies) |
| Am I the only person who can not reccomind living in Richmond to ANYONE? (237 replies) |
| Input on Glen Allen/Short Pump Area for Relocation (39 replies) |
| Highland Springs (6 replies) |
| relocating to Richmond from Chicago (23 replies) |
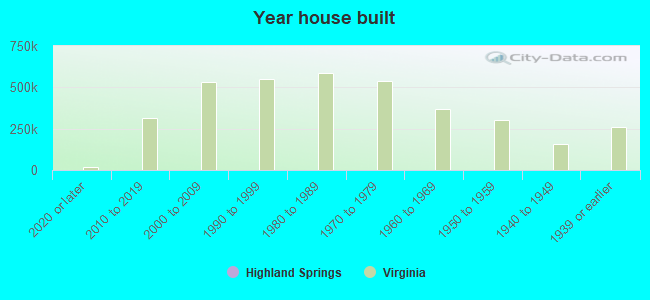
Median year apartment built: 1978
Household type by relationship:
Households: 14,918- Male householders: 2,300 (968 living alone), Female householders: 3,600 (1,077 living alone)
1,822 spouses (1,822 opposite-sex spouses), 324 unmarried partners, (295 opposite-sex unmarried partners), 4,878 children (4,596 natural, 0 adopted, 281 stepchildren), 654 grandchildren, 211 brothers or sisters, 222 parents, 0 foster children, 327 other relatives, 414 non-relatives
- In group quarters: 161
Size of family households: 1,325 2-persons, 1,362 3-persons, 492 4-persons, 156 5-persons, 169 6-persons, 114 7-or-more-persons.
Size of nonfamily households: 2,110 1-person, 285 2-persons, 56 3-persons, 15 4-persons.
1,052 married couples with children.
1,530 single-parent households (366 men, 1,164 women).
97.9% of residents of Highland Springs speak English at home.
1.1% of residents speak Spanish at home (33% speak English very well, 67% speak English well).
1.3% of residents speak other Indo-European language at home (93% speak English very well, 7% speak English well).
0.1% of residents speak Asian or Pacific Island language at home (40% speak English very well, 60% speak English well).
Foreign born population: 606 (4.1%)
(72.8% of them are naturalized citizens)
| Here: | 6.1 |
| State: | 7.0 |
| Here: | 5.1 |
| State: | 4.3 |
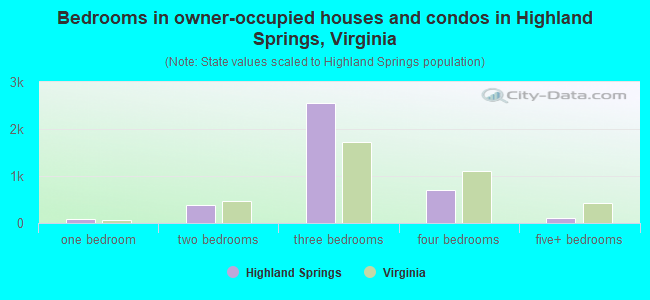
- Bedrooms in owner-occupied houses and condos in Highland Springs, Virginia
- 0no bedroom
- 901 bedroom
- 3772 bedrooms
- 2,5523 bedrooms
- 7004 bedrooms
- 1005+ bedrooms
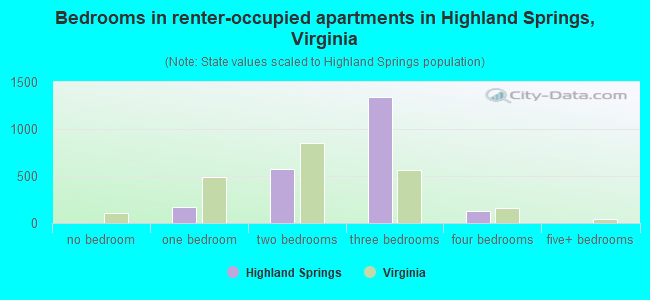
- Bedrooms in renter-occupied apartments in Highland Springs, Virginia
- 0no bedroom
- 1661 bedroom
- 5712 bedrooms
- 1,3443 bedrooms
- 1304 bedrooms
- 05+ bedrooms
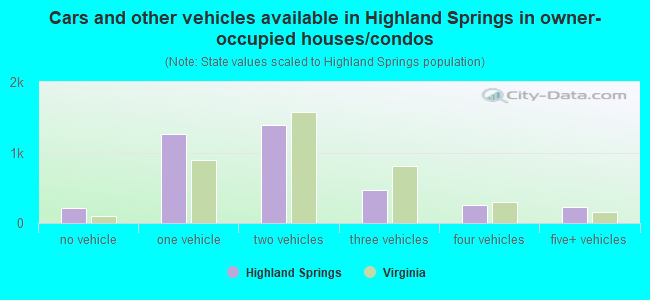
- Cars and other vehicles available in Highland Springs in owner-occupied houses/condos
- 213no vehicle
- 1,2581 vehicle
- 1,3972 vehicles
- 4723 vehicles
- 2584 vehicles
- 2205+ vehicles
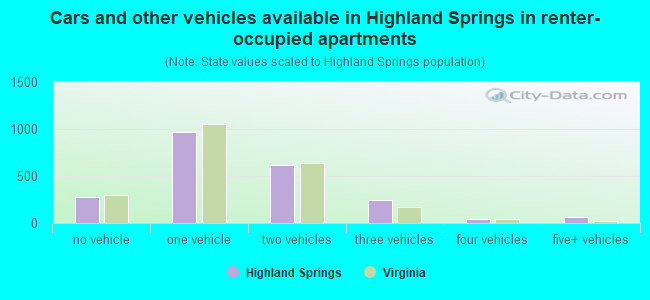
- Cars and other vehicles available in Highland Springs in renter-occupied apartments
- 281no vehicle
- 9681 vehicle
- 6152 vehicles
- 2483 vehicles
- 394 vehicles
- 605+ vehicles
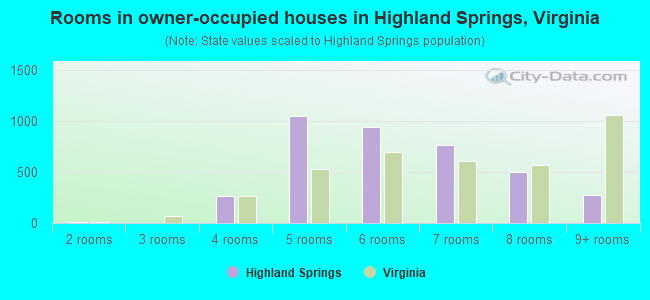
- Rooms in owner-occupied houses in Highland Springs, Virginia
- 01 room
- 52 rooms
- 03 rooms
- 2704 rooms
- 1,0525 rooms
- 9466 rooms
- 7717 rooms
- 5028 rooms
- 2729+ rooms
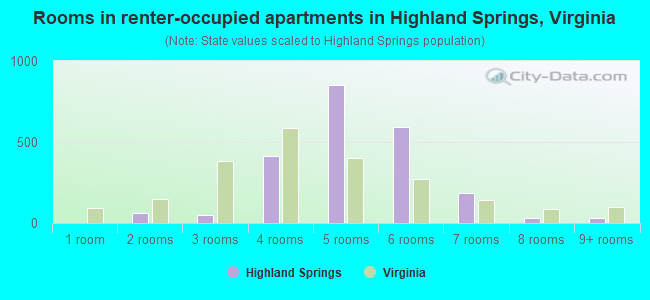
- Rooms in renter-occupied apartments in Highland Springs, Virginia
- 01 room
- 602 rooms
- 483 rooms
- 4114 rooms
- 8515 rooms
- 5906 rooms
- 1857 rooms
- 338 rooms
- 329+ rooms
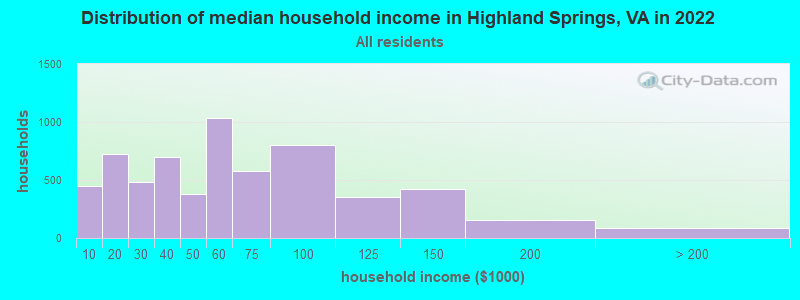
Highland Springs, VA household income distribution

- 447Less than $10,000
- 722$10,000 to $19,999
- 480$20,000 to $29,999
- 698$30,000 to $39,999
- 379$40,000 to $49,999
- 1,035$50,000 to $59,999
- 579$60,000 to $74,999
- 799$75,000 to $99,999
- 353$100,000 to $124,999
- 424$125,000 to $149,999
- 154$150,000 to $199,999
- 84$200,000 or more
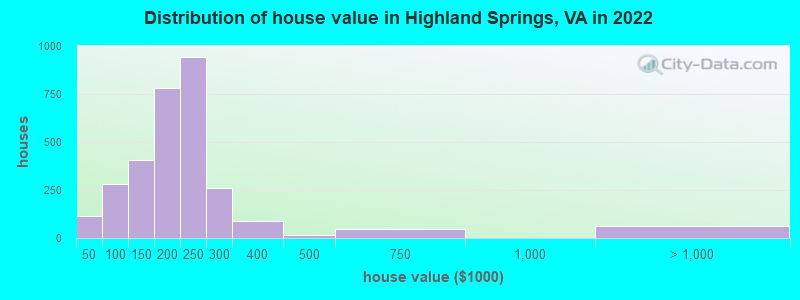
Home value of owner - occupied houses in 2022 in Highland Springs, VA
-
- 56Less than $10,000
- 58$10,000 to $14,999
- 15$60,000 to $69,999
- 30$70,000 to $79,999
- 56$80,000 to $89,999
- 177$90,000 to $99,999
- 51$100,000 to $124,999
- 354$125,000 to $149,999
- 406$150,000 to $174,999
- 371$175,000 to $199,999
- 943$200,000 to $249,999
- 258$250,000 to $299,999
- 86$300,000 to $399,999
- 17$400,000 to $499,999
- 47$500,000 to $749,999
- 49$1,000,000 to $1,499,999
- 14$1,500,000 to $1,999,999
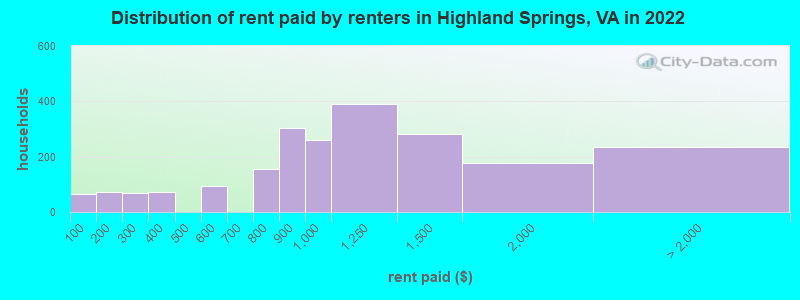
Rent paid by renters in 2022 in Highland Springs, VA
-
- 64Less than $100
- 70$100 to $149
- 69$200 to $249
- 74$350 to $399
- 12$500 to $549
- 80$550 to $599
- 155$750 to $799
- 301$800 to $899
- 260$900 to $999
- 389$1,000 to $1,249
- 283$1,250 to $1,499
- 177$1,500 to $1,999
- 233No cash rent
Percentage of workers working in this county: 54.2%
Number of people working at home: 831 (11.3% of all workers)
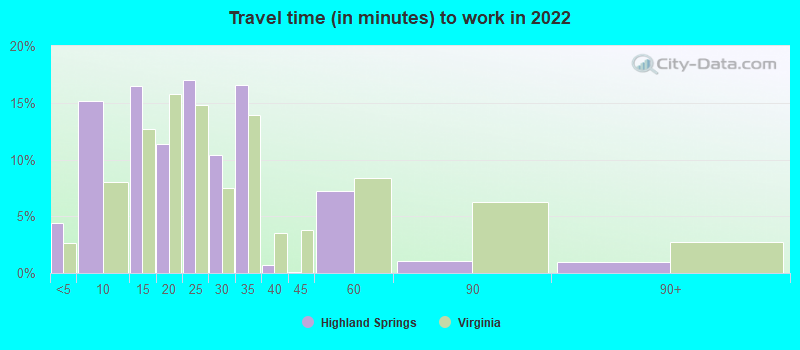
Travel time to work (commute)
- Less than 5 minutes: 118
- 5 to 9 minutes: 462
- 10 to 14 minutes: 730
- 15 to 19 minutes: 977
- 20 to 24 minutes: 1,200
- 25 to 29 minutes: 639
- 30 to 34 minutes: 1,452
- 35 to 39 minutes: 140
- 40 to 44 minutes: 126
- 45 to 59 minutes: 291
- 60 to 89 minutes: 122
- 90 or more minutes: 92
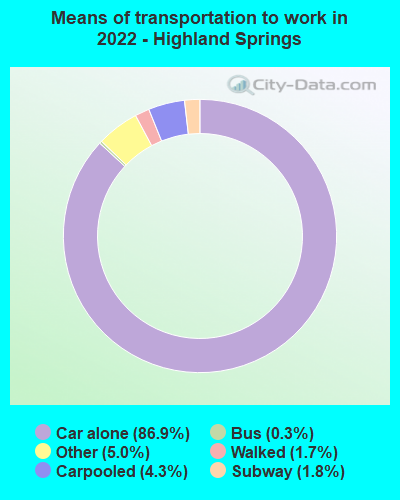
Means of transportation to work:
- Drove a car alone: 1,678 (61.7%)
- Carpooled: 90 (3.3%)
- Bus: 3 (0.1%)
- Long-distance train or commuter rail: 23 (0.8%)
- Taxi: 176 (6.5%)
- Walked: 45 (1.7%)
- Worked at home: 831 (30.5%)
- Unemployment by race in 2022
- Unemployment rate for White non-Hispanic residents
- 0.9%Males
- 2.8%Females
- Unemployment rate for Black residents
- 14.1%Males
- 0.5%Females
- Unemployment rate for other race residents
- 55.9%Males
- Unemployment rate for two or more race residents
- 21.3%Males
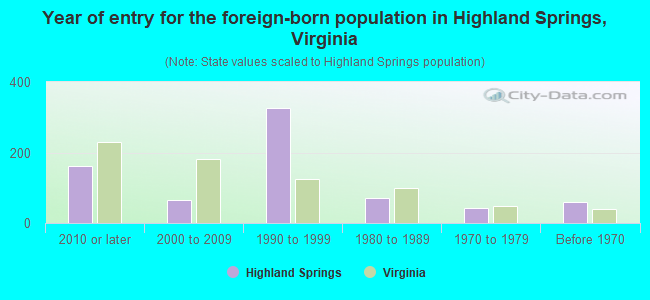
- Year of entry for the foreign-born population in Highland Springs, Virginia
- 1612010 or later
- 652000 to 2009
- 3251990 to 1999
- 711980 to 1989
- 431970 to 1979
- 60Before 1970
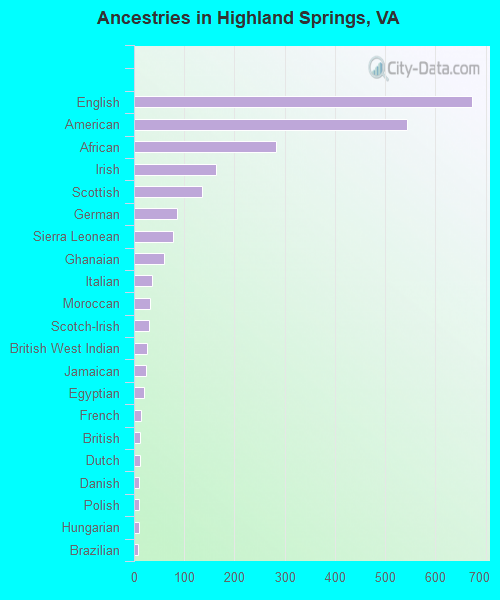
First ancestries reported:
- English: 673 (7.3%)
- American: 543 (5.9%)
- African: 283 (3.1%)
- Irish: 164 (1.8%)
- Scottish: 136 (1.5%)
- German: 85 (0.9%)
- Sierra Leonean: 78 (0.8%)
- Ghanaian: 59 (0.6%)
- Italian: 36 (0.4%)
- Moroccan: 32 (0.3%)
- Scotch-Irish: 30 (0.3%)
- British West Indian: 25 (0.3%)
- Jamaican: 23 (0.3%)
- Egyptian: 19 (0.2%)
- French: 14 (0.2%)
- British: 12 (0.1%)
- Dutch: 11 (0.1%)
- Danish: 10 (0.1%)
- Polish: 10 (0.1%)
- Hungarian: 9 (0.10%)
- Brazilian: 8 (0.09%)
- European: 5 (0.05%)
Most common places of birth for foreign-born residents (%):
| Highland Springs: | 31.2% (196) |
| Virginia: | 0.6% (6,458) |
| Highland Springs: | 17.0% (107) |
| Virginia: | 0.9% (9,842) |
| Highland Springs: | 6.7% (42) |
| Virginia: | 5.3% (57,498) |
| Highland Springs: | 5.9% (37) |
| Virginia: | 0.2% (2,190) |
| Highland Springs: | 5.4% (34) |
| Virginia: | 0.0% (340) |
| Highland Springs: | 4.9% (31) |
| Virginia: | 1.6% (17,346) |
| Highland Springs: | 4.3% (27) |
| Virginia: | 0.1% (1,246) |
| Highland Springs: | 3.5% (22) |
| Virginia: | 0.0% (442) |
| Highland Springs: | 2.9% (18) |
| Virginia: | 3.9% (42,989) |
| Highland Springs: | 2.7% (17) |
| Virginia: | 4.9% (52,857) |
| Highland Springs: | 2.2% (14) |
| Virginia: | 0.4% (4,301) |
| Highland Springs: | 1.6% (10) |
| Virginia: | 0.7% (8,081) |
Place of birth for U.S.-born residents:
- This state: 11,111
- Other state: 2,983
- Northeast: 1,434
- Midwest: 226
- South: 1,121
- West: 181
91.7% of Highland Springs residents lived in the same house 1 years ago.
Out of people who lived in different houses, 38.6% lived in this county.
Out of people who lived in different counties, 87.1% lived in Virginia.
| Highland Springs: | 91.7% |
| State average: | 86.6% |
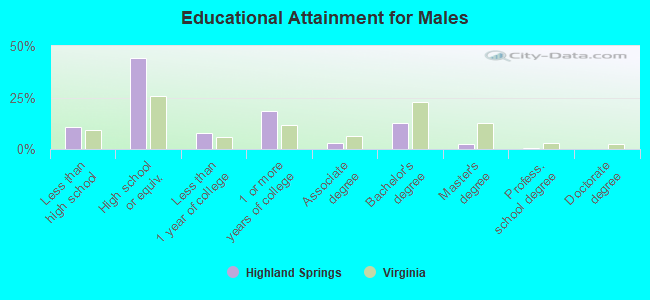
Education attainment for males 25 years and older:
- No schooling: 75
- Nursery to 4th grade: 0
- 5th and 6th grade: 13
- 7th and 8th grade: 30
- 9th grade: 82
- 10th grade: 38
- 11th grade: 31
- 12th grade, no diploma: 209
- High school graduate (or equivalency): 1,990
- Less than 1 year of college: 355
- Some college more than 1 year, no degree: 829
- Associate degree: 130
- Bachelor's degree: 560
- Master's degree: 105
- Professional school degree: 26
- Doctorate degree: 9
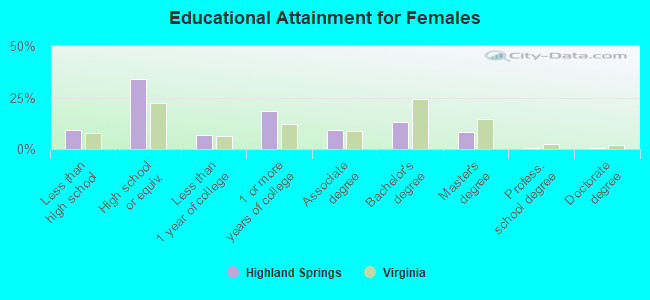
Education attainment for females 25 years and older:
- No schooling: 7
- Nursery to 4th grade: 0
- 5th and 6th grade: 0
- 7th and 8th grade: 37
- 9th grade: 85
- 10th grade: 80
- 11th grade: 79
- 12th grade, no diploma: 180
- High school graduate (or equivalency): 1,750
- Less than 1 year of college: 344
- Some college more than 1 year, no degree: 945
- Associate degree: 463
- Bachelor's degree: 671
- Master's degree: 424
- Professional school degree: 36
- Doctorate degree: 18
Housing units in structures:
- One, detached: 5,122
- One, attached: 589
- Two: 145
- 3 or 4: 69
- 5 to 9: 249
- 10 to 19: 129
- 20 to 49: 35
- 50 or more: 142
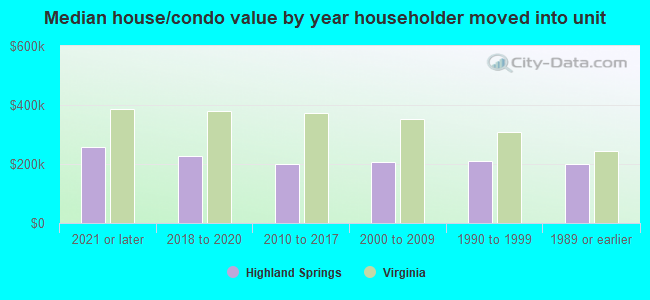
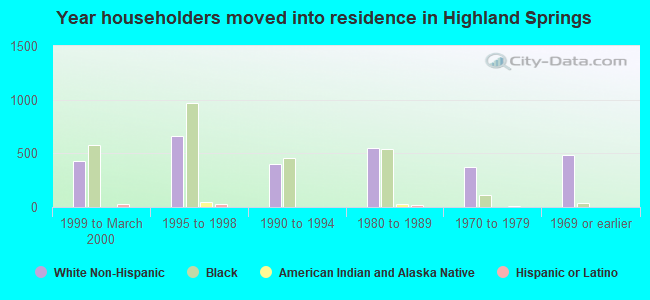
House/condo owner moved in on average 18 years ago
Renter moved in on average 6 years ago
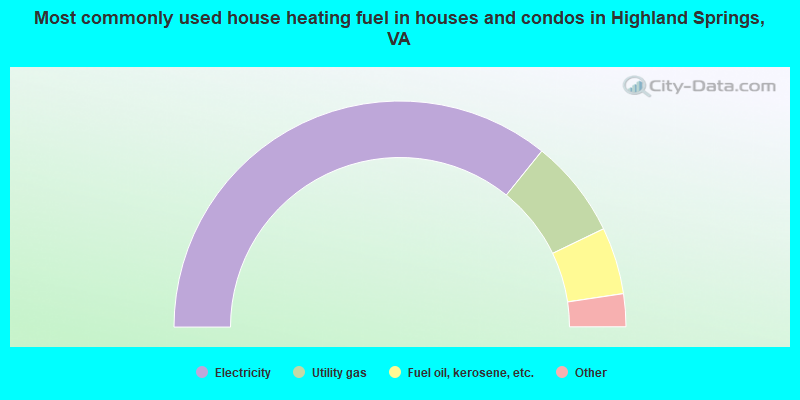
- 71.6%Electricity
- 14.1%Utility gas
- 9.6%Fuel oil, kerosene, etc.
- 2.6%No fuel used
- 1.4%Bottled, tank, or LP gas
- 0.3%Wood
- 0.3%Other fuel
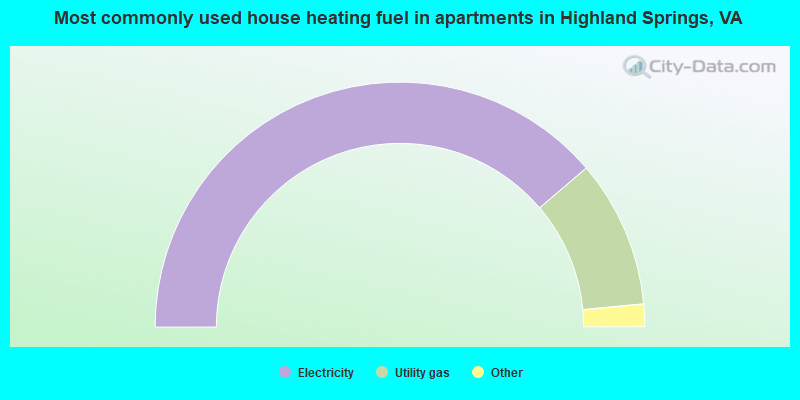
- 77.6%Electricity
- 19.5%Utility gas
- 1.9%Bottled, tank, or LP gas
- 1.1%Fuel oil, kerosene, etc.
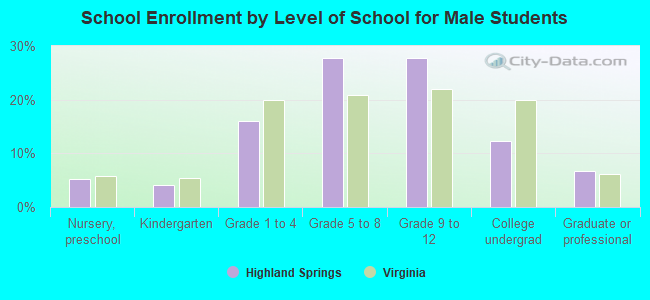
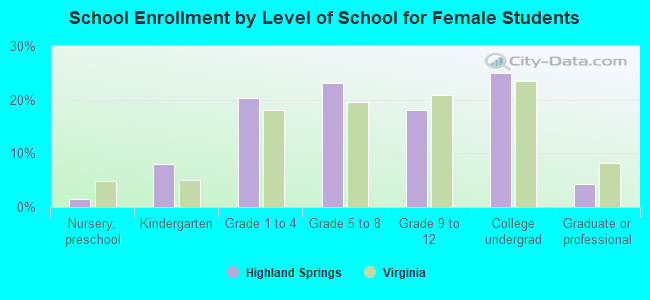
Private vs. public school enrollment:
| Here: | 4.3% |
| Virginia: | 13.2% |
| Here: | 11.1% |
| Virginia: | 10.2% |
| Here: | 14.4% |
| Virginia: | 18.7% |