Highland, UT (Utah) Houses and Residents
| Highland: | $924,470 |
| Utah: | $499,500 |
Mean price in 2022:
Detached houses: $939,800
Here: $939,800 State: $607,750 Townhouses or other attached units: $1,122,715
Here: $1,122,715 State: $444,505
Total population: 17,456 (Urban population: 7,731, Rural population: 235 (all nonfarm))
Houses: 5,364 (5,016 occupied: 4,579 owner occupied, 447 renter occupied)
| % of renters here: | 9% |
| State: | 29% |
Housing density: 771 houses/condos per square mile
Median price asked for vacant for-sale houses and condos in 2022: $1,620,462.
Median contract rent in 2022: over $2,000 (lower quartile is $959, upper quartile is over $2,000)
Median rent asked for vacant for-rent units in 2022: $4,172
Median gross rent in Highland, UT in 2022: over $2,000
Housing units in Highland with a mortgage: 3,339 (639 second mortgage, 12 home equity loan, 642 both second mortgage and home equity loan)
Houses without a mortgage: 94
Median household income for houses/condos with a mortgage: $180,169
Median household income for apartments without a mortgage: $130,418
Median monthly housing costs: $2,260
Compare current foreclosures near Highland, UT:
| Photo | Address | Area | Beds / Baths | Price | Details |
|---|---|---|---|---|---|

|
#1
Mankato St
Herriman, UT 84096
|
1,468 sq. feet
|
2 baths 3 beds |
show details | |

|
#2
W Aspen Springs Dr
Herriman, UT 84096
|
1,334 sq. feet
|
2 baths 2 beds |
show details | |

|
#3
Ashley Ridge Rd
Sandy, UT 84092
|
2,661 sq. feet
|
2 baths 6 beds |
show details | |

|
#4
W Alta View Way
Sandy, UT 84070
|
1,440 sq. feet
|
2 baths 3 beds |
show details | |

|
#5
N Pasture View Rd
Eagle Mountain, UT 84005
|
2,372 sq. feet
|
3 baths 3 beds |
show details | |

|
#6
S Meadowlark Ln
West Jordan, UT 84088
|
1,748 sq. feet
|
2 baths 3 beds |
show details | |

|
#7
W 6785 S
West Jordan, UT 84084
|
1,516 sq. feet
|
3 baths 4 beds |
show details | |

|
#8
500 N
Orem, UT 84059
|
2,635 sq. feet
|
2 baths 4 beds |
show details | |

|
#9
S 1980 W
Riverton, UT 84065
|
1,348 sq. feet
|
1 baths 4 beds |
show details | |

|
#10
S 400 E
Orem, UT 84097
|
2,950 sq. feet
|
4 baths 6 beds |
show details |
| Photo | Address | Area | Beds / Baths | Price | Details |
|---|---|---|---|---|---|

|
#11
W Spruce Leaf Cir
South Jordan, UT 84095
|
2,634 sq. feet
|
2 baths 4 beds |
show details | |

|
#12
S 400 W
Orem, UT 84058
|
2,652 sq. feet
|
2 baths 2 beds |
show details | |

|
#13
W River Hills Dr
Riverton, UT 84065
|
3,080 sq. feet
|
2 baths 5 beds |
show details | |

|
#14
Long Ridge Dr
Herriman, UT 84096
|
2,307 sq. feet
|
2 baths 3 beds |
show details | |

|
#15
S 455 E
Sandy, UT 84070
|
1,590 sq. feet
|
1 baths 2 beds |
show details | |

|
#16
E Kennekuk Cir
Eagle Mountain, UT 84005
|
2,022 sq. feet
|
2 baths 4 beds |
show details | |

|
#17
S Roseboro Rd
Sandy, UT 84092
|
2,171 sq. feet
|
2 baths 3 beds |
show details | |

|
#18
E Stone Mountain Ln
Sandy, UT 84092
|
6,300 sq. feet
|
5 baths 6 beds |
show details | |

|
#19
N Kiowa Pkwy
Eagle Mountain, UT 84005
|
1,386 sq. feet
|
2 baths 3 beds |
show details | |

|
#20
E Sego Lily Dr
Sandy, UT 84092
|
2,582 sq. feet
|
2 baths 4 beds |
show details |
| Photo | Address | Area | Beds / Baths | Price | Details |
|---|---|---|---|---|---|

|
#21
E Blackhawk Rd
Eagle Mountain, UT 84005
|
2,180 sq. feet
|
3 baths 3 beds |
show details | |

|
#22
W 10180 N
American Fork, UT 84003
|
2,478 sq. feet
|
2 baths 3 beds |
show details | |

|
#23
E Glacier View Dr
Sandy, UT 84092
|
3,139 sq. feet
|
4 baths 5 beds |
show details | |

|
#24
E 10260 S
Sandy, UT 84092
|
3,086 sq. feet
|
3 baths 5 beds |
show details | |

|
#25
Clark St
Eagle Mountain, UT 84005
|
1,691 sq. feet
|
2 baths 3 beds |
show details | |

|
#26
S 240 E
Orem, UT 84058
|
2,650 sq. feet
|
3 baths 5 beds |
show details | |

|
#27
E Ashley Mesa Ln
Sandy, UT 84092
|
3,306 sq. feet
|
3 baths 5 beds |
show details | |

|
#28
S 930 E
Sandy, UT 84094
|
2,460 sq. feet
|
4 baths 6 beds |
show details | |

|
#29
S 1830 W
Riverton, UT 84065
|
2,070 sq. feet
|
2 baths 4 beds |
show details | |

|
#30
E Nairn Dr
Eagle Mountain, UT 84005
|
1,356 sq. feet
|
2 baths 3 beds |
show details |
| Photo | Address | Area | Beds / Baths | Price | Details |
|---|---|---|---|---|---|

|
#31
N 700 E
Orem, UT 84097
|
2,585 sq. feet
|
4 baths 5 beds |
show details | |

|
#32
S 2480 W
Riverton, UT 84065
|
2,504 sq. feet
|
3 baths 5 beds |
show details | |

|
#33
S 2700 W # South
West Jordan, UT 84088
|
2,936 sq. feet
|
5 baths 6 beds |
show details | |

|
#34
Plum Creek Cir
West Jordan, UT 84088
|
2,197 sq. feet
|
3 baths 5 beds |
show details | |

|
#35
Westwood Dr
Orem, UT 84097
|
2,288 sq. feet
|
3 baths 5 beds |
show details | |

|
#36
Heyward Ct
Eagle Mountain, UT 84005
|
1,472 sq. feet
|
2 baths 3 beds |
show details | |

|
#37
S Carrington St
Sandy, UT 84094
|
1,915 sq. feet
|
3 baths 4 beds |
show details | |

|
#38
E Sego Lily Dr
Sandy, UT 84092
|
2,951 sq. feet
|
4 baths 3 beds |
show details | |

|
#39
Geronimo Dr
Eagle Mountain, UT 84005
|
1,565 sq. feet
|
1 baths 2 beds |
show details | |

|
#40
Windhover Rd
Eagle Mountain, UT 84005
|
1,646 sq. feet
|
2 baths 3 beds |
show details |
| Photo | Address | Area | Beds / Baths | Price | Details |
|---|---|---|---|---|---|

|
#41
S Countrywood Dr
Sandy, UT 84092
|
1,800 sq. feet
|
2 baths 4 beds |
show details | |

|
#42
E Geranium St
Sandy, UT 84094
|
1,114 sq. feet
|
1 baths 3 beds |
show details | |

|
#43
E Fort Union Blvd
Salt Lake City, UT 84121
|
4,020 sq. feet
|
3 baths 6 beds |
show details | |

|
#44
S Cadbury Dr
South Jordan, UT 84095
|
1,857 sq. feet
|
2 baths 3 beds |
show details | |

|
#45
S Greendale Rd
Salt Lake City, UT 84121
|
2,872 sq. feet
|
4 baths 5 beds |
show details | |

|
#46
N Sunset Dr
Eagle Mountain, UT 84005
|
2,522 sq. feet
|
2 baths 4 beds |
show details | |

|
#47
S Weeping Willow Dr
Sandy, UT 84070
|
2,446 sq. feet
|
4 baths 6 beds |
show details | |

|
#48
S 150 E
Orem, UT 84058
|
1,750 sq. feet
|
2 baths 3 beds |
show details | |

|
#49
W 12120 S
Riverton, UT 84065
|
1,572 sq. feet
|
2 baths 3 beds |
show details | |

|
Check over 1 million property listings on Foreclosure.com!
|
browse all offers | |||

Latest news about housing in Highland, UT collected exclusively by city-data.com from local newspapers, TV, and radio stations

 | Apartments in and around Salt Lake City (1 reply) |
| Nicest areas with apartments for a young professional? (10 replies) |
| Best apartments in SLC (14 replies) |
| Black in SLC (154 replies) |
| Moving; South SLC / Sugar house area. Thoughts? (8 replies) |
| Transfer from Atlanta to SLC (40 replies) |

Median year apartment built: 2014
Household type by relationship:
Households: 20,320- Male householders: 2,714 (103 living alone), Female householders: 2,143 (126 living alone)
4,067 spouses (4,062 opposite-sex spouses), 12 unmarried partners, (12 opposite-sex unmarried partners), 9,927 children (9,237 natural, 571 adopted, 118 stepchildren), 588 grandchildren, 50 brothers or sisters, 93 parents, 0 foster children, 467 other relatives, 240 non-relatives
- In group quarters: 13
Size of family households: 1,284 2-persons, 730 3-persons, 710 4-persons, 707 5-persons, 783 6-persons, 462 7-or-more-persons.
Size of nonfamily households: 247 1-person, 10 3-persons, 24 4-persons.
6,509 married couples with children.
530 single-parent households (200 men, 330 women).
94.8% of residents of Highland speak English at home.
1.9% of residents speak Spanish at home (81% speak English very well, 12% speak English well, 7% speak English not well).
0.9% of residents speak other Indo-European language at home (100% speak English very well).
1.5% of residents speak Asian or Pacific Island language at home (74% speak English very well, 16% speak English well, 9% speak English not well).
0.1% of residents speak other language at home (100% speak English very well).
Foreign born population: 429 (2.1%)
(55.2% of them are naturalized citizens)
| Here: | 9.9 |
| State: | 7.6 |
| Here: | 5.3 |
| State: | 4.3 |
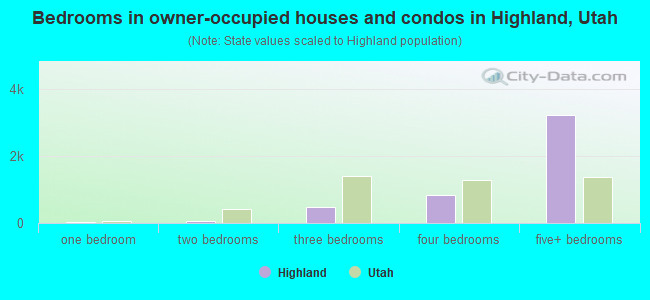
- Bedrooms in owner-occupied houses and condos in Highland, Utah
- 0no bedroom
- 211 bedroom
- 522 bedrooms
- 4633 bedrooms
- 8224 bedrooms
- 3,2225+ bedrooms
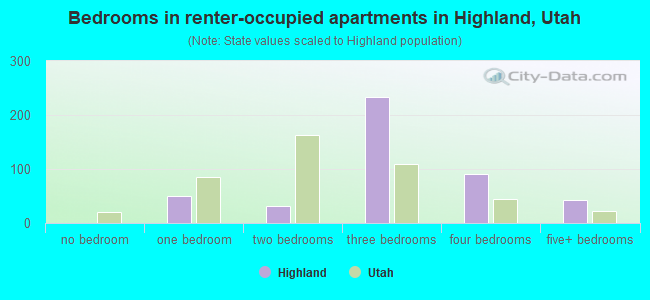
- Bedrooms in renter-occupied apartments in Highland, Utah
- 0no bedroom
- 501 bedroom
- 312 bedrooms
- 2343 bedrooms
- 914 bedrooms
- 435+ bedrooms
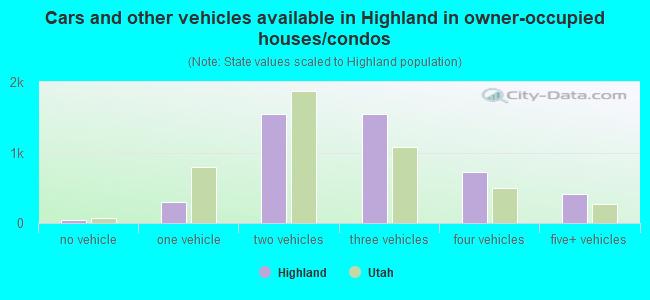
- Cars and other vehicles available in Highland in owner-occupied houses/condos
- 37no vehicle
- 2911 vehicle
- 1,5512 vehicles
- 1,5523 vehicles
- 7304 vehicles
- 4185+ vehicles
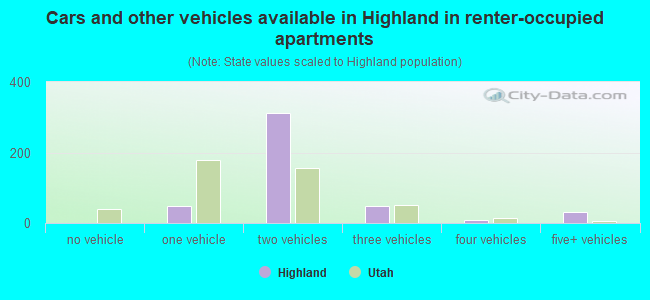
- Cars and other vehicles available in Highland in renter-occupied apartments
- 0no vehicle
- 471 vehicle
- 3132 vehicles
- 473 vehicles
- 94 vehicles
- 325+ vehicles
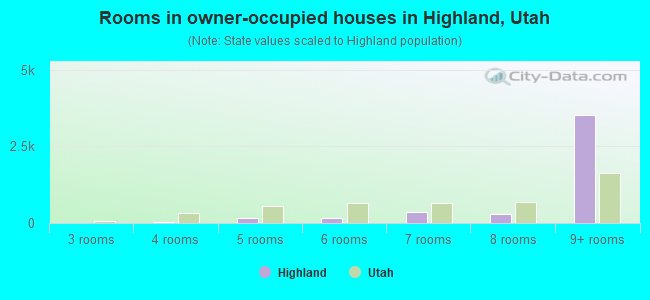
- Rooms in owner-occupied houses in Highland, Utah
- 01 room
- 02 rooms
- 133 rooms
- 404 rooms
- 1545 rooms
- 1666 rooms
- 3717 rooms
- 3088 rooms
- 3,5289+ rooms
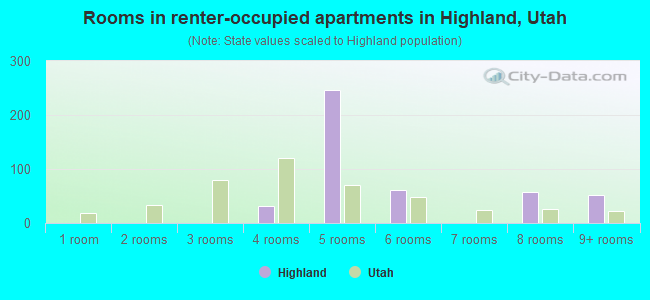
- Rooms in renter-occupied apartments in Highland, Utah
- 01 room
- 02 rooms
- 03 rooms
- 314 rooms
- 2475 rooms
- 616 rooms
- 07 rooms
- 588 rooms
- 519+ rooms
Highland, UT household income distribution

- 53Less than $10,000
- 50$10,000 to $19,999
- 23$20,000 to $29,999
- 79$30,000 to $39,999
- 119$40,000 to $49,999
- 137$50,000 to $59,999
- 302$60,000 to $74,999
- 381$75,000 to $99,999
- 496$100,000 to $124,999
- 486$125,000 to $149,999
- 1,131$150,000 to $199,999
- 1,987$200,000 or more
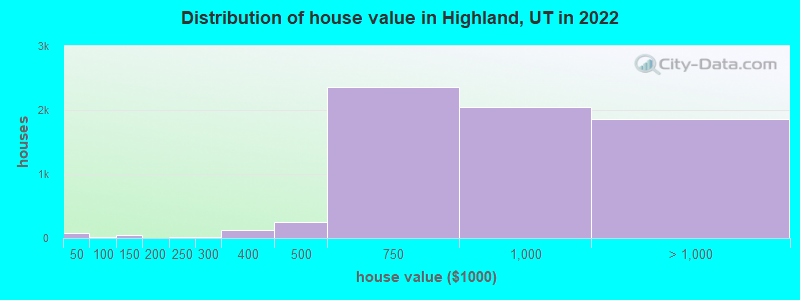
Home value of owner - occupied houses in 2022 in Highland, UT
-
- 48Less than $10,000
- 11$10,000 to $14,999
- 12$35,000 to $39,999
- 12$40,000 to $49,999
- 32$100,000 to $124,999
- 13$125,000 to $149,999
- 13$200,000 to $249,999
- 19$250,000 to $299,999
- 118$300,000 to $399,999
- 248$400,000 to $499,999
- 2,353$500,000 to $749,999
- 2,040$750,000 to $999,999
- 1,320$1,000,000 to $1,499,999
- 363$1,500,000 to $1,999,999
- 182$2,000,000 or more
Rent paid by renters in 2022 in Highland, UT
-
- 4$150 to $199
- 68$750 to $799
- 35$900 to $999
- 31$1,000 to $1,249
- 59$1,500 to $1,999
- 214$2,000 to $2,499
- 6$2,500 to $2,999
- 41$3,500 or more
- 46No cash rent
Percentage of workers working in this county: 76.0%
Number of people working at home: 2,413 (26.9% of all workers)
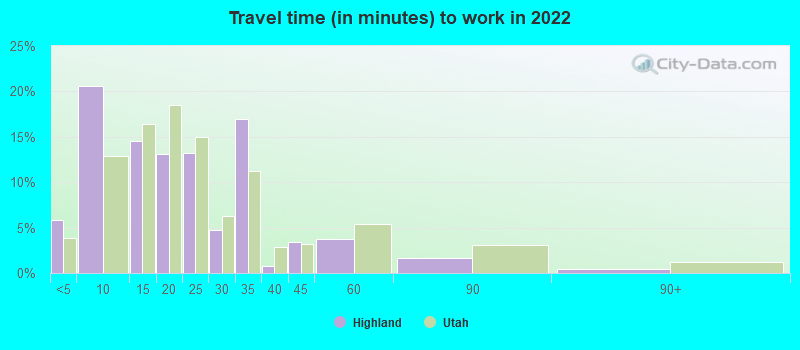
Travel time to work (commute)
- Less than 5 minutes: 187
- 5 to 9 minutes: 718
- 10 to 14 minutes: 1,120
- 15 to 19 minutes: 1,100
- 20 to 24 minutes: 771
- 25 to 29 minutes: 543
- 30 to 34 minutes: 978
- 35 to 39 minutes: 565
- 40 to 44 minutes: 268
- 45 to 59 minutes: 344
- 60 to 89 minutes: 143
- 90 or more minutes: 43
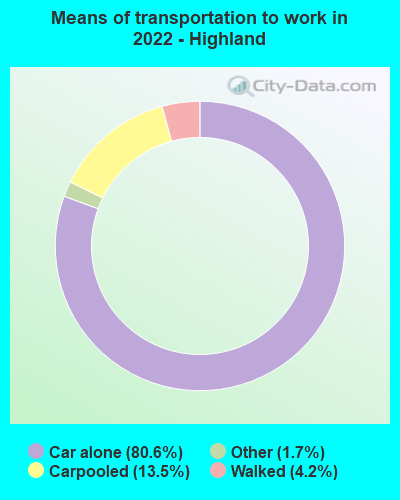
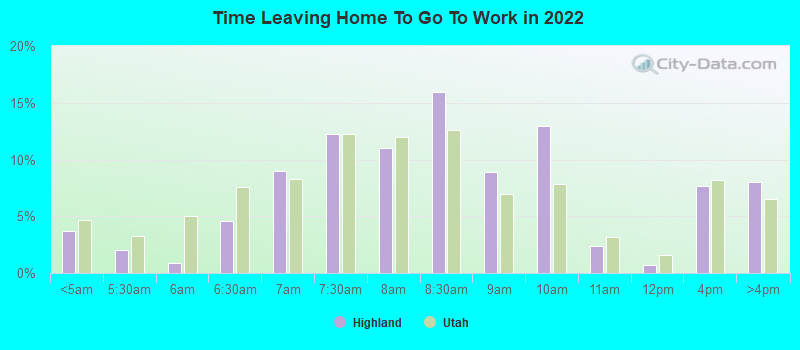
Means of transportation to work:
- Drove a car alone: 2,985 (51.9%)
- Carpooled: 494 (8.6%)
- Taxi: 65 (1.1%)
- Walked: 116 (2.0%)
- Worked at home: 2,413 (42.0%)
- Unemployment by race in 2022
- Unemployment rate for White non-Hispanic residents
- 1.7%Males
- 1.5%Females
- Unemployment rate for Black residents
- 22.1%Males
- Unemployment rate for two or more race residents
- 16.0%Females
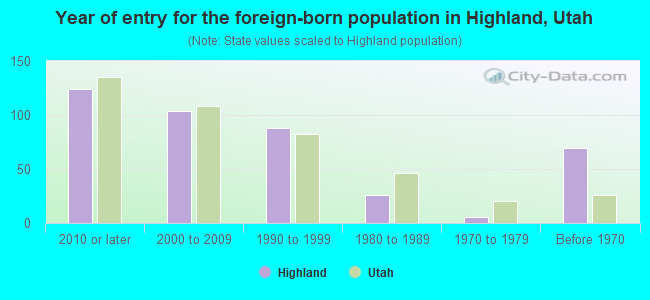
- Year of entry for the foreign-born population in Highland, Utah
- 1242010 or later
- 1042000 to 2009
- 881990 to 1999
- 261980 to 1989
- 61970 to 1979
- 69Before 1970
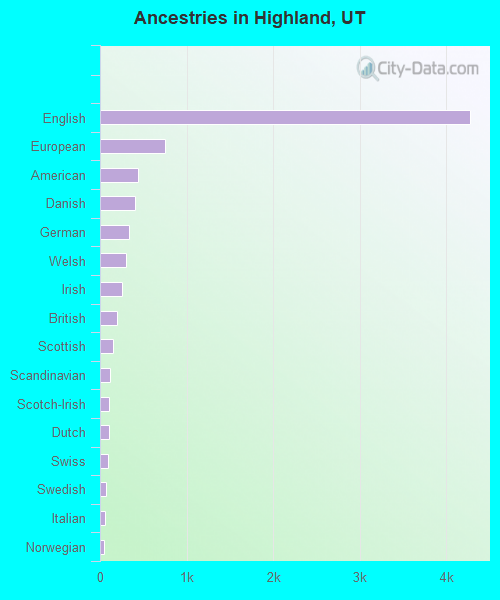
First ancestries reported:
- English: 4,280 (47.1%)
- European: 751 (8.3%)
- American: 441 (4.9%)
- Danish: 407 (4.5%)
- German: 335 (3.7%)
- Welsh: 295 (3.2%)
- Irish: 250 (2.8%)
- British: 202 (2.2%)
- Scottish: 151 (1.7%)
- Scandinavian: 113 (1.2%)
- Scotch-Irish: 103 (1.1%)
- Dutch: 101 (1.1%)
- Swiss: 96 (1.1%)
- Swedish: 74 (0.8%)
- Italian: 59 (0.6%)
- Norwegian: 49 (0.5%)
- Northern European: 33 (0.4%)
- Pennsylvania German: 23 (0.3%)
- Ukrainian: 16 (0.2%)
- French: 11 (0.1%)
- Finnish: 10 (0.1%)
- Slovak: 9 (0.10%)
- Romanian: 7 (0.08%)
- Brazilian: 6 (0.07%)
- Czechoslovakian: 4 (0.04%)
Most common places of birth for foreign-born residents (%):
| Highland: | 14.5% (58) |
| Utah: | 3.0% (8,341) |
| Highland: | 8.5% (34) |
| Utah: | 2.9% (8,017) |
| Highland: | 8.3% (33) |
| Utah: | 2.0% (5,555) |
| Highland: | 6.8% (27) |
| Utah: | 1.6% (4,524) |
| Highland: | 6.5% (26) |
| Utah: | 36.1% (99,740) |
| Highland: | 5.8% (23) |
| Utah: | 2.7% (7,472) |
| Highland: | 5.5% (22) |
| Utah: | 1.3% (3,570) |
| Highland: | 5.5% (22) |
| Utah: | 2.8% (7,644) |
| Highland: | 4.8% (19) |
| Utah: | 0.1% (241) |
| Highland: | 4.5% (18) |
| Utah: | 0.6% (1,555) |
| Highland: | 4.0% (16) |
| Utah: | 1.5% (4,247) |
| Highland: | 4.0% (16) |
| Utah: | 0.5% (1,269) |
| Highland: | 3.3% (13) |
| Utah: | 1.1% (2,900) |
| Highland: | 2.8% (11) |
| Utah: | 0.2% (570) |
| Highland: | 2.3% (9) |
| Utah: | 0.7% (2,014) |
| Highland: | 2.3% (9) |
| Utah: | 0.4% (1,021) |
| Highland: | 1.5% (6) |
| Utah: | 0.7% (1,949) |
| Highland: | 1.5% (6) |
| Utah: | 0.2% (634) |
| Highland: | 1.5% (6) |
| Utah: | 0.9% (2,365) |
Place of birth for U.S.-born residents:
- This state: 11,727
- Other state: 7,927
- Northeast: 427
- Midwest: 990
- South: 1,312
- West: 5,196
90.5% of Highland residents lived in the same house 1 years ago.
Out of people who lived in different houses, 35.6% lived in this county.
Out of people who lived in different counties, 32.3% lived in Utah.
| Highland: | 90.5% |
| State average: | 85.7% |
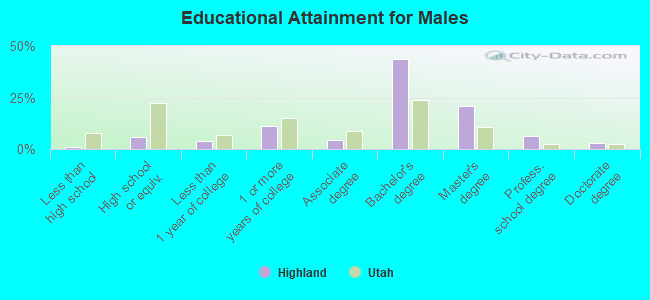
Education attainment for males 25 years and older:
- No schooling: 0
- Nursery to 4th grade: 0
- 5th and 6th grade: 0
- 7th and 8th grade: 0
- 9th grade: 0
- 10th grade: 0
- 11th grade: 10
- 12th grade, no diploma: 37
- High school graduate (or equivalency): 301
- Less than 1 year of college: 210
- Some college more than 1 year, no degree: 576
- Associate degree: 220
- Bachelor's degree: 2,283
- Master's degree: 1,080
- Professional school degree: 333
- Doctorate degree: 163
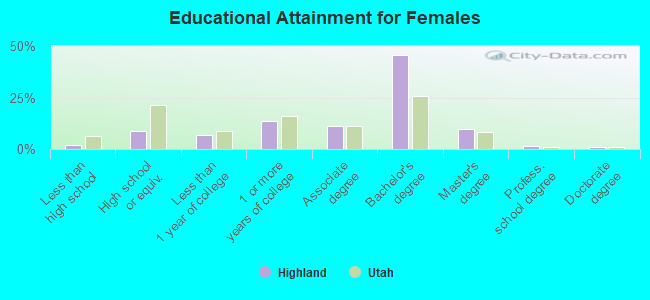
Education attainment for females 25 years and older:
- No schooling: 46
- Nursery to 4th grade: 0
- 5th and 6th grade: 0
- 7th and 8th grade: 0
- 9th grade: 0
- 10th grade: 15
- 11th grade: 8
- 12th grade, no diploma: 27
- High school graduate (or equivalency): 448
- Less than 1 year of college: 345
- Some college more than 1 year, no degree: 701
- Associate degree: 570
- Bachelor's degree: 2,346
- Master's degree: 498
- Professional school degree: 74
- Doctorate degree: 46


Housing units in structures:
- One, detached: 4,767
- One, attached: 421
- Two: 55
- 3 or 4: 108
- Mobile homes: 10
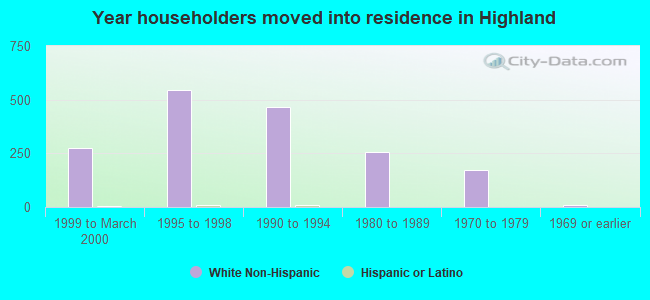
House/condo owner moved in on average 9 years ago
Renter moved in on average 0 years ago
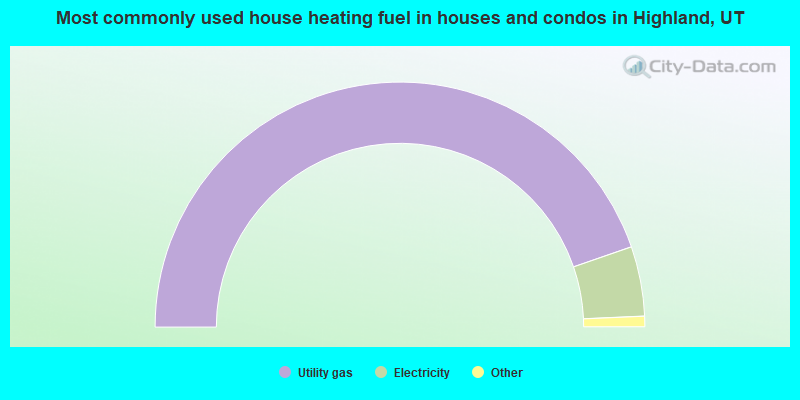
- 89.5%Utility gas
- 9.2%Electricity
- 0.7%Solar energy
- 0.4%Bottled, tank, or LP gas
- 0.2%Wood
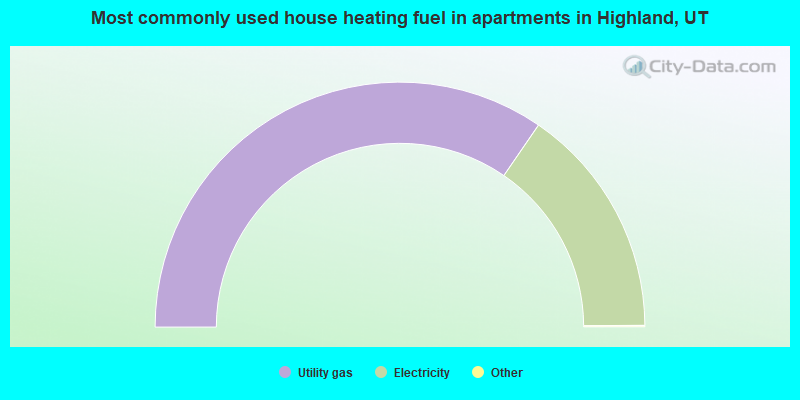
- 69.3%Utility gas
- 30.7%Electricity
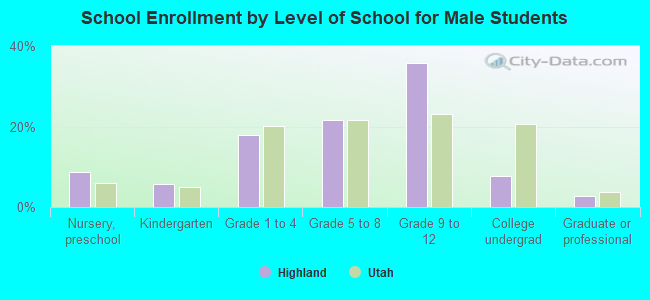
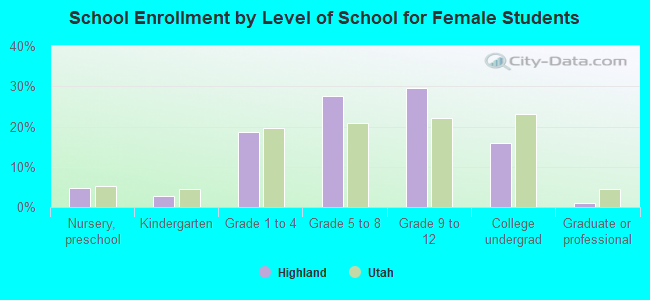
Private vs. public school enrollment:
| Here: | 13.2% |
| Utah: | 7.2% |
| Here: | 5.9% |
| Utah: | 5.3% |
| Here: | 25.5% |
| Utah: | 26.7% |