Highlands, NJ (New Jersey) Houses and Residents
| Highlands: | $440,070 |
| New Jersey: | $428,900 |
Total population: 4,926 (All urban)
Houses: 2,940 (2,528 occupied: 1,722 owner occupied, 849 renter occupied)
| % of renters here: | 33% |
| State: | 35% |
Housing density: 3,858 houses/condos per square mile
Median price asked for vacant for-sale houses and condos in 2022 in this county: $430,351.
Median contract rent in 2022: $1,485 (lower quartile is $1,038, upper quartile is $1,923)
Median rent asked for vacant for-rent units in 2022: $2,361
Median gross rent in Highlands, NJ in 2022: $1,701
Housing units in Highlands with a mortgage: 850 (128 second mortgage, 0 home equity loan, 108 both second mortgage and home equity loan)
Houses without a mortgage: 6
Median household income for houses/condos with a mortgage: $149,152
Median household income for apartments without a mortgage: $87,577
Median monthly housing costs: $1,671
Compare current foreclosures near Highlands, NJ:
| Photo | Address | Area | Beds / Baths | Price | Details |
|---|---|---|---|---|---|

|
#1
Cornwall St
Highlands, NJ 07732
|
3,311 sq. feet
|
- baths - beds |
show details | |

|
#2
W Twin Rd
Highlands, NJ 07732
|
5,790 sq. feet
|
- baths - beds |
show details | |

|
#3
S Bay Ave Apt 2
Highlands, NJ 07732
|
- sq. feet
|
- baths - beds |
show details | |

|
#4
4th St
Highlands, NJ 07732
|
1,095 sq. feet
|
- baths - beds |
show details | |

|
#5
Seadrift Ave
Highlands, NJ 07732
|
1,563 sq. feet
|
- baths - beds |
show details | |

|
#6
Gravelly Point Rd
Highlands, NJ 07732
|
1,224 sq. feet
|
- baths - beds |
show details | |

|
#7
Bay Ave
Highlands, NJ 07732
|
- sq. feet
|
- baths - beds |
show details | |

|
#8
Portland Rd Apt E-23
Highlands, NJ 07732
|
- sq. feet
|
- baths - beds |
show details | |

|
#9
Bay 19th St
Brooklyn, NY 11214
|
880 sq. feet
|
1 baths 2 beds |
$425,000
|
show details |

|
#10
Catherine St
South Amboy, NJ 08879
|
2,266 sq. feet
|
3 baths 4 beds |
$351,900
|
show details |
| Photo | Address | Area | Beds / Baths | Price | Details |
|---|---|---|---|---|---|

|
#11
Glenwood Rd Apt
Brooklyn, NY 11210
|
670 sq. feet
|
1 baths 1 beds |
$214,500
|
show details |

|
#12
E 32nd St Apt C7
Brooklyn, NY 11210
|
670 sq. feet
|
1 baths 1 beds |
$299,900
|
show details |

|
#13
Russell St # G
Staten Island, NY 10308
|
642 sq. feet
|
1 baths 1 beds |
$185,000
|
show details |

|
#14
Henry St
Keyport, NJ 07735
|
800 sq. feet
|
1 baths 2 beds |
$219,350
|
show details |

|
#15
Warren Street
Keyport, NJ 07735
|
2,889 sq. feet
|
2 baths 7 beds |
$459,900
|
show details |

|
#16
Richmond Rd
Staten Island, NY 10304
|
- sq. feet
|
1 baths 3 beds |
$571,000
|
show details |

|
#17
Ocean Pkwy Apt 11k
Brooklyn, NY 11235
|
400 sq. feet
|
1 baths - beds |
$205,000
|
show details |

|
#18
E 34th St
Brooklyn, NY 11203
|
- sq. feet
|
1 baths 3 beds |
$464,900
|
show details |

|
#19
Crawford Street
Red Bank, NJ 07701
|
1,280 sq. feet
|
1 baths 2 beds |
show details | |

|
#20
-11 Spring St
Red Bank, NJ 07701
|
1,096 sq. feet
|
1 baths 2 beds |
show details |
| Photo | Address | Area | Beds / Baths | Price | Details |
|---|---|---|---|---|---|

|
#21
93rd St
Brooklyn, NY 11209
|
1,627 sq. feet
|
3 baths 6 beds |
show details | |

|
#22
Wilson Ave
Matawan, NJ 07747
|
1,464 sq. feet
|
2 baths 3 beds |
show details | |

|
#23
49th St Apt 3
Brooklyn, NY 11219
|
1,508 sq. feet
|
2 baths 4 beds |
show details | |

|
#24
E 59th St
Brooklyn, NY 11234
|
2,660 sq. feet
|
4 baths 6 beds |
show details | |

|
#25
Ovington Ave
Brooklyn, NY 11209
|
2,664 sq. feet
|
2 baths 6 beds |
show details | |

|
#26
Maurice Ave
Holmdel, NJ 07733
|
1,296 sq. feet
|
2 baths 3 beds |
show details | |

|
#27
E 73rd St # 58
Brooklyn, NY 11234
|
939 sq. feet
|
2 baths 2 beds |
show details | |

|
#28
Ocean Pkwy Apt 8c
Brooklyn, NY 11235
|
1,186 sq. feet
|
2 baths 2 beds |
show details | |

|
#29
Athens Ave
South Amboy, NJ 08879
|
1,790 sq. feet
|
2 baths 3 beds |
show details | |

|
#30
Main St
Middletown, NJ 07748
|
- sq. feet
|
1 baths 2 beds |
show details |
| Photo | Address | Area | Beds / Baths | Price | Details |
|---|---|---|---|---|---|

|
#31
Royce St
Brooklyn, NY 11234
|
3,750 sq. feet
|
5 baths 5 beds |
show details | |

|
#32
Clove Rd Apt Go
Staten Island, NY 10301
|
800 sq. feet
|
2 baths 2 beds |
show details | |

|
#33
Paerdegat 9th St
Brooklyn, NY 11236
|
2,375 sq. feet
|
4 baths 8 beds |
show details | |

|
#34
Dudley St
Long Branch, NJ 07740
|
1,668 sq. feet
|
1 baths 3 beds |
show details | |

|
#35
Paerdegat 2nd St
Brooklyn, NY 11236
|
3,013 sq. feet
|
5 baths 8 beds |
show details | |

|
#36
E 80th St Apt 178
Brooklyn, NY 11236
|
931 sq. feet
|
1 baths 2 beds |
show details | |

|
#37
E 54th St
Brooklyn, NY 11234
|
1,628 sq. feet
|
3 baths 4 beds |
show details | |

|
#38
Jupiter St
Middletown, NJ 07748
|
2,040 sq. feet
|
2 baths 4 beds |
show details | |

|
#39
Lewis St
Perth Amboy, NJ 08861
|
2,115 sq. feet
|
4 baths 5 beds |
show details | |

|
#40
Beach 61st St
Arverne, NY 11692
|
2,162 sq. feet
|
3 baths 5 beds |
show details |
| Photo | Address | Area | Beds / Baths | Price | Details |
|---|---|---|---|---|---|

|
#41
Clinton St
Staten Island, NY 10304
|
2,649 sq. feet
|
4 baths 6 beds |
show details | |

|
#42
Troy Ave
Brooklyn, NY 11234
|
1,408 sq. feet
|
1 baths 3 beds |
show details | |

|
#43
Beach 86th St
Far Rockaway, NY 11693
|
960 sq. feet
|
1 baths 3 beds |
show details | |

|
#44
6th Ave
Brooklyn, NY 11209
|
2,080 sq. feet
|
2 baths 4 beds |
show details | |

|
#45
Morningside Ave
Keyport, NJ 07735
|
1,228 sq. feet
|
2 baths 3 beds |
show details | |

|
#46
9th Ave
Neptune, NJ 07753
|
992 sq. feet
|
1 baths 2 beds |
show details | |

|
#47
Cheyenne St
Asbury Park, NJ 07712
|
1,840 sq. feet
|
2 baths 3 beds |
show details | |

|
#48
Lincoln Ave Apt 6j
Staten Island, NY 10306
|
1,137 sq. feet
|
2 baths 3 beds |
show details | |

|
#49
Netherwood Dr
Keyport, NJ 07735
|
876 sq. feet
|
1 baths 3 beds |
show details | |

|
Check over 1 million property listings on Foreclosure.com!
|
browse all offers | |||

Latest news about housing in Highlands, NJ collected exclusively by city-data.com from local newspapers, TV, and radio stations


Median year apartment built: 1965
Household type by relationship:
Households: 4,653- Male householders: 1,317 (701 living alone), Female householders: 1,201 (441 living alone)
928 spouses (829 opposite-sex spouses), 160 unmarried partners, (160 opposite-sex unmarried partners), 769 children (742 natural, 0 adopted, 27 stepchildren), 26 grandchildren, 121 brothers or sisters, 34 parents, 0 foster children, 83 other relatives, 12 non-relatives
Size of family households: 772 2-persons, 343 3-persons, 125 4-persons, 26 5-persons, 8 7-or-more-persons.
Size of nonfamily households: 1,139 1-person, 156 2-persons.
514 married couples with children.
55 single-parent households (35 men, 20 women).
90.4% of residents of Highlands speak English at home.
4.1% of residents speak Spanish at home (46% speak English very well, 54% speak English not well).
1.5% of residents speak other Indo-European language at home (82% speak English very well, 18% speak English well).
3.2% of residents speak Asian or Pacific Island language at home (66% speak English very well, 34% speak English not well).
0.3% of residents speak other language at home (64% speak English very well, 14% speak English well, 21% speak English not well).
Foreign born population: 660 (14.2%)
(51.8% of them are naturalized citizens)
| Here: | 5.2 |
| State: | 6.8 |
| Here: | 3.7 |
| State: | 3.9 |

- Bedrooms in owner-occupied houses and condos in Highlands, New Jersey
- 0no bedroom
- 2821 bedroom
- 6432 bedrooms
- 5353 bedrooms
- 1984 bedrooms
- 635+ bedrooms

- Bedrooms in renter-occupied apartments in Highlands, New Jersey
- 0no bedroom
- 4061 bedroom
- 2582 bedrooms
- 1623 bedrooms
- 254 bedrooms
- 05+ bedrooms

- Cars and other vehicles available in Highlands in owner-occupied houses/condos
- 28no vehicle
- 8251 vehicle
- 7092 vehicles
- 1313 vehicles
- 04 vehicles
- 305+ vehicles

- Cars and other vehicles available in Highlands in renter-occupied apartments
- 119no vehicle
- 3951 vehicle
- 3362 vehicles
- 03 vehicles
- 04 vehicles
- 05+ vehicles

- Rooms in owner-occupied houses in Highlands, New Jersey
- 01 room
- 02 rooms
- 1893 rooms
- 3964 rooms
- 3915 rooms
- 2746 rooms
- 2767 rooms
- 418 rooms
- 1559+ rooms

- Rooms in renter-occupied apartments in Highlands, New Jersey
- 01 room
- 412 rooms
- 3703 rooms
- 924 rooms
- 2225 rooms
- 436 rooms
- 777 rooms
- 58 rooms
- 09+ rooms


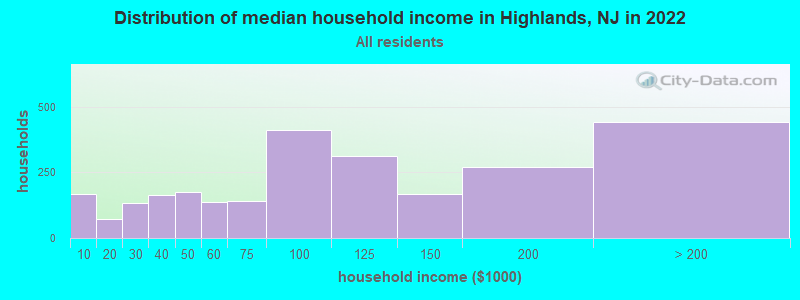
Highlands, NJ household income distribution

- 167Less than $10,000
- 73$10,000 to $19,999
- 132$20,000 to $29,999
- 165$30,000 to $39,999
- 177$40,000 to $49,999
- 136$50,000 to $59,999
- 141$60,000 to $74,999
- 410$75,000 to $99,999
- 311$100,000 to $124,999
- 166$125,000 to $149,999
- 272$150,000 to $199,999
- 442$200,000 or more
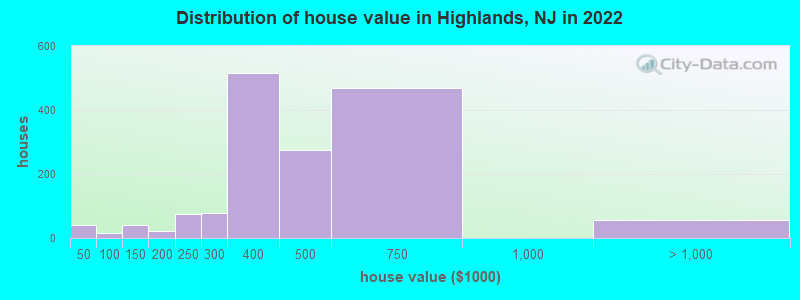
Home value of owner - occupied houses in 2022 in Highlands, NJ
-
- 5$15,000 to $19,999
- 35$30,000 to $34,999
- 16$80,000 to $89,999
- 22$100,000 to $124,999
- 17$125,000 to $149,999
- 14$150,000 to $174,999
- 6$175,000 to $199,999
- 73$200,000 to $249,999
- 79$250,000 to $299,999
- 517$300,000 to $399,999
- 275$400,000 to $499,999
- 467$500,000 to $749,999
- 56$1,000,000 to $1,499,999
Rent paid by renters in 2022 in Highlands, NJ
-
- 22$200 to $249
- 26$250 to $299
- 35$300 to $349
- 19$350 to $399
- 15$750 to $799
- 41$900 to $999
- 190$1,000 to $1,249
- 51$1,250 to $1,499
- 227$1,500 to $1,999
- 146$2,000 to $2,499
- 13$2,500 to $2,999
- 28No cash rent


Percentage of workers working in this county: 76.0%
Number of people working at home: 579 (23.3% of all workers)
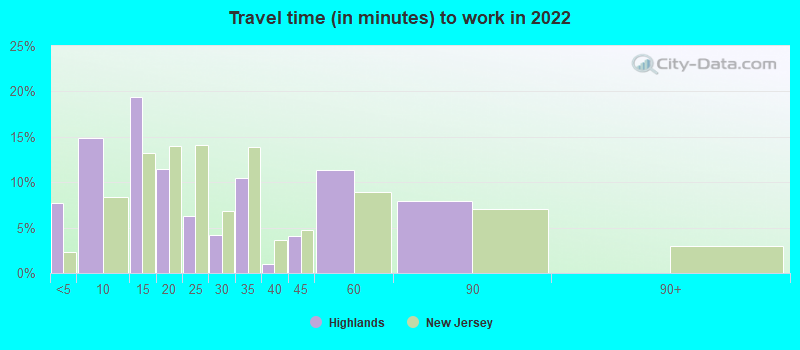
Travel time to work (commute)
- Less than 5 minutes: 102
- 5 to 9 minutes: 123
- 10 to 14 minutes: 129
- 15 to 19 minutes: 288
- 20 to 24 minutes: 187
- 25 to 29 minutes: 105
- 30 to 34 minutes: 258
- 35 to 39 minutes: 43
- 40 to 44 minutes: 78
- 45 to 59 minutes: 135
- 60 to 89 minutes: 284
- 90 or more minutes: 168
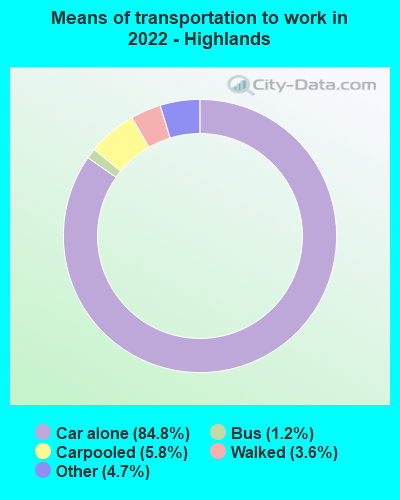
Means of transportation to work:
- Drove a car alone: 733 (52.5%)
- Carpooled: 59 (4.2%)
- Bus: 16 (1.1%)
- Taxi: 61 (4.4%)
- Walked: 47 (3.4%)
- Worked at home: 579 (41.5%)

- Unemployment by race in 2022
- Unemployment rate for White non-Hispanic residents
- 5.1%Males
- 2.6%Females
- Unemployment rate for Asian residents
- 12.9%Females

- Year of entry for the foreign-born population in Highlands, New Jersey
- 2562010 or later
- 432000 to 2009
- 1031990 to 1999
- 961980 to 1989
- 351970 to 1979
- 108Before 1970

First ancestries reported:
- Italian: 501 (28.8%)
- English: 195 (11.2%)
- French: 162 (9.3%)
- Irish: 144 (8.3%)
- German: 94 (5.4%)
- American: 90 (5.2%)
- European: 56 (3.2%)
- Russian: 46 (2.6%)
- Polish: 40 (2.3%)
- Scottish: 37 (2.1%)
- Brazilian: 27 (1.6%)
- Hungarian: 26 (1.5%)
- Swiss: 21 (1.2%)
- Lebanese: 20 (1.1%)
- Canadian: 17 (1.0%)
- Eastern European: 12 (0.7%)
- Ukrainian: 5 (0.3%)
Most common places of birth for foreign-born residents (%):
| Highlands: | 24.5% (161) |
| New Jersey: | 3.7% (78,969) |
| Highlands: | 18.5% (122) |
| New Jersey: | 0.3% (6,882) |
| Highlands: | 9.6% (63) |
| New Jersey: | 2.3% (48,885) |
| Highlands: | 5.9% (39) |
| New Jersey: | 0.9% (18,317) |
| Highlands: | 5.0% (33) |
| New Jersey: | 0.7% (15,644) |
| Highlands: | 5.0% (33) |
| New Jersey: | 0.1% (1,090) |
| Highlands: | 4.3% (28) |
| New Jersey: | 2.1% (46,020) |
| Highlands: | 3.8% (25) |
| New Jersey: | 0.5% (10,607) |
| Highlands: | 3.6% (24) |
| New Jersey: | 4.2% (90,817) |
| Highlands: | 3.0% (20) |
| New Jersey: | 0.8% (16,778) |
| Highlands: | 2.4% (16) |
| New Jersey: | 0.2% (4,324) |
| Highlands: | 2.3% (15) |
| New Jersey: | 0.6% (12,793) |
| Highlands: | 2.3% (15) |
| New Jersey: | 1.5% (33,198) |
| Highlands: | 2.1% (14) |
| New Jersey: | 0.3% (5,500) |
| Highlands: | 1.7% (11) |
| New Jersey: | 0.8% (17,217) |
Place of birth for U.S.-born residents:
- This state: 2,663
- Other state: 1,292
- Northeast: 1,073
- Midwest: 41
- South: 149
- West: 21
85.2% of Highlands residents lived in the same house 1 years ago.
Out of people who lived in different houses, 35.0% lived in this county.
Out of people who lived in different counties, 51.3% lived in New Jersey.
| Highlands: | 85.2% |
| State average: | 90.4% |
Education attainment for males 25 years and older:
- No schooling: 0
- Nursery to 4th grade: 0
- 5th and 6th grade: 0
- 7th and 8th grade: 22
- 9th grade: 0
- 10th grade: 0
- 11th grade: 12
- 12th grade, no diploma: 69
- High school graduate (or equivalency): 443
- Less than 1 year of college: 80
- Some college more than 1 year, no degree: 190
- Associate degree: 133
- Bachelor's degree: 583
- Master's degree: 474
- Professional school degree: 90
- Doctorate degree: 0

Education attainment for females 25 years and older:
- No schooling: 44
- Nursery to 4th grade: 0
- 5th and 6th grade: 0
- 7th and 8th grade: 0
- 9th grade: 0
- 10th grade: 46
- 11th grade: 0
- 12th grade, no diploma: 123
- High school graduate (or equivalency): 205
- Less than 1 year of college: 55
- Some college more than 1 year, no degree: 227
- Associate degree: 211
- Bachelor's degree: 529
- Master's degree: 289
- Professional school degree: 57
- Doctorate degree: 44


Housing units in structures:
- One, detached: 1,137
- One, attached: 221
- Two: 224
- 3 or 4: 228
- 5 to 9: 406
- 10 to 19: 231
- 20 to 49: 106
- 50 or more: 327
- Mobile homes: 58
House/condo owner moved in on average 8 years ago
Renter moved in on average 1 years ago

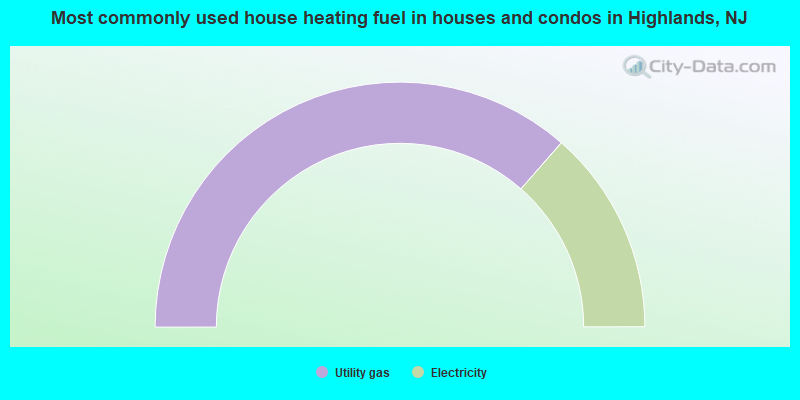
- 72.9%Utility gas
- 27.1%Electricity
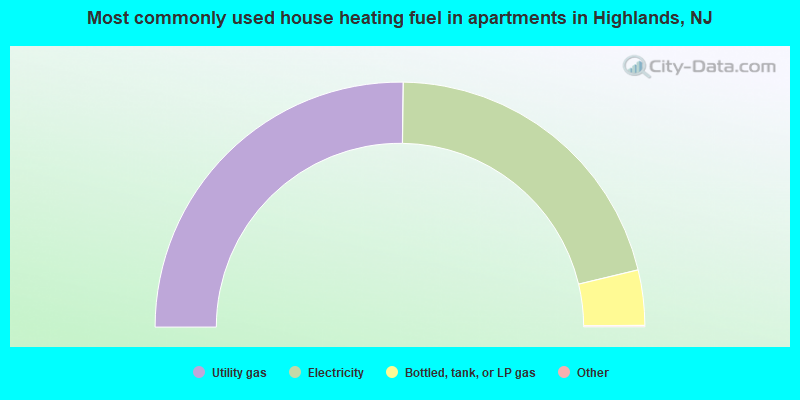
- 50.5%Utility gas
- 42.1%Electricity
- 7.3%Bottled, tank, or LP gas
Private vs. public school enrollment:
| Here: | 0.0% |
| New Jersey: | 12.3% |
| Here: | 0.0% |
| New Jersey: | 13.1% |
| Here: | 0.0% |
| New Jersey: | 33.2% |


