Hilham, TN (Tennessee) Houses and Residents
| Hilham: | $205,538 |
| Tennessee: | $284,800 |
Total population: 2,012 (Urban population: 0, Rural population: 1,956 (89 farm, 1,867 nonfarm))
Houses: 893 (790 occupied: 690 owner occupied, 100 renter occupied)
| % of renters here: | 13% |
| State: | 33% |
Housing density: 17 houses/condos per square mile
Median price asked for vacant for-sale houses and condos in 2022 in this county: $201,010.
Median contract rent in 2022: $560 (lower quartile is $547, upper quartile is $827)
Median rent asked for vacant for-rent units in 2022: $255
Median gross rent in Hilham, TN in 2022: $921
Housing units in Hilham with a mortgage: 101 (7 second mortgage, 0 home equity loan, 0 both second mortgage and home equity loan)
Houses without a mortgage: 174
Compare current foreclosures near Hilham, TN:
| Photo | Address | Area | Beds / Baths | Price | Details |
|---|---|---|---|---|---|

|
#1
Old Standing Stone Rd
Hilham, TN 38568
|
1,456 sq. feet
|
- baths - beds |
show details | |

|
#2
Nivens Ln
Hilham, TN 38568
|
- sq. feet
|
- baths - beds |
show details | |

|
#3
Turkeytown Rd
Hilham, TN 38568
|
- sq. feet
|
- baths - beds |
show details | |

|
#4
Rd
Hilham, TN 38568
|
- sq. feet
|
- baths - beds |
show details | |

|
#5
Spring Creek Rd
Cookeville, TN 38506
|
1,305 sq. feet
|
2 baths - beds |
show details | |

|
#6
E 13th St
Cookeville, TN 38501
|
1,473 sq. feet
|
1 baths - beds |
show details | |

|
#7
Webb Ave
Cookeville, TN 38506
|
1,040 sq. feet
|
2 baths - beds |
show details | |

|
#8
Hall Ln
Rickman, TN 38580
|
1,092 sq. feet
|
1 baths - beds |
show details | |

|
#9
Countess Trl
Cookeville, TN 38501
|
1,463 sq. feet
|
2 baths - beds |
show details | |

|
#10
Bilbrey Qualls Rd
Cookeville, TN 38506
|
1,560 sq. feet
|
1 baths - beds |
show details |
| Photo | Address | Area | Beds / Baths | Price | Details |
|---|---|---|---|---|---|

|
#11
Jake Dr
Cookeville, TN 38501
|
2,624 sq. feet
|
3 baths - beds |
show details | |

|
#12
Paran Rd
Cookeville, TN 38506
|
1,500 sq. feet
|
2 baths - beds |
show details | |

|
#13
Kyle Dr
Cookeville, TN 38501
|
1,684 sq. feet
|
2 baths - beds |
show details | |

|
#14
Paran Pointe Dr
Cookeville, TN 38506
|
1,755 sq. feet
|
2 baths - beds |
show details | |

|
#15
Shannon Dr
Cookeville, TN 38506
|
1,200 sq. feet
|
1 baths - beds |
show details | |

|
#16
Lacy Ln
Alpine, TN 38543
|
768 sq. feet
|
1 baths - beds |
show details | |

|
#17
Edwards Ln
Bloomington Springs, TN 38545
|
1,104 sq. feet
|
1 baths - beds |
show details | |

|
#18
Rickman Monterey Hwy
Rickman, TN 38580
|
1,080 sq. feet
|
1 baths - beds |
show details | |

|
#19
Mccoinsville Rd
Gainesboro, TN 38562
|
1,308 sq. feet
|
2 baths - beds |
show details | |

|
#20
Mcmillian St
Celina, TN 38551
|
1,028 sq. feet
|
1 baths - beds |
show details |
| Photo | Address | Area | Beds / Baths | Price | Details |
|---|---|---|---|---|---|

|
#21
Anderson Ln
Cookeville, TN 38501
|
1,763 sq. feet
|
2 baths - beds |
show details | |

|
#22
Jeremiah Rd
Cookeville, TN 38506
|
1,704 sq. feet
|
1 baths - beds |
show details | |

|
#23
Garrison Rd
Cookeville, TN 38501
|
1,184 sq. feet
|
1 baths - beds |
show details | |

|
#24
Mcclain Rd
Cookeville, TN 38501
|
1,436 sq. feet
|
2 baths - beds |
show details | |

|
#25
Ridgewood Rd
Cookeville, TN 38501
|
1,288 sq. feet
|
2 baths - beds |
show details | |

|
#26
Carthon Jones Ln
Gainesboro, TN 38562
|
1,520 sq. feet
|
2 baths - beds |
show details | |

|
#27
Brown Ln
Gainesboro, TN 38562
|
840 sq. feet
|
1 baths - beds |
show details | |

|
#28
Johnnie Bud Ln
Cookeville, TN 38501
|
1,344 sq. feet
|
2 baths - beds |
show details | |

|
#29
Dodson Branch Hwy
Cookeville, TN 38501
|
1,568 sq. feet
|
2 baths - beds |
show details | |

|
#30
Byrdstown Hwy
Livingston, TN 38570
|
1,603 sq. feet
|
1 baths - beds |
show details |
| Photo | Address | Area | Beds / Baths | Price | Details |
|---|---|---|---|---|---|

|
#31
Middleford Dr
Cookeville, TN 38506
|
1,334 sq. feet
|
2 baths - beds |
show details | |

|
#32
Gaw St
Cookeville, TN 38501
|
1,185 sq. feet
|
1 baths - beds |
show details | |

|
#33
E Stevens St
Cookeville, TN 38501
|
1,152 sq. feet
|
1 baths - beds |
show details | |

|
#34
Echo Valley Dr
Cookeville, TN 38501
|
1,624 sq. feet
|
2 baths - beds |
show details | |

|
#35
Thomas Rd
Livingston, TN 38570
|
1,232 sq. feet
|
1 baths - beds |
show details | |

|
#36
Hilham Hwy
Livingston, TN 38570
|
1,104 sq. feet
|
1 baths - beds |
show details | |

|
#37
Padgett Ln
Monroe, TN 38573
|
1,196 sq. feet
|
1 baths - beds |
show details | |

|
#38
Rockwell Dr
Cookeville, TN 38506
|
1,406 sq. feet
|
2 baths - beds |
show details | |

|
#39
Dogleg Dr
Livingston, TN 38570
|
1,456 sq. feet
|
2 baths - beds |
show details | |

|
#40
Bowers Rd
Livingston, TN 38570
|
480 sq. feet
|
2 baths - beds |
show details |
| Photo | Address | Area | Beds / Baths | Price | Details |
|---|---|---|---|---|---|

|
#41
Mcclellan Ct
Cookeville, TN 38501
|
1,536 sq. feet
|
1 baths - beds |
show details | |

|
#42
Hunter Ave
Cookeville, TN 38501
|
1,056 sq. feet
|
2 baths - beds |
show details | |

|
#43
Hidden Valley Rd
Livingston, TN 38570
|
960 sq. feet
|
1 baths - beds |
show details | |

|
#44
Myers St
Livingston, TN 38570
|
1,135 sq. feet
|
1 baths - beds |
show details | |

|
#45
Reeser St
Livingston, TN 38570
|
1,066 sq. feet
|
1 baths - beds |
show details | |

|
#46
Riley Creek Rd
Whitleyville, TN 38588
|
1,872 sq. feet
|
2 baths - beds |
show details | |

|
#47
Sugar Creek Rd
Gainesboro, TN 38562
|
2,040 sq. feet
|
1 baths - beds |
show details | |

|
#48
N Pine Hill Rd
Cookeville, TN 38501
|
936 sq. feet
|
1 baths - beds |
show details | |

|
#49
S Hillcrest Dr
Livingston, TN 38570
|
1,364 sq. feet
|
2 baths - beds |
show details | |

|
Check over 1 million property listings on Foreclosure.com!
|
browse all offers | |||

Household type by relationship:
Households: 21,797- In family households: 18,835 (4,668 male householders, 1,575 female householders)
4,834 spouses, 6,118 children (5,535 natural, 155 adopted, 428 stepchildren), 633 grandchildren, 122 brothers or sisters, 155 parents, foster children, 185 other relatives, 405 non-relatives
- In nonfamily households: 2,962 (1,171 male householders (990 living alone)), 1,406 female householders (1,278 living alone)), 385 nonrelatives
- In group quarters: 286 (268 institutionalized population)
3,299 married couples with children.
818 single-parent households (223 men, 595 women).
98.5% of residents of Hilham speak English at home.
0.5% of residents speak Spanish at home (100% speak English very well).
1.0% of residents speak other Indo-European language at home (33% speak English very well, 33% speak English well, 33% speak English not well).
Foreign born population: 12 (0.5%)
(125.0% of them are naturalized citizens)
| Here: | 6.3 |
| State: | 6.5 |
| Here: | 6.1 |
| State: | 4.4 |

- Bedrooms in owner-occupied houses and condos in Hilham, Tennessee
- 0no bedroom
- 351 bedroom
- 1492 bedrooms
- 3873 bedrooms
- 734 bedrooms
- 465+ bedrooms

- Bedrooms in renter-occupied apartments in Hilham, Tennessee
- 0no bedroom
- 141 bedroom
- 332 bedrooms
- 403 bedrooms
- 134 bedrooms
- 05+ bedrooms

- Cars and other vehicles available in Hilham in owner-occupied houses/condos
- 48no vehicle
- 1961 vehicle
- 2932 vehicles
- 1193 vehicles
- 264 vehicles
- 85+ vehicles

- Cars and other vehicles available in Hilham in renter-occupied apartments
- 0no vehicle
- 571 vehicle
- 372 vehicles
- 63 vehicles
- 04 vehicles
- 05+ vehicles

- Rooms in owner-occupied houses in Hilham, Tennessee
- 01 room
- 62 rooms
- 113 rooms
- 784 rooms
- 2595 rooms
- 1606 rooms
- 757 rooms
- 328 rooms
- 699+ rooms

- Rooms in renter-occupied apartments in Hilham, Tennessee
- 01 room
- 82 rooms
- 113 rooms
- 224 rooms
- 185 rooms
- 206 rooms
- 157 rooms
- 68 rooms
- 09+ rooms


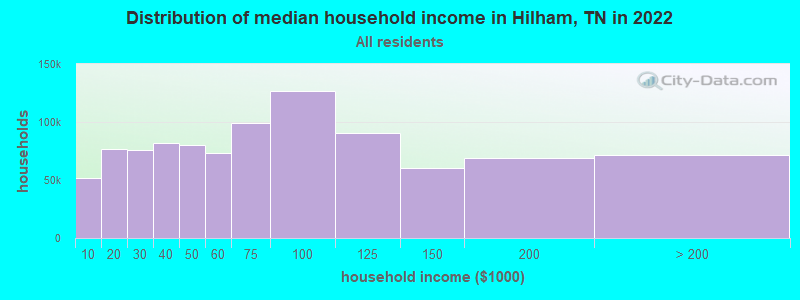
Hilham, TN household income distribution

- 34,466Less than $10,000
- 57,810$10,000 to $19,999
- 54,825$20,000 to $29,999
- 56,057$30,000 to $39,999
- 54,200$40,000 to $49,999
- 50,166$50,000 to $59,999
- 68,396$60,000 to $74,999
- 87,179$75,000 to $99,999
- 65,200$100,000 to $124,999
- 38,836$125,000 to $149,999
- 42,626$150,000 to $199,999
- 36,034$200,000 or more
Percentage of workers working in this county: 59.2%
Number of people working at home: 84 (9.8% of all workers)
Travel time to work (commute)
- Less than 5 minutes: 13
- 5 to 9 minutes: 46
- 10 to 14 minutes: 87
- 15 to 19 minutes: 167
- 20 to 24 minutes: 79
- 25 to 29 minutes: 59
- 30 to 34 minutes: 123
- 35 to 39 minutes: 29
- 40 to 44 minutes: 18
- 45 to 59 minutes: 37
- 60 to 89 minutes: 5
- 90 or more minutes: 61
Means of transportation to work:
- Drove a car alone: 604 (78.4%)
- Carpooled: 113 (14.7%)
- Other means: 7 (0.9%)
- Worked at home: 46 (6.0%)


- Year of entry for the foreign-born population in Hilham, Tennessee
- 01995 to March 2000
- 01990 to 1994
- 01985 to 1989
- 01980 to 1984
- 01975 to 1979
- 01970 to 1974
- 01965 to 1969
- 6Before 1965
Most common places of birth for foreign-born residents (%):
| Hilham: | 100.0% (6) |
| Tennessee: | 5.2% (8,316) |
Place of birth for U.S.-born residents:
- This state: 1,500
- Other state: 450
- Northeast: 110
- Midwest: 214
- South: 118
- West: 8
64% of Hilham residents lived in the same house 5 years ago.
Out of people who lived in different houses, 43% lived in this county.
Out of people who lived in different counties, 55% lived in Tennessee.
Education attainment for males 25 years and older:
- No schooling: 19
- Nursery to 4th grade: 35
- 5th and 6th grade: 41
- 7th and 8th grade: 95
- 9th grade: 37
- 10th grade: 5
- 11th grade: 19
- 12th grade, no diploma: 40
- High school graduate (or equivalency): 302
- Less than 1 year of college: 25
- Some college more than 1 year, no degree: 38
- Associate degree: 0
- Bachelor's degree: 42
- Master's degree: 0
- Professional school degree: 0
- Doctorate degree: 0

Education attainment for females 25 years and older:
- No schooling: 5
- Nursery to 4th grade: 21
- 5th and 6th grade: 30
- 7th and 8th grade: 108
- 9th grade: 44
- 10th grade: 46
- 11th grade: 33
- 12th grade, no diploma: 40
- High school graduate (or equivalency): 251
- Less than 1 year of college: 37
- Some college more than 1 year, no degree: 38
- Associate degree: 0
- Bachelor's degree: 10
- Master's degree: 7
- Professional school degree: 5
- Doctorate degree: 0


Housing units in structures:
- One, detached: 538
- One, attached: 13
- Mobile homes: 321
- Boats, RVs, vans, etc.: 21
Median worth of mobile homes: $109,936
Housing units lacking complete kitchen facilities: 4.6%

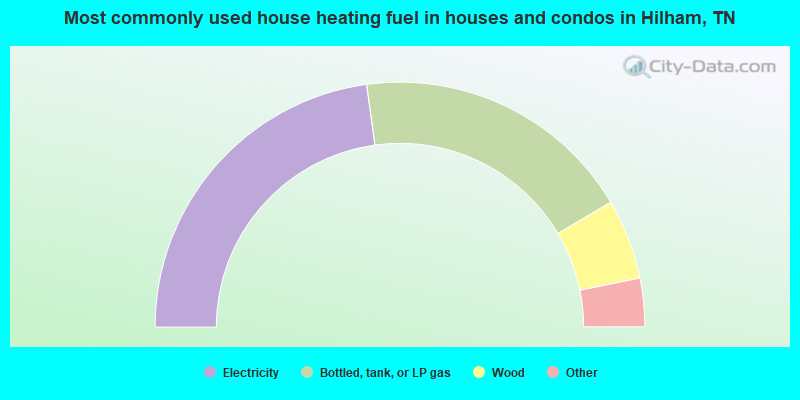
- 45.7%Electricity
- 37.4%Bottled, tank, or LP gas
- 10.6%Wood
- 2.6%Fuel oil, kerosene, etc.
- 2.0%Utility gas
- 1.7%Other fuel
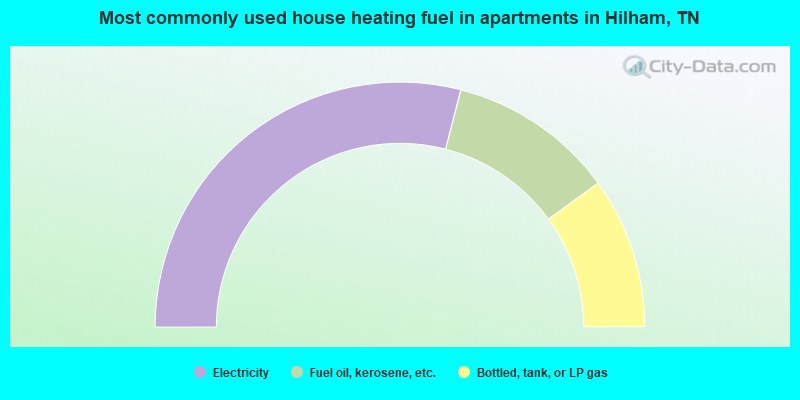
- 58.0%Electricity
- 22.0%Fuel oil, kerosene, etc.
- 20.0%Bottled, tank, or LP gas
Private vs. public school enrollment:
| Here: | 2.6% |
| Tennessee: | 9.5% |
| Here: | 0.0% |
| Tennessee: | 10.4% |
| Here: | 0.0% |
| Tennessee: | 22.8% |


