Hillcrest, IL (Illinois) Houses and Residents
| Hillcrest: | $154,790 |
| Illinois: | $251,600 |
Mean price in 2022:
Detached houses: $144,228
Here: $144,228 State: $310,164
Total population: 1,292 (Urban population: 1,170 (all inside urban clusters), Rural population: 0)
Houses: 574 (574 occupied: 494 owner occupied, 87 renter occupied)
| % of renters here: | 15% |
| State: | 33% |
Housing density: 1,031 houses/condos per square mile
Median price asked for vacant for-sale houses and condos in 2022 in this county: $112,424.
Median contract rent in 2022: $909 (lower quartile is $499, upper quartile is $967)
Median gross rent in Hillcrest, IL in 2022: $1,039
Housing units in Hillcrest with a mortgage: 324 (13 second mortgage, 0 home equity loan, 0 both second mortgage and home equity loan)
Houses without a mortgage: 0
Median household income for houses/condos with a mortgage: $88,385
Median household income for apartments without a mortgage: $96,020
Median monthly housing costs: $978
Compare current foreclosures near Hillcrest, IL:
| Photo | Address | Area | Beds / Baths | Price | Details |
|---|---|---|---|---|---|

|
#1
Leonard Ave
Dekalb, IL 60115
|
1,295 sq. feet
|
2 baths 3 beds |
$245,000
|
show details |

|
#2
N 15th St
Rochelle, IL 61068
|
- sq. feet
|
1 baths 3 beds |
show details | |

|
#3
Colleen Ave
Rockford, IL 61109
|
1,444 sq. feet
|
1 baths 3 beds |
show details | |

|
#4
S 2nd St
Oregon, IL 61061
|
- sq. feet
|
- baths - beds |
$43,900
|
show details |

|
#5
Phyllis Ave
Rochelle, IL 61068
|
1,056 sq. feet
|
1 baths 3 beds |
show details | |

|
#6
Tilton Park Dr
Dekalb, IL 60115
|
1,400 sq. feet
|
1 baths 3 beds |
show details | |

|
#7
W Maple St
Franklin Grove, IL 61031
|
- sq. feet
|
2 baths 6 beds |
show details | |

|
#8
Lewis St # 5
Dekalb, IL 60115
|
- sq. feet
|
- baths - beds |
show details | |

|
#9
Deerpath Ln E
Dekalb, IL 60115
|
- sq. feet
|
- baths - beds |
show details | |

|
#10
N Annie Glidden Rd Apt 225
Dekalb, IL 60115
|
- sq. feet
|
- baths - beds |
show details |
| Photo | Address | Area | Beds / Baths | Price | Details |
|---|---|---|---|---|---|

|
#11
Chestnut St
Dekalb, IL 60115
|
- sq. feet
|
- baths - beds |
show details | |

|
#12
W Main St
Kirkland, IL 60146
|
- sq. feet
|
- baths - beds |
show details | |

|
#13
Regent Dr Apt 102
Dekalb, IL 60115
|
- sq. feet
|
- baths - beds |
show details | |

|
#14
Regent Dr
Dekalb, IL 60115
|
- sq. feet
|
- baths - beds |
show details | |

|
#15
Fotis Dr # 7
Dekalb, IL 60115
|
- sq. feet
|
- baths - beds |
show details | |

|
#16
Williams Way
Dekalb, IL 60115
|
- sq. feet
|
- baths - beds |
show details | |

|
#17
Eves Cir E
Dekalb, IL 60115
|
- sq. feet
|
- baths - beds |
show details | |

|
#18
E 3rd St
Byron, IL 61010
|
- sq. feet
|
- baths - beds |
show details | |

|
#19
Aspen Ct, Apt 3
Dekalb, IL 60115
|
- sq. feet
|
- baths - beds |
show details | |

|
#20
Eves Cir W
Dekalb, IL 60115
|
- sq. feet
|
- baths - beds |
show details |
| Photo | Address | Area | Beds / Baths | Price | Details |
|---|---|---|---|---|---|

|
#21
Maple Ln
Dixon, IL 61021
|
- sq. feet
|
- baths - beds |
show details | |

|
#22
S 6th St
Kirkland, IL 60146
|
- sq. feet
|
- baths - beds |
show details | |

|
#23
Ridge Dr Apt 4
Dekalb, IL 60115
|
- sq. feet
|
- baths - beds |
show details | |

|
#24
Ridge Dr Apt 705
Dekalb, IL 60115
|
- sq. feet
|
- baths - beds |
show details | |

|
#25
Luther Dr Apt 4
Byron, IL 61010
|
- sq. feet
|
- baths - beds |
show details | |

|
#26
Creekside Dr
Byron, IL 61010
|
- sq. feet
|
- baths - beds |
show details | |

|
#27
N 1st St Apt 3
Dekalb, IL 60115
|
- sq. feet
|
- baths - beds |
show details | |

|
#28
Fairview Dr
Dekalb, IL 60115
|
- sq. feet
|
- baths - beds |
show details | |

|
#29
E Lincoln Hwy # 100
Dekalb, IL 60115
|
- sq. feet
|
- baths - beds |
show details | |

|
#30
42nd St
Rockford, IL 61109
|
- sq. feet
|
- baths - beds |
show details |
| Photo | Address | Area | Beds / Baths | Price | Details |
|---|---|---|---|---|---|

|
#31
Linden Pl
Dekalb, IL 60115
|
- sq. feet
|
- baths - beds |
show details | |

|
#32
W Garden St
Dekalb, IL 60115
|
- sq. feet
|
- baths - beds |
show details | |

|
#33
Green Tree Ln
Dekalb, IL 60115
|
- sq. feet
|
- baths - beds |
show details | |

|
#34
Kimberly Dr Apt 111
Dekalb, IL 60115
|
- sq. feet
|
- baths - beds |
show details | |

|
#35
Gurler St
Dekalb, IL 60115
|
- sq. feet
|
- baths - beds |
show details | |

|
#36
Minnesota Dr
Dixon, IL 61021
|
- sq. feet
|
- baths - beds |
show details | |

|
#37
W Hillcrest Dr
Dekalb, IL 60115
|
- sq. feet
|
- baths - beds |
show details | |

|
#38
W 3rd St
Byron, IL 61010
|
- sq. feet
|
- baths - beds |
show details | |

|
#39
E 5th St Apt 1
Byron, IL 61010
|
- sq. feet
|
- baths - beds |
show details | |

|
#40
Normal Rd Apt 2
Dekalb, IL 60115
|
- sq. feet
|
- baths - beds |
show details |
| Photo | Address | Area | Beds / Baths | Price | Details |
|---|---|---|---|---|---|

|
#41
S State St
Franklin Grove, IL 61031
|
- sq. feet
|
- baths - beds |
show details | |

|
#42
N 5th St
Oregon, IL 61061
|
- sq. feet
|
- baths - beds |
show details | |

|
#43
Eco Park Dr # 9
Dekalb, IL 60115
|
- sq. feet
|
- baths - beds |
show details | |

|
#44
W Lincoln St
Stillman Valley, IL 61084
|
- sq. feet
|
- baths - beds |
show details | |

|
#45
N 15th St
Rochelle, IL 61068
|
- sq. feet
|
- baths - beds |
show details | |

|
#46
Northwestern Ave
Davis Junction, IL 61020
|
- sq. feet
|
- baths - beds |
show details | |

|
#47
Dennis St
Rochelle, IL 61068
|
- sq. feet
|
- baths - beds |
show details | |

|
#48
N 5th St
Malta, IL 60150
|
- sq. feet
|
- baths - beds |
show details | |

|
#49
N 12th St
Rochelle, IL 61068
|
- sq. feet
|
- baths - beds |
show details | |

|
Check over 1 million property listings on Foreclosure.com!
|
browse all offers | |||

Latest news about housing in Hillcrest, IL collected exclusively by city-data.com from local newspapers, TV, and radio stations

 | Looking at a house in Wheaton (103 replies) |
| Western suburb recommendation for stay at home dad (78 replies) |
| Western Suburbs to Prioritize? (32 replies) |
| Naperville vs. Hinsdale (42 replies) |
| Downers Grove Schools (8 replies) |
| Where would YOU buy if your budget was: 300k, 400k, or 500k? (33 replies) |

Median year apartment built: 1985
Household type by relationship:
Households: 1,670- Male householders: 311 (92 living alone), Female householders: 252 (40 living alone)
256 spouses (256 opposite-sex spouses), 28 unmarried partners, (28 opposite-sex unmarried partners), 573 children (566 natural, 0 adopted, 6 stepchildren), 65 grandchildren, 3 brothers or sisters, 4 parents, 7 foster children, 19 other relatives, 146 non-relatives
Size of family households: 115 2-persons, 114 3-persons, 89 4-persons, 58 5-persons, 11 6-persons, 18 7-or-more-persons.
Size of nonfamily households: 140 1-person, 29 2-persons.
221 married couples with children.
103 single-parent households (22 men, 81 women).
72.0% of residents of Hillcrest speak English at home.
26.7% of residents speak Spanish at home (63% speak English very well, 32% speak English well, 5% speak English not well).
1.3% of residents speak other Indo-European language at home (48% speak English very well, 52% speak English well).
Foreign born population: 210 (12.6%)
(61.0% of them are naturalized citizens)
| Here: | 6.3 |
| State: | 6.4 |
| Here: | 5.0 |
| State: | 4.1 |

- Bedrooms in owner-occupied houses and condos in Hillcrest, Illinois
- 0no bedroom
- 31 bedroom
- 312 bedrooms
- 3553 bedrooms
- 774 bedrooms
- 285+ bedrooms

- Bedrooms in renter-occupied apartments in Hillcrest, Illinois
- 14no bedroom
- 81 bedroom
- 102 bedrooms
- 513 bedrooms
- 04 bedrooms
- 45+ bedrooms

- Cars and other vehicles available in Hillcrest in owner-occupied houses/condos
- 0no vehicle
- 421 vehicle
- 3352 vehicles
- 613 vehicles
- 394 vehicles
- 185+ vehicles

- Cars and other vehicles available in Hillcrest in renter-occupied apartments
- 0no vehicle
- 421 vehicle
- 462 vehicles
- 03 vehicles
- 04 vehicles
- 05+ vehicles

- Rooms in owner-occupied houses in Hillcrest, Illinois
- 01 room
- 02 rooms
- 83 rooms
- 244 rooms
- 965 rooms
- 1486 rooms
- 977 rooms
- 648 rooms
- 589+ rooms

- Rooms in renter-occupied apartments in Hillcrest, Illinois
- 141 room
- 02 rooms
- 83 rooms
- 54 rooms
- 255 rooms
- 236 rooms
- 47 rooms
- 38 rooms
- 49+ rooms


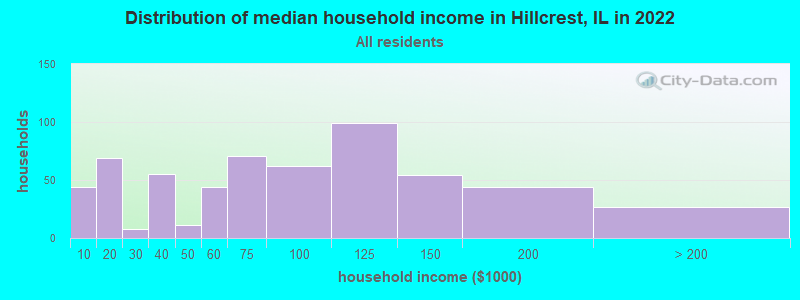
Hillcrest, IL household income distribution

- 44Less than $10,000
- 69$10,000 to $19,999
- 8$20,000 to $29,999
- 55$30,000 to $39,999
- 11$40,000 to $49,999
- 44$50,000 to $59,999
- 71$60,000 to $74,999
- 62$75,000 to $99,999
- 99$100,000 to $124,999
- 54$125,000 to $149,999
- 44$150,000 to $199,999
- 27$200,000 or more
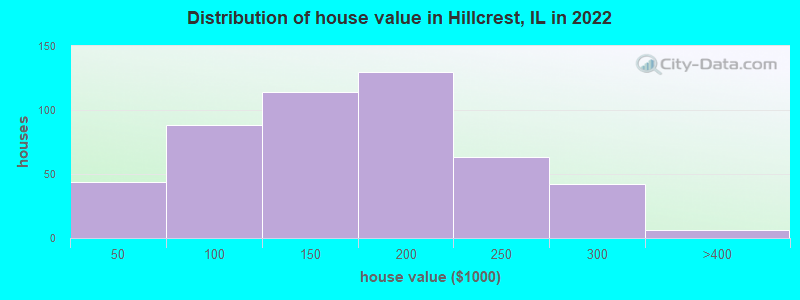
Home value of owner - occupied houses in 2022 in Hillcrest, IL
-
- 16Less than $10,000
- 22$10,000 to $14,999
- 4$25,000 to $29,999
- 57$70,000 to $79,999
- 20$80,000 to $89,999
- 9$90,000 to $99,999
- 83$100,000 to $124,999
- 30$125,000 to $149,999
- 91$150,000 to $174,999
- 38$175,000 to $199,999
- 62$200,000 to $249,999
- 41$250,000 to $299,999
- 5$300,000 to $399,999
Rent paid by renters in 2022 in Hillcrest, IL
-
- 12$250 to $299
- 5$450 to $499
- 3$500 to $549
- 5$600 to $649
- 5$650 to $699
- 38$900 to $999
- 4$1,000 to $1,249
- 3$1,250 to $1,499
- 5No cash rent

Percentage of workers working in this county: 70.1%
Number of people working at home: 118 (13.6% of all workers)
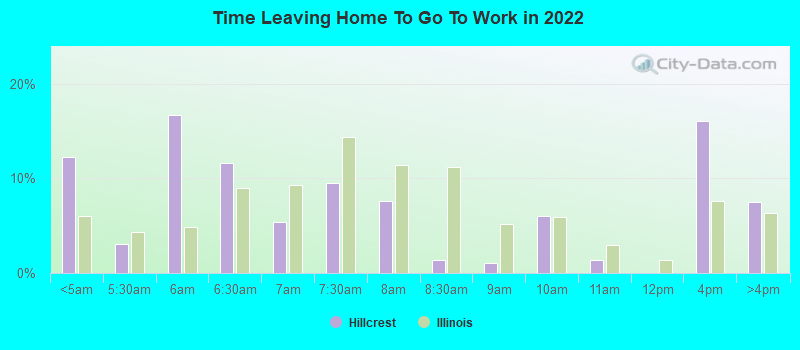
Travel time to work (commute)
- Less than 5 minutes: 3
- 5 to 9 minutes: 201
- 10 to 14 minutes: 189
- 15 to 19 minutes: 74
- 20 to 24 minutes: 40
- 25 to 29 minutes: 77
- 30 to 34 minutes: 54
- 35 to 39 minutes: 32
- 40 to 44 minutes: 3
- 45 to 59 minutes: 30
- 60 to 89 minutes: 31
- 90 or more minutes: 11
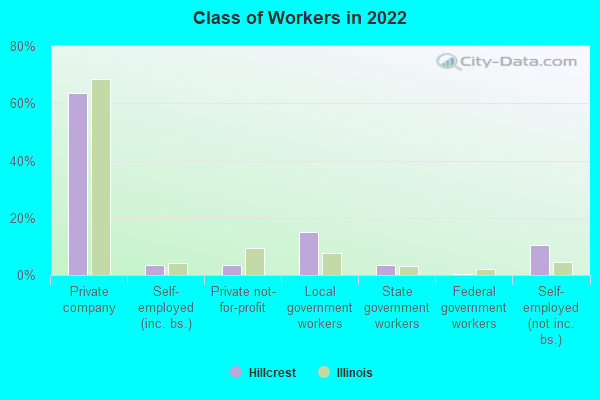
Means of transportation to work:
- Drove a car alone: 444 (81.8%)
- Carpooled: 76 (14.0%)
- Bus or trolley bus: 2 (0.4%)
- Bicycle: 3 (0.6%)
- Walked: 3 (0.6%)
- Other means: 2 (0.4%)
- Worked at home: 13 (2.4%)
- Unemployment by race in 2022
- Unemployment rate for White non-Hispanic residents
- 4.0%Males
- 4.2%Females
- Unemployment rate for American Indian and Alaska Native residents
- 23.1%Females
- Unemployment rate for two or more race residents
- 5.9%Males
- Unemployment rate for Hispanic or Latino residents
- 9.0%Males
- 1.9%Females

- Year of entry for the foreign-born population in Hillcrest, Illinois
- 02010 or later
- 912000 to 2009
- 151990 to 1999
- 231980 to 1989
- 301970 to 1979
- 6Before 1970

First ancestries reported:
- German: 168 (20.4%)
- Irish: 32 (3.9%)
- English: 26 (3.2%)
- American: 20 (2.4%)
- European: 15 (1.8%)
- Swedish: 14 (1.7%)
- Scottish: 7 (0.8%)
- Dutch: 3 (0.4%)
- Norwegian: 3 (0.4%)
- Ukrainian: 3 (0.4%)
- Scotch-Irish: 2 (0.2%)
Most common places of birth for foreign-born residents (%):
| Hillcrest: | 93.8% (197) |
| Illinois: | 34.7% (626,958) |
| Hillcrest: | 5.2% (11) |
| Illinois: | 1.0% (18,753) |
Place of birth for U.S.-born residents:
- This state: 1,075
- Other state: 380
- Northeast: 56
- Midwest: 102
- South: 177
- West: 39
93.2% of Hillcrest residents lived in the same house 1 years ago.
Out of people who lived in different houses, 6.6% lived in this county.
Out of people who lived in different counties, 25.4% lived in Illinois.
| Hillcrest: | 93.2% |
| State average: | 88.3% |
Education attainment for males 25 years and older:
- No schooling: 0
- Nursery to 4th grade: 0
- 5th and 6th grade: 7
- 7th and 8th grade: 0
- 9th grade: 3
- 10th grade: 5
- 11th grade: 15
- 12th grade, no diploma: 16
- High school graduate (or equivalency): 177
- Less than 1 year of college: 35
- Some college more than 1 year, no degree: 124
- Associate degree: 77
- Bachelor's degree: 39
- Master's degree: 19
- Professional school degree: 0
- Doctorate degree: 5

Education attainment for females 25 years and older:
- No schooling: 14
- Nursery to 4th grade: 2
- 5th and 6th grade: 13
- 7th and 8th grade: 0
- 9th grade: 0
- 10th grade: 0
- 11th grade: 18
- 12th grade, no diploma: 22
- High school graduate (or equivalency): 126
- Less than 1 year of college: 15
- Some college more than 1 year, no degree: 112
- Associate degree: 81
- Bachelor's degree: 45
- Master's degree: 37
- Professional school degree: 0
- Doctorate degree: 0


Housing units in structures:
- One, detached: 544
- One, attached: 5
- Two: 6
- 3 or 4: 5
- 10 to 19: 14
House/condo owner moved in on average 11 years ago
Renter moved in on average 7 years ago

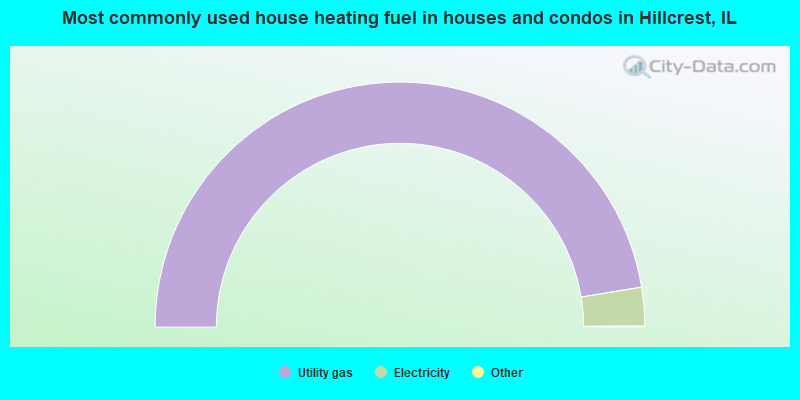
- 94.9%Utility gas
- 5.1%Electricity
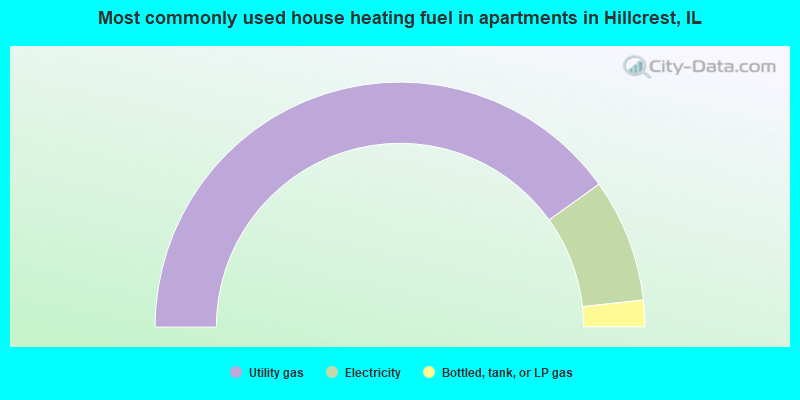
- 80.2%Utility gas
- 16.3%Electricity
- 3.5%Bottled, tank, or LP gas
Private vs. public school enrollment:
| Here: | 11.0% |
| Illinois: | 13.3% |
| Here: | 4.5% |
| Illinois: | 9.9% |
| Here: | 4.8% |
| Illinois: | 27.4% |


