Hillsboro, OR (Oregon) Houses and Residents
Estimated median house or condo value in 2022: $531,100 (it was $163,200 in 2000 )
Hillsboro:
$531,100Oregon:
$475,600
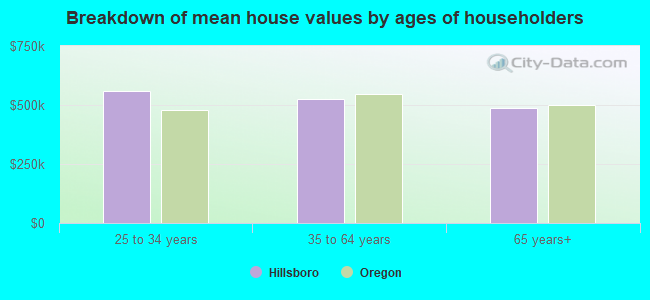
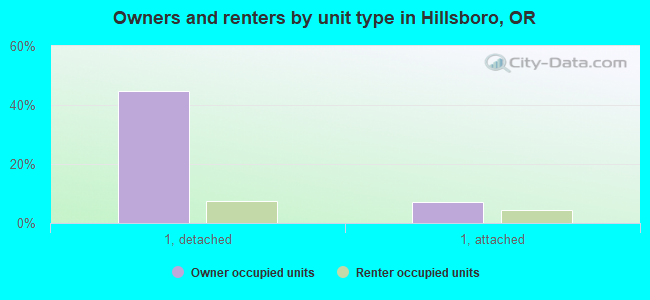
Lower value quartile - upper value quartile: $428,200 - $658,800Mean price in 2022: Detached houses: $510,753 Here:
$510,753State:
$562,872
Townhouses or other attached units: $389,743 Here:
$389,743State:
$463,029
In 2-unit structures: $1,003,691 Here:
$1,003,691State:
$505,105
In 3-to-4-unit structures: $347,613 Here:
$347,613State:
$419,673
In 5-or-more-unit structures: $257,086 Here:
$257,086State:
$420,389
Mobile homes: $36,533 Here:
$36,533State:
$214,044
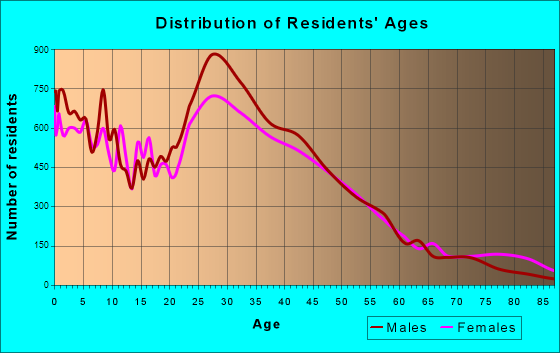
Total population: 99,393 (Urban population: 69,580, Rural population: 303 (all nonfarm) )
Houses: 46,315 (45,269 occupied: 23,017 owner occupied, 22,252 renter occupied )
% of renters here:
49%State:
37%
Housing density: 2,147 houses/condos per square mile
Median price asked for vacant for-sale houses and condos in 2022: $437,504.
Median contract rent in 2022: $1,666 (lower quartile is $1,341, upper quartile is $1,910)
Median rent asked for vacant for-rent units in 2022: $2,459
Median gross rent in Hillsboro, OR in 2022: $1,786
Housing units in Hillsboro with a mortgage: 17,175 (1,658 second mortgage, 0 home equity loan, 1,393 both second mortgage and home equity loan )Houses without a mortgage: 482
Median household income for houses/condos with a mortgage: $140,265
Median household income for apartments without a mortgage: $98,389
Median monthly housing costs: $1,768
Data:
Median house or condo value ($)
Median house or condo value ($ change since 2000)
Median house or condo value ($) - White
Median house or condo value ($) - Black or African American
Median house or condo value ($) - Asian
Median house or condo value ($) - Hispanic or Latino
Median house or condo value ($) - American Indian and Alaska Native
Median house or condo value ($) - Multirace
Median house or condo value ($) - Other Race
Median price asked for mobile homes ($)
Household density (households per square mile)
Mean house or condo value by units in structure - 1, detached ($)
Mean house or condo value by units in structure - 1, attached ($)
Mean house or condo value by units in structure - 2 ($)
Mean house or condo value by units in structure by units in structure - 3 or 4 ($)
Mean house or condo value by units in structure - 5 or more ($)
Mean house or condo value by units in structure - Boat, RV, van, etc. ($)
Mean house or condo value by units in structure - Mobile home ($)
Median contract rent ($)
Median contract rent - Lower quartile ($)
Median contract rent - Upper quartile ($)
Median gross rent ($)
Urban houses (%)
Rural houses (%)
Houses occupied (%)
Houses occupied (% change since 2000)
Houses owner occupied (%)
Houses owner occupied (% change since 2000)
Houses renter occupied (%)
Houses renter occupied (% change since 2000)
Vacant housing units - For rent (%)
Vacant housing units - For rent (% change since 2000)
Vacant housing units - For sale only (%)
Vacant housing units - For sale only (% change since 2000)
Vacant housing units - Rented or sold, not occupied (%)
Vacant housing units - Rented or sold, not occupied (% change since 2000)
Vacant housing units - For seasonal, recreational, or occasional use (%)
Vacant housing units - For seasonal, recreational, or occasional use (% change since 2000)
Vacant housing units - For migrant workers (%)
Vacant housing units - For migrant workers (% change since 2000)
Vacant housing units - Other vacant (%)
Vacant housing units - Other vacant (% change since 2000)
Median monthly housing costs ($)
Median household income for houses/condos with a mortgage ($)
Median household income for houses/condos without a mortgage ($)
Median household income ($)
Median household income ($) - White
Median household income ($) - Black or African American
Median household income ($) - Asian
Median household income ($) - Hispanic or Latino
Median household income ($) - American Indian and Alaska Native
Median household income ($) - Multirace
Median household income ($) - Other Race
Mortgage status - with mortgage (%)
Mortgage status - with second mortgage (%)
Mortgage status - with home equity loan (%)
Mortgage status - with both second mortgage and home equity loan (%)
Mortgage status - without a mortgage (%)
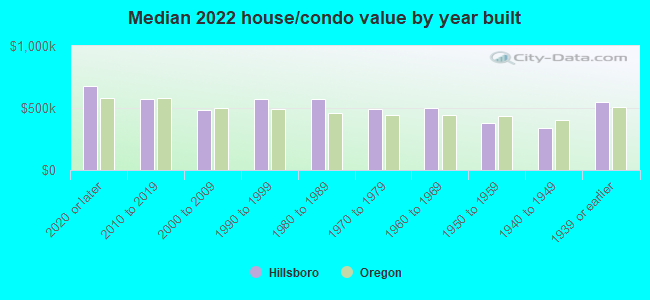
Median year house/condo built
Median year apartment built
Household type by relationship - Male householder living alone (%)
Household type by relationship - Male householder not living alone (%)
Household type by relationship - Female householder living alone (%)
Household type by relationship - Female householder not living alone (%)
Household type by relationship - Opposite-Sex spouse (%)
Household type by relationship - Same-Sex spouse (%)
Household type by relationship - Opposite-Sex unmarried partner (%)
Household type by relationship - Same-Sex unmarried partner (%)
Household type by relationship - In group quarters (%)
Size of family households - 2-person household (%)
Size of family households - 3-person household (%)
Size of family households - 4-person household (%)
Size of family households - 5-person household (%)
Size of family households - 6-person household (%)
Size of family households - 7-or-more-person household (%)
Size of nonfamily households - 1-person household (%)
Size of nonfamily households - 2-person household (%)
Size of nonfamily households - 3-person household (%)
Size of nonfamily households - 4-person household (%)
Size of nonfamily households - 5-person household (%)
Size of nonfamily households - 6-person household (%)
Size of nonfamily households - 7-or-moreperson household (%)
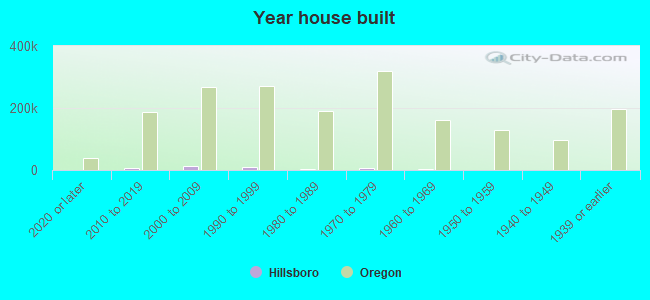
Year house built - Built 2010 or later (%)
Year house built - Built 2000 to 2009 (%)
Year house built - Built 1990 to 1999 (%)
Year house built - Built 1980 to 1989 (%)
Year house built - Built 1970 to 1979 (%)
Year house built - Built 1960 to 1969 (%)
Year house built - Built 1950 to 1959 (%)
Year house built - Built 1940 to 1949 (%)
Year house built - Built 1939 or earlier (%)
Median number of rooms in houses and condos
Median number of rooms in apartments
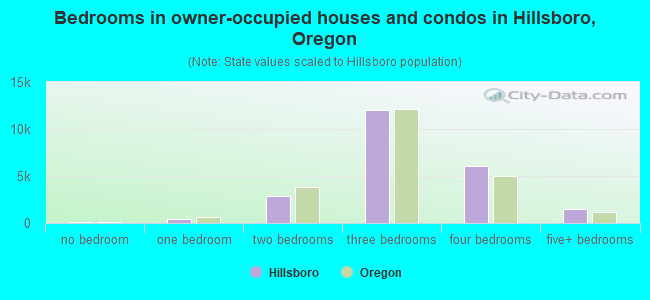
Median number of bedrooms in owner occupied houses
Mean number of bedrooms in owner occupied houses
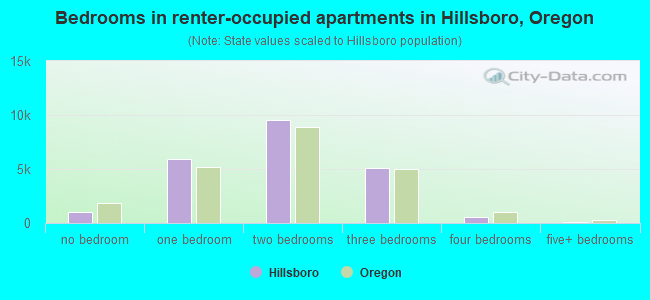
Median number of bedrooms in renter occupied houses
Mean number of bedrooms in renter occupied houses
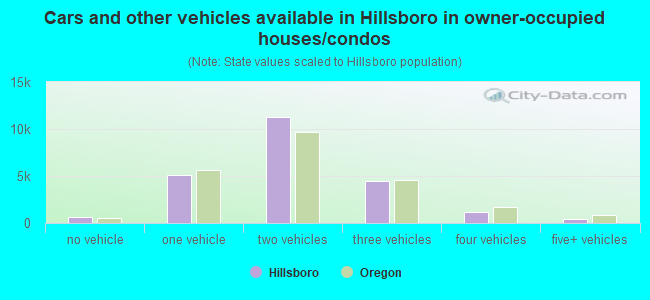
Median number of vehichles in owner occupied houses
Mean number of vehichles in owner occupied houses
Median number of vehichles in renter occupied houses
Mean number of vehichles in renter occupied houses
Rooms in owner-occupied houses - 1 room (%)
Rooms in owner-occupied houses - 2 rooms (%)
Rooms in owner-occupied houses - 3 rooms (%)
Rooms in owner-occupied houses - 4 rooms (%)
Rooms in owner-occupied houses - 5 rooms (%)
Rooms in owner-occupied houses - 6 rooms (%)
Rooms in owner-occupied houses - 7 rooms (%)
Rooms in owner-occupied houses - 8 rooms (%)
Rooms in owner-occupied houses - 9+ rooms (%)
Rooms in renter-occupied houses - 1 room (%)
Rooms in renter-occupied houses - 2 rooms (%)
Rooms in renter-occupied houses - 3 rooms (%)
Rooms in renter-occupied houses - 4 rooms (%)
Rooms in renter-occupied houses - 5 rooms (%)
Rooms in renter-occupied houses - 6 rooms (%)
Rooms in renter-occupied houses - 7 rooms (%)
Rooms in renter-occupied houses - 8 rooms (%)
Rooms in renter-occupied houses - 9+ rooms (%)
Bedrooms in owner-occupied houses - no bedrooms (%)
Bedrooms in owner-occupied houses - 1 bedroom (%)
Bedrooms in owner-occupied houses - 2 bedrooms (%)
Bedrooms in owner-occupied houses - 3 bedrooms (%)
Bedrooms in owner-occupied houses - 4 bedrooms (%)
Bedrooms in owner-occupied houses - 5+ bedrooms (%)
Bedrooms in renter-occupied houses - no bedrooms (%)
Bedrooms in renter-occupied houses - 1 bedroom (%)
Bedrooms in renter-occupied houses - 2 bedrooms (%)
Bedrooms in renter-occupied houses - 3 bedrooms (%)
Bedrooms in renter-occupied houses - 4 bedrooms (%)
Bedrooms in renter-occupied houses - 5+ bedrooms (%)
Vehicles available in owner-occupied houses - no vehicle available (%)
Vehicles available in owner-occupied houses - 1 vehicle available(%)
Vehicles available in owner-occupied houses - 2 Vehicles available (%)
Vehicles available in owner-occupied houses - 3 Vehicles available (%)
Vehicles available in owner-occupied houses - 4 Vehicles available (%)
Vehicles available in owner-occupied houses - 5+ Vehicles available (%)
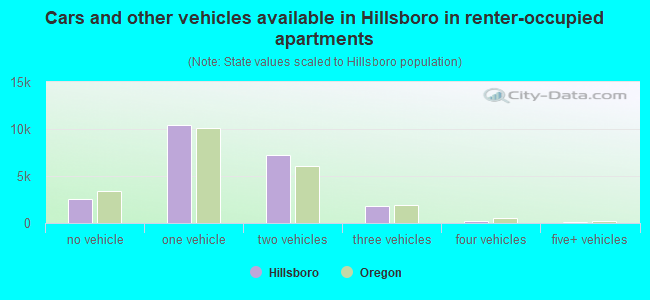
Vehicles available in renter-occupied houses - no vehicle available (%)
Vehicles available in renter-occupied houses - 1 vehicle available (%)
Vehicles available in renter-occupied houses - 2 Vehicles available (%)
Vehicles available in renter-occupied houses - 3 Vehicles available (%)
Vehicles available in renter-occupied houses - 4 Vehicles available (%)
Vehicles available in renter-occupied houses - 5+ Vehicles available (%)
Housing units in structures - 1, detached (%)
Housing units in structures - 1, attached (%)
Housing units in structures - 2 (%)
Housing units in structures - 3 or 4 (%)
Housing units in structures - 5 to 9 (%)
Housing units in structures - 10 to 19 (%)
Housing units in structures - 20 to 49 (%)
Housing units in structures - 50 or more (%)
Housing units in structures - Mobile home (%)
Housing units in structures - Boat, RV, van, etc. (%)
Housing units in structures - Owners - 1, detached (%)
Housing units in structures - Owners - 1, attached (%)
Housing units in structures - Owners - 2 (%)
Housing units in structures - Owners - 3 or 4 (%)
Housing units in structures - Owners - 5 to 9 (%)
Housing units in structures - Owners - 10 to 19 (%)
Housing units in structures - Owners - 20 to 49 (%)
Housing units in structures - Owners - 50 or more (%)
Housing units in structures - Owners - Mobile home (%)
Housing units in structures - Owners - Boat, RV, van, etc. (%)
Housing units in structures - Renters - 1, detached (%)
Housing units in structures - Renters - 1, attached (%)
Housing units in structures - Renters - 2 (%)
Housing units in structures - Renters - 3 or 4 (%)
Housing units in structures - Renters - 5 to 9 (%)
Housing units in structures - Renters - 10 to 19 (%)
Housing units in structures - Renters - 20 to 49 (%)
Housing units in structures - Renters - 50 or more (%)
Housing units in structures - Renters - Mobile home (%)
Housing units in structures - Renters - Boat, RV, van, etc. (%)
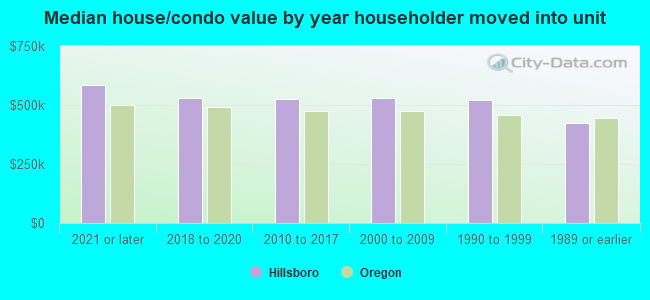
House/condo owner moved in on average (years ago)
Renter moved in on average (years ago)
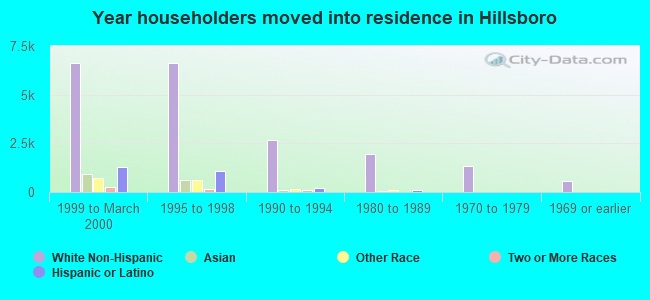
Year householder moved into unit - Moved in 1999 to March 2000 (%)
Year householder moved into unit - Moved in 1999 to March 2000 (%) - White
Year householder moved into unit - Moved in 1999 to March 2000 (%) - Black or African American
Year householder moved into unit - Moved in 1999 to March 2000 (%) - Asian
Year householder moved into unit - Moved in 1999 to March 2000 (%) - Hispanic or Latino
Year householder moved into unit - Moved in 1999 to March 2000 (%) - American Indian and Alaska Native
Year householder moved into unit - Moved in 1999 to March 2000 (%) - Multirace
Year householder moved into unit - Moved in 1999 to March 2000 (%) - Other Race
Year householder moved into unit - Moved in 1995 to 1998 (%)
Year householder moved into unit - Moved in 1995 to 1998 (%) - White
Year householder moved into unit - Moved in 1995 to 1998 (%) - Black or African American
Year householder moved into unit - Moved in 1995 to 1998 (%) - Asian
Year householder moved into unit - Moved in 1995 to 1998 (%) - Hispanic or Latino
Year householder moved into unit - Moved in 1995 to 1998 (%) - American Indian and Alaska Native
Year householder moved into unit - Moved in 1995 to 1998 (%) - Multirace
Year householder moved into unit - Moved in 1995 to 1998 (%) - Other Race
Year householder moved into unit - Moved in 1990 to 1994 (%)
Year householder moved into unit - Moved in 1990 to 1994 (%) - White
Year householder moved into unit - Moved in 1990 to 1994 (%) - Black or African American
Year householder moved into unit - Moved in 1990 to 1994 (%) - Asian
Year householder moved into unit - Moved in 1990 to 1994 (%) - Hispanic or Latino
Year householder moved into unit - Moved in 1990 to 1994 (%) - American Indian and Alaska Native
Year householder moved into unit - Moved in 1990 to 1994 (%) - Multirace
Year householder moved into unit - Moved in 1990 to 1994 (%) - Other Race
Year householder moved into unit - Moved in 1980 to 1989 (%)
Year householder moved into unit - Moved in 1980 to 1989 (%) - White
Year householder moved into unit - Moved in 1980 to 1989 (%) - Black or African American
Year householder moved into unit - Moved in 1980 to 1989 (%) - Asian
Year householder moved into unit - Moved in 1980 to 1989 (%) - Hispanic or Latino
Year householder moved into unit - Moved in 1980 to 1989 (%) - American Indian and Alaska Native
Year householder moved into unit - Moved in 1980 to 1989 (%) - Multirace
Year householder moved into unit - Moved in 1980 to 1989 (%) - Other Race
Year householder moved into unit - Moved in 1970 to 1979 (%)
Year householder moved into unit - Moved in 1970 to 1979 (%) - White
Year householder moved into unit - Moved in 1970 to 1979 (%) - Black or African American
Year householder moved into unit - Moved in 1970 to 1979 (%) - Asian
Year householder moved into unit - Moved in 1970 to 1979 (%) - Hispanic or Latino
Year householder moved into unit - Moved in 1970 to 1979 (%) - American Indian and Alaska Native
Year householder moved into unit - Moved in 1970 to 1979 (%) - Multirace
Year householder moved into unit - Moved in 1970 to 1979 (%) - Other Race
Year householder moved into unit - Moved in 1969 or earlier (%)
Year householder moved into unit - Moved in 1969 or earlier (%) - White
Year householder moved into unit - Moved in 1969 or earlier (%) - Black or African American
Year householder moved into unit - Moved in 1969 or earlier (%) - Asian
Year householder moved into unit - Moved in 1969 or earlier (%) - Hispanic or Latino
Year householder moved into unit - Moved in 1969 or earlier (%) - American Indian and Alaska Native
Year householder moved into unit - Moved in 1969 or earlier (%) - Multirace
Year householder moved into unit - Moved in 1969 or earlier (%) - Other Race
Housing units lacking complete plumbing facilities (%)
Housing units lacking complete kitchen facilities (%)
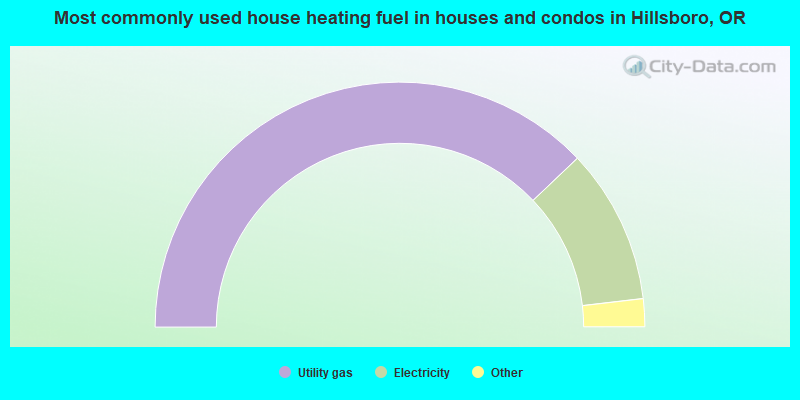
House heating fuel used in houses and condos - Utility gas (%)
House heating fuel used in houses and condos - Bottled, tank, or LP gas (%)
House heating fuel used in houses and condos - Electricity (%)
House heating fuel used in houses and condos - Fuel oil, kerosene, etc. (%)
House heating fuel used in houses and condos - Coal or coke (%)
House heating fuel used in houses and condos - Wood (%)
House heating fuel used in houses and condos - Solar energy (%)
House heating fuel used in houses and condos - Other fuel (%)
House heating fuel used in houses and condos - No fuel used (%)
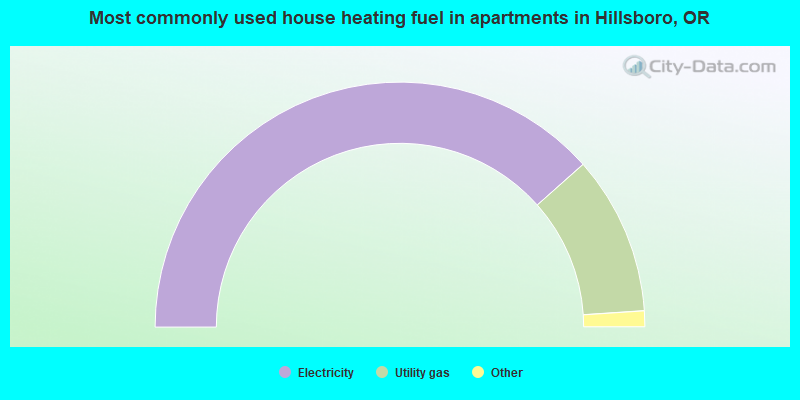
House heating fuel used in apartments - Utility gas (%)
House heating fuel used in apartments - Bottled, tank, or LP gas (%)
House heating fuel used in apartments - Electricity (%)
House heating fuel used in apartments - Fuel oil, kerosene, etc. (%)
House heating fuel used in apartments - Coal or coke (%)
House heating fuel used in apartments - Wood (%)
House heating fuel used in apartments - Solar energy (%)
House heating fuel used in apartments - Other fuel (%)
House heating fuel used in apartments - No fuel used (%)
Latest news about housing in Hillsboro, OR collected exclusively by city-data.com from local newspapers, TV, and radio stations
Median year house/condo built: 1996Median year apartment built: 2000Household type by relationship:
Households: 107,319
Male householders: 23,318 (6,194 living alone ), Female householders: 21,951 (6,333 living alone )21,964 spouses (21,566 opposite-sex spouses ), 4,409 unmarried partners , (4,238 opposite-sex unmarried partners ), 25,524 children (24,488 natural , 823 adopted , 213 stepchildren ), 618 grandchildren , 666 brothers or sisters , 1,766 parents , 0 foster children , 1,079 other relatives , 4,482 non-relatives In group quarters: 1,542
Size of family households: 12,876 2-persons , 6,709 3-persons , 4,937 4-persons , 2,200 5-persons , 414 6-persons , 95 7-or-more-persons .
Size of nonfamily households: 12,527 1-person , 4,385 2-persons , 870 3-persons , 256 4-persons .
12,408 married couples with children. single-parent households (638 men , 5,863 women ).
68.7% of residents of Hillsboro speak English at home. of residents speak Spanish at home (64% speak English very well , 14% speak English well , 15% speak English not well , 7% don't speak English at all ).of residents speak other Indo-European language at home (78% speak English very well , 14% speak English well , 6% speak English not well , 1% don't speak English at all ).of residents speak Asian or Pacific Island language at home (67% speak English very well , 22% speak English well , 10% speak English not well , 2% don't speak English at all ).of residents speak other language at home (72% speak English very well , 18% speak English well , 10% speak English not well ).
Foreign born population: 22,805 (21.2%)of them are naturalized citizens )
Median number of rooms in houses and condos:
Median number of rooms in apartments
Owner-occupied Renter-occupied
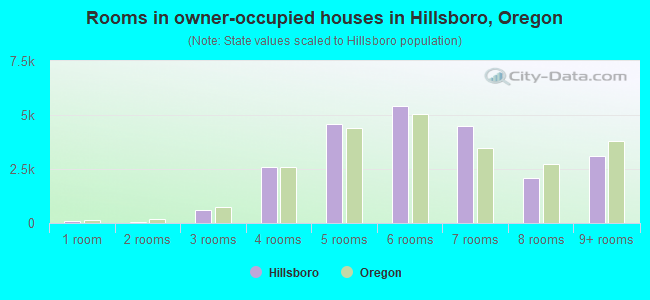
Rooms in owner-occupied houses in Hillsboro, Oregon
97 1 room 39 2 rooms 589 3 rooms 2,572 4 rooms 4,599 5 rooms 5,404 6 rooms 4,504 7 rooms 2,095 8 rooms 3,118 9+ rooms
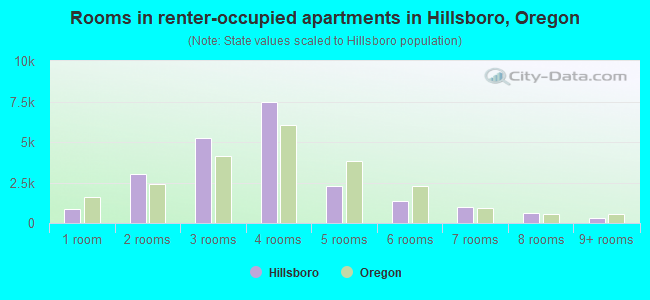
Rooms in renter-occupied apartments in Hillsboro, Oregon
893 1 room 3,048 2 rooms 5,265 3 rooms 7,446 4 rooms 2,314 5 rooms 1,381 6 rooms 968 7 rooms 620 8 rooms 317 9+ rooms
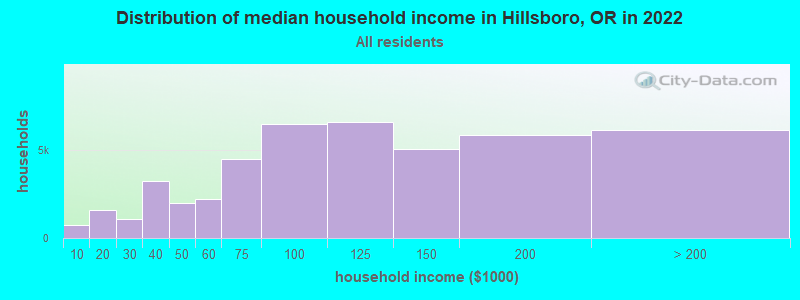
Hillsboro, OR household income distribution 742 Less than $10,0001,586 $10,000 to $19,9991,079 $20,000 to $29,9993,207 $30,000 to $39,9991,990 $40,000 to $49,9992,227 $50,000 to $59,9994,446 $60,000 to $74,9996,474 $75,000 to $99,9996,560 $100,000 to $124,9995,039 $125,000 to $149,9995,827 $150,000 to $199,9996,092 $200,000 or more
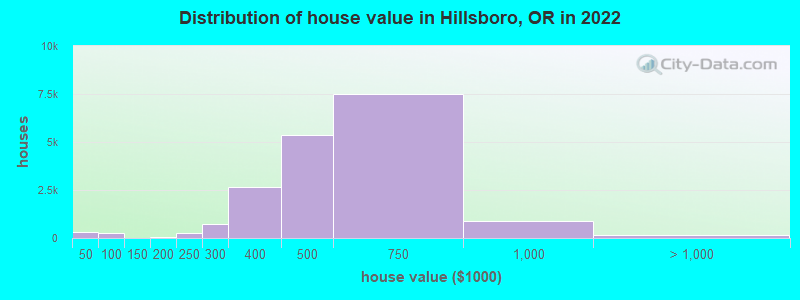
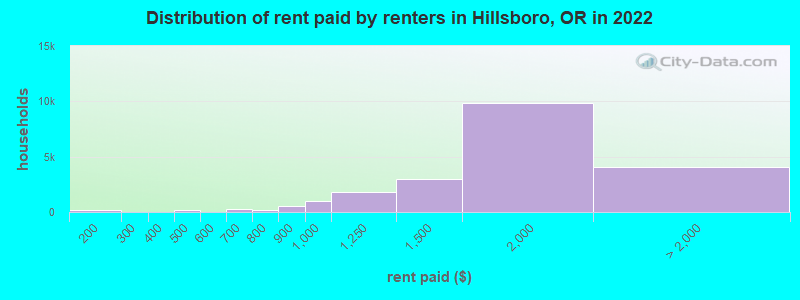
Home value of owner - occupied houses in 2022 in Hillsboro, OR 134 Less than $10,00028 $10,000 to $14,99919 $20,000 to $24,9993 $25,000 to $29,99911 $30,000 to $34,99973 $35,000 to $39,99961 $40,000 to $49,999125 $50,000 to $59,99931 $60,000 to $69,9998 $80,000 to $89,99943 $90,000 to $99,99910 $100,000 to $124,9996 $125,000 to $149,99921 $150,000 to $174,99920 $175,000 to $199,999277 $200,000 to $249,999724 $250,000 to $299,9992,644 $300,000 to $399,9995,386 $400,000 to $499,9997,497 $500,000 to $749,999882 $750,000 to $999,999115 $1,000,000 to $1,499,99914 $1,500,000 to $1,999,99937 $2,000,000 or moreRent paid by renters in 2022 in Hillsboro, OR 17 $100 to $149205 $150 to $19926 $200 to $2495 $250 to $29924 $350 to $39936 $400 to $449101 $450 to $49914 $500 to $54922 $550 to $59976 $600 to $649210 $650 to $69997 $700 to $74989 $750 to $799518 $800 to $899956 $900 to $9991,786 $1,000 to $1,2492,967 $1,250 to $1,4999,822 $1,500 to $1,9993,127 $2,000 to $2,499367 $2,500 to $2,999116 $3,000 to $3,499149 $3,500 or more298 No cash rent
Percentage of workers working in this county: 88.1%Number of people working at home: 16,324 (25.4% of all workers )
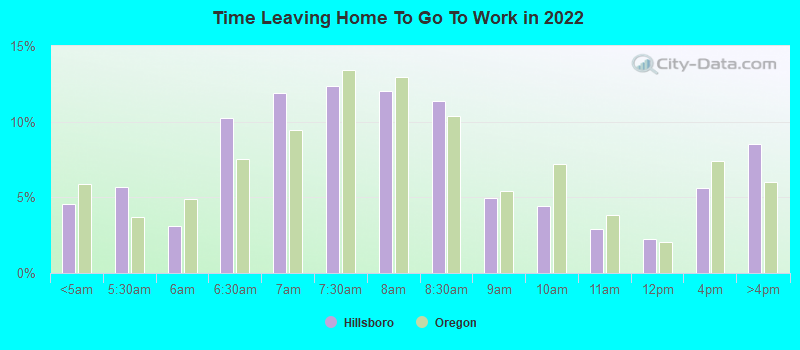
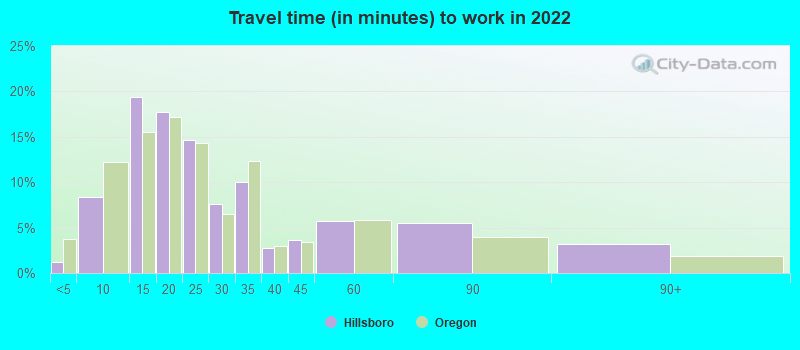
Travel time to work (commute)
Less than 5 minutes: 7455 to 9 minutes: 5,90910 to 14 minutes: 11,75615 to 19 minutes: 6,46620 to 24 minutes: 5,63625 to 29 minutes: 2,54330 to 34 minutes: 4,61635 to 39 minutes: 2,51140 to 44 minutes: 2,73045 to 59 minutes: 2,71260 to 89 minutes: 1,64790 or more minutes: 769
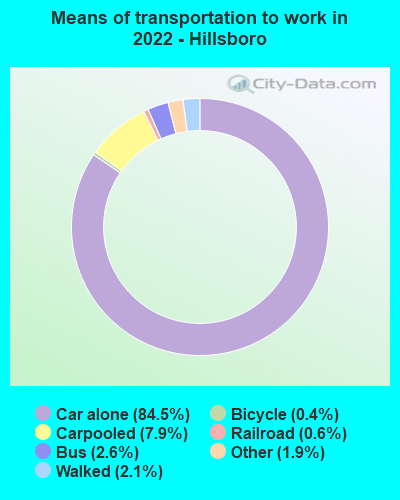
Means of transportation to work:
Drove a car alone: 64,034 (69.5%)Carpooled: 5,990 (6.5%)Bus : 1,989 (2.2%)Light rail, streetcar or trolley : 474 (0.5%)Taxi: 1,433 (1.6%)Bicycle: 277 (0.3%)Walked: 1,589 (1.7%)Worked at home: 16,324 (17.7%)
Unemployment by race in 2022
Unemployment rate for White non-Hispanic residents 1.9% Males3.6% FemalesUnemployment rate for Black residents 2.4% Males5.3% FemalesUnemployment rate for American Indian and Alaska Native residents 6.2% FemalesUnemployment rate for Asian residents 0.2% Males4.8% FemalesUnemployment rate for other race residents 5.1% Males11.1% FemalesUnemployment rate for two or more race residents 2.1% Males0.9% FemalesUnemployment rate for Hispanic or Latino residents 5.2% Males5.5% Females
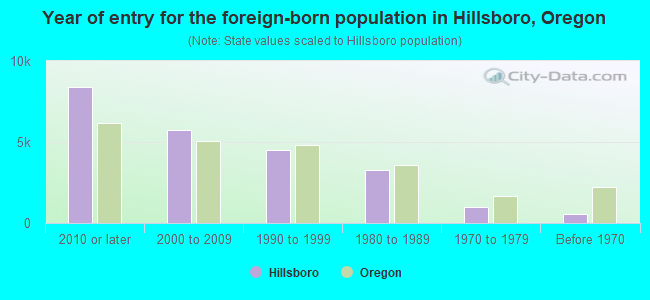
Year of entry for the foreign-born population in Hillsboro, Oregon
8,419 2010 or later 5,770 2000 to 2009 4,513 1990 to 1999 3,271 1980 to 1989 959 1970 to 1979 561 Before 1970
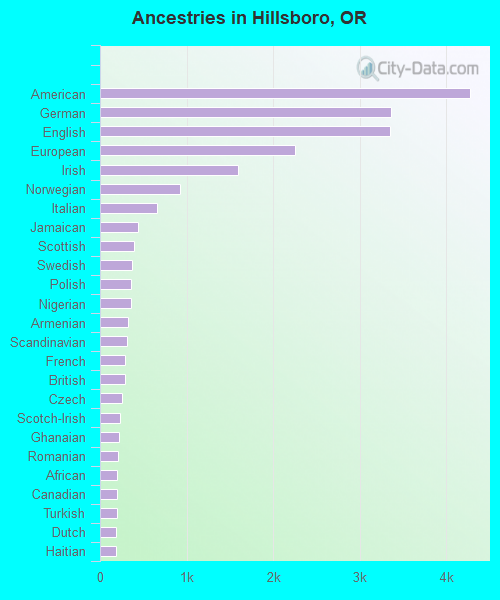
First ancestries reported:
American: 4,278 (7.5%)
German: 3,355 (5.9%)
English: 3,353 (5.9%)
European: 2,246 (3.9%)
Irish: 1,599 (2.8%)
Norwegian: 927 (1.6%)
Italian: 658 (1.1%)
Jamaican: 435 (0.8%)
Scottish: 394 (0.7%)
Swedish: 366 (0.6%)
Polish: 362 (0.6%)
Nigerian: 353 (0.6%)
Armenian: 324 (0.6%)
Scandinavian: 309 (0.5%)
French: 292 (0.5%)
British: 288 (0.5%)
Czech: 256 (0.4%)
Scotch-Irish: 233 (0.4%)
Ghanaian: 224 (0.4%)
Romanian: 205 (0.4%)
African: 201 (0.4%)
Canadian: 195 (0.3%)
Turkish: 192 (0.3%)
Dutch: 183 (0.3%)
Haitian: 183 (0.3%)
French Canadian: 169 (0.3%)
Northern European: 165 (0.3%)
West Indian: 153 (0.3%)
Danish: 135 (0.2%)
Russian: 133 (0.2%)
Eastern European: 121 (0.2%)
Portuguese: 117 (0.2%)
Swiss: 114 (0.2%)
Ukrainian: 113 (0.2%)
Welsh: 85 (0.1%)
Hungarian: 85 (0.1%)
Finnish: 84 (0.1%)
Iranian: 81 (0.1%)
Moroccan: 78 (0.1%)
Iraqi: 75 (0.1%)
Austrian: 65 (0.1%)
Serbian: 61 (0.1%)
Greek: 61 (0.1%)
Australian: 42 (0.07%)
Croatian: 42 (0.07%)
Belgian: 36 (0.06%)
Palestinian: 33 (0.06%)
Assyrian: 31 (0.05%)
Ethiopian: 29 (0.05%)
Bulgarian: 25 (0.04%)
Celtic: 19 (0.03%)
Egyptian: 17 (0.03%)
South African: 15 (0.03%)
Alsatian: 14 (0.02%)
Kenyan: 13 (0.02%)
Cypriot: 13 (0.02%)
Arab: 9 (0.02%)
Guyanese: 9 (0.02%)
Cajun: 9 (0.02%)
Lebanese: 8 (0.01%)
Basque: 8 (0.01%)
Estonian: 5 (0.01%)
Yugoslavian: 4 (0.01%)
Pennsylvania German: 3 (0.01%)
Most common places of birth for foreign-born residents (%): Mexico Hillsboro:
33.8% (7,506)Oregon:
33.9% (140,109)
India Hillsboro:
17.1% (3,803)Oregon:
4.7% (19,604)
Philippines Hillsboro:
4.9% (1,090)Oregon:
3.5% (14,530)
Guatemala Hillsboro:
4.1% (921)Oregon:
1.7% (7,103)
Vietnam Hillsboro:
3.6% (805)Oregon:
5.5% (22,563)
Ghana Hillsboro:
2.8% (625)Oregon:
0.3% (1,247)
China, excluding Hong Kong and Taiwan Hillsboro:
2.4% (529)Oregon:
5.2% (21,429)
Japan Hillsboro:
2.2% (488)Oregon:
1.5% (6,259)
Korea Hillsboro:
2.0% (447)Oregon:
2.8% (11,450)
Canada Hillsboro:
1.8% (392)Oregon:
3.7% (15,229)
Place of birth for U.S.-born residents:
This state: 38,570Other state: 44,384Northeast: 3,578Midwest: 5,547South: 7,059West: 28,200 85.5% of Hillsboro residents lived in the same house 1 years ago.
Out of people who lived in different houses, 31.9% lived in this county.
Out of people who lived in different counties, 31.7% lived in Oregon.
Hillsboro:
85.5%State average:
85.5%
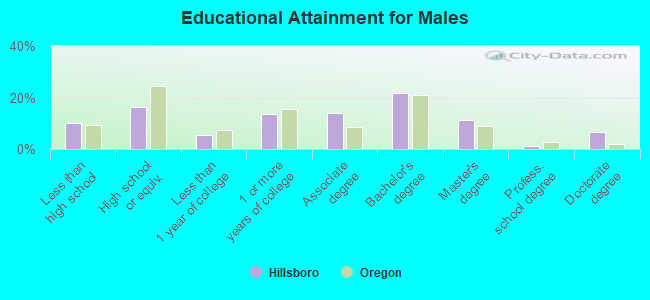
Education attainment for males 25 years and older:
No schooling: 1,473Nursery to 4th grade: 2705th and 6th grade: 3357th and 8th grade: 969th grade: 29210th grade: 19811th grade: 24612th grade, no diploma: 1,144High school graduate (or equivalency): 6,575Less than 1 year of college: 2,147Some college more than 1 year, no degree: 5,468Associate degree: 5,586Bachelor's degree: 8,791Master's degree: 4,503Professional school degree: 479Doctorate degree: 2,656
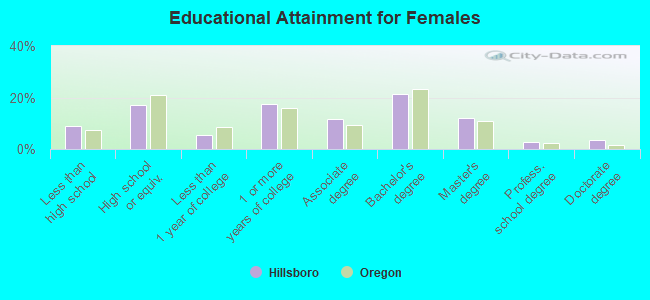
Education attainment for females 25 years and older:
No schooling: 370Nursery to 4th grade: 1345th and 6th grade: 4007th and 8th grade: 3159th grade: 38210th grade: 8911th grade: 1,18412th grade, no diploma: 563High school graduate (or equivalency): 6,584Less than 1 year of college: 2,177Some college more than 1 year, no degree: 6,776Associate degree: 4,605Bachelor's degree: 8,271Master's degree: 4,633Professional school degree: 1,088Doctorate degree: 1,309
Housing units in structures:
One, detached: 21,859One, attached: 4,723Two: 6113 or 4: 2,5635 to 9: 4,17410 to 19: 2,22720 to 49: 3,69350 or more: 6,148Mobile homes: 317Median worth of mobile homes: $41,698
Housing units lacking complete plumbing facilities in 2022: 0.3%Housing units lacking complete kitchen facilities in 2022: 0.9%House/condo owner moved in on average 8 years ago
Renter moved in on average 2 years ago
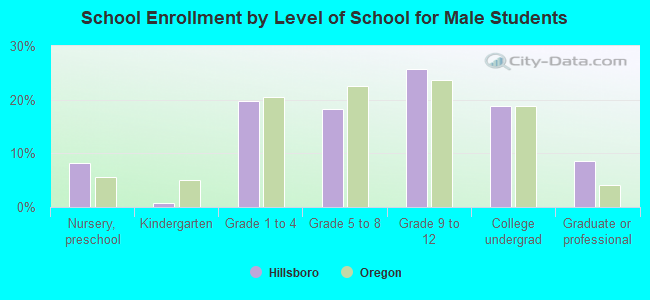
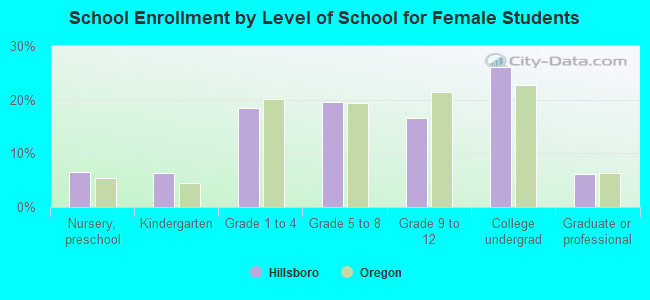
Private vs. public school enrollment:
Students in private schools in grades 1 to 8 (elementary and middle school): 1,211 Students in private schools in grades 9 to 12 (high school): 291 Students in private undergraduate colleges: 946