Hillsboro, TN (Tennessee) Houses and Residents
| Hillsboro: | $238,609 |
| Tennessee: | $284,800 |
Total population: 4,033 (Urban population: 0, Rural population: 3,757 (329 farm, 3,428 nonfarm))
Houses: 1,493 (1,377 occupied: 1,138 owner occupied, 239 renter occupied)
| % of renters here: | 17% |
| State: | 33% |
Housing density: 17 houses/condos per square mile
Median price asked for vacant for-sale houses and condos in 2022 in this county: $152,791.
Median contract rent in 2022: $857 (lower quartile is $614, upper quartile is $1,014)
Median rent asked for vacant for-rent units in 2022: $954
Median gross rent in Hillsboro, TN in 2022: $1,076
Housing units in Hillsboro with a mortgage: 361 (11 second mortgage, 14 home equity loan, 0 both second mortgage and home equity loan)
Houses without a mortgage: 258
Compare current foreclosures near Hillsboro, TN:
| Photo | Address | Area | Beds / Baths | Price | Details |
|---|---|---|---|---|---|

|
#1
Hillsboro Hwy
Hillsboro, TN 37342
|
1,596 sq. feet
|
1 baths - beds |
show details | |

|
#2
Simmons Rd
Hillsboro, TN 37342
|
1,536 sq. feet
|
1 baths - beds |
show details | |

|
#3
Limbo Dr
Hillsboro, TN 37342
|
1,728 sq. feet
|
2 baths - beds |
show details | |

|
#4
Oakley St
Hillsboro, TN 37342
|
1,200 sq. feet
|
1 baths - beds |
show details | |

|
#5
Vernon Winton Rd
Hillsboro, TN 37342
|
1,176 sq. feet
|
2 baths - beds |
show details | |

|
#6
S C St
Hillsboro, TN 37342
|
1,152 sq. feet
|
- baths - beds |
show details | |

|
#7
S B St
Hillsboro, TN 37342
|
924 sq. feet
|
- baths - beds |
show details | |

|
#8
Carolyn Ct
Hillsboro, TN 37342
|
- sq. feet
|
- baths - beds |
show details | |

|
#9
Hillsboro Viola Rd
Hillsboro, TN 37342
|
1,568 sq. feet
|
- baths - beds |
show details | |

|
#10
Logan Chapel Rd
Hillsboro, TN 37342
|
1,248 sq. feet
|
- baths - beds |
show details |
| Photo | Address | Area | Beds / Baths | Price | Details |
|---|---|---|---|---|---|

|
#11
Polk St
Manchester, TN 37355
|
1,143 sq. feet
|
2 baths 3 beds |
show details | |

|
#12
N West St
Decherd, TN 37324
|
2,528 sq. feet
|
2 baths 3 beds |
show details | |

|
#13
Westwood Ln
Estill Springs, TN 37330
|
1,664 sq. feet
|
1 baths 3 beds |
show details | |

|
#14
Mccormick St
Manchester, TN 37355
|
1,402 sq. feet
|
1 baths 3 beds |
show details | |

|
#15
Druid Ln
Tullahoma, TN 37388
|
1,599 sq. feet
|
1 baths 3 beds |
show details | |

|
#16
W Market St
Decherd, TN 37324
|
1,100 sq. feet
|
1 baths - beds |
show details | |

|
#17
Sunset Vw
Estill Springs, TN 37330
|
1,325 sq. feet
|
1 baths - beds |
show details | |

|
#18
Pleasant View Dr
Winchester, TN 37398
|
1,148 sq. feet
|
1 baths - beds |
show details | |

|
#19
A Petty Rd
Manchester, TN 37355
|
2,139 sq. feet
|
1 baths - beds |
show details | |

|
#20
Trent Ln
Manchester, TN 37355
|
1,248 sq. feet
|
2 baths - beds |
show details |
| Photo | Address | Area | Beds / Baths | Price | Details |
|---|---|---|---|---|---|

|
#21
Flowertown Rd
Normandy, TN 37360
|
916 sq. feet
|
1 baths - beds |
show details | |

|
#22
Westwood Dr
Tullahoma, TN 37388
|
2,656 sq. feet
|
2 baths - beds |
show details | |

|
#23
Old Estill Springs Rd
Tullahoma, TN 37388
|
1,300 sq. feet
|
1 baths - beds |
show details | |

|
#24
E Warren St
Tullahoma, TN 37388
|
1,028 sq. feet
|
1 baths - beds |
show details | |

|
#25
E Moore St
Tullahoma, TN 37388
|
1,152 sq. feet
|
2 baths - beds |
show details | |

|
#26
Mcgavock Pl
Tullahoma, TN 37388
|
912 sq. feet
|
1 baths - beds |
show details | |

|
#27
Boynton Valley Rd
Manchester, TN 37355
|
1,200 sq. feet
|
2 baths - beds |
show details | |

|
#28
Mckinney St
Estill Springs, TN 37330
|
1,275 sq. feet
|
2 baths - beds |
show details | |

|
#29
Westwood Dr
Tullahoma, TN 37388
|
1,459 sq. feet
|
1 baths - beds |
show details | |

|
#30
Geneva Boynton Rd
Manchester, TN 37355
|
1,008 sq. feet
|
2 baths - beds |
show details |
| Photo | Address | Area | Beds / Baths | Price | Details |
|---|---|---|---|---|---|

|
#31
Twerp Trl
Estill Springs, TN 37330
|
1,129 sq. feet
|
2 baths - beds |
show details | |

|
#32
Shasteen St
Estill Springs, TN 37330
|
1,200 sq. feet
|
1 baths - beds |
show details | |

|
#33
Littell Cir E
Tracy City, TN 37387
|
2,012 sq. feet
|
2 baths - beds |
show details | |

|
#34
Swift Ln
Tullahoma, TN 37388
|
1,196 sq. feet
|
2 baths - beds |
show details | |

|
#35
Lynn St
Tullahoma, TN 37388
|
1,242 sq. feet
|
1 baths - beds |
show details | |

|
#36
Anthony Mill Rd
Tullahoma, TN 37388
|
912 sq. feet
|
1 baths - beds |
show details | |

|
#37
Gowen Rd
Manchester, TN 37355
|
1,440 sq. feet
|
1 baths - beds |
show details | |

|
#38
N Summit St
Tullahoma, TN 37388
|
960 sq. feet
|
1 baths - beds |
show details | |

|
#39
Crestwood Dr
Tullahoma, TN 37388
|
1,425 sq. feet
|
1 baths - beds |
show details | |

|
#40
Powell St
Decherd, TN 37324
|
1,064 sq. feet
|
2 baths - beds |
show details |
| Photo | Address | Area | Beds / Baths | Price | Details |
|---|---|---|---|---|---|

|
#41
Westside Dr
Tullahoma, TN 37388
|
1,248 sq. feet
|
1 baths - beds |
show details | |

|
#42
Rebecca Dr
Manchester, TN 37355
|
1,304 sq. feet
|
2 baths - beds |
show details | |

|
#43
Boynton Valley Rd
Manchester, TN 37355
|
1,853 sq. feet
|
1 baths - beds |
show details | |

|
#44
Skyview Ln
Tullahoma, TN 37388
|
1,466 sq. feet
|
2 baths - beds |
show details | |

|
#45
Central Ave
Tullahoma, TN 37388
|
800 sq. feet
|
1 baths - beds |
show details | |

|
#46
W Broad St
Decherd, TN 37324
|
1,568 sq. feet
|
1 baths - beds |
show details | |

|
#47
Mckellar Dr
Tullahoma, TN 37388
|
1,560 sq. feet
|
2 baths - beds |
show details | |

|
#48
Spring St
Decherd, TN 37324
|
1,480 sq. feet
|
1 baths - beds |
show details | |

|
#49
Hope Dr
Estill Springs, TN 37330
|
1,305 sq. feet
|
2 baths - beds |
show details | |

|
Check over 1 million property listings on Foreclosure.com!
|
browse all offers | |||


Household type by relationship:
Households: 52,239- In family households: 44,565 (10,394 male householders, 4,124 female householders)
10,786 spouses, 14,768 children (13,298 natural, 372 adopted, 1,098 stepchildren), 1,491 grandchildren, 374 brothers or sisters, 383 parents, foster children, 573 other relatives, 1,347 non-relatives
- In nonfamily households: 7,674 (2,966 male householders (2,341 living alone)), 3,442 female householders (3,084 living alone)), 1,266 nonrelatives
- In group quarters: 557 (498 institutionalized population)
8,097 married couples with children.
2,731 single-parent households (656 men, 2,075 women).
98.2% of residents of Hillsboro speak English at home.
0.5% of residents speak Spanish at home (47% speak English very well, 53% speak English not well).
0.7% of residents speak other Indo-European language at home (100% speak English very well).
0.5% of residents speak Asian or Pacific Island language at home (37% speak English very well, 63% speak English well).
Foreign born population: 98 (2.3%)
(82.7% of them are naturalized citizens)
| Here: | 6.3 |
| State: | 6.5 |
| Here: | 6.1 |
| State: | 4.4 |

- Bedrooms in owner-occupied houses and condos in Hillsboro, Tennessee
- 12no bedroom
- 271 bedroom
- 1952 bedrooms
- 7203 bedrooms
- 1354 bedrooms
- 495+ bedrooms

- Bedrooms in renter-occupied apartments in Hillsboro, Tennessee
- 0no bedroom
- 161 bedroom
- 732 bedrooms
- 1453 bedrooms
- 54 bedrooms
- 05+ bedrooms

- Cars and other vehicles available in Hillsboro in owner-occupied houses/condos
- 31no vehicle
- 1921 vehicle
- 4802 vehicles
- 3083 vehicles
- 1174 vehicles
- 105+ vehicles

- Cars and other vehicles available in Hillsboro in renter-occupied apartments
- 20no vehicle
- 981 vehicle
- 762 vehicles
- 353 vehicles
- 04 vehicles
- 105+ vehicles

- Rooms in owner-occupied houses in Hillsboro, Tennessee
- 01 room
- 02 rooms
- 383 rooms
- 1084 rooms
- 2985 rooms
- 3366 rooms
- 1577 rooms
- 658 rooms
- 1369+ rooms

- Rooms in renter-occupied apartments in Hillsboro, Tennessee
- 01 room
- 92 rooms
- 203 rooms
- 294 rooms
- 935 rooms
- 566 rooms
- 217 rooms
- 118 rooms
- 09+ rooms


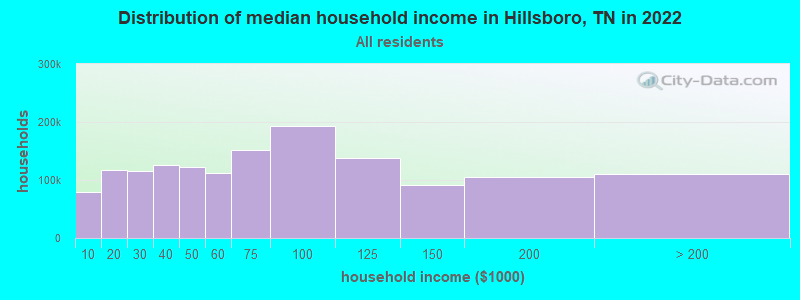
Hillsboro, TN household income distribution

- 52,607Less than $10,000
- 88,238$10,000 to $19,999
- 83,681$20,000 to $29,999
- 85,561$30,000 to $39,999
- 82,727$40,000 to $49,999
- 76,570$50,000 to $59,999
- 104,395$60,000 to $74,999
- 133,064$75,000 to $99,999
- 99,517$100,000 to $124,999
- 59,277$125,000 to $149,999
- 65,062$150,000 to $199,999
- 55,000$200,000 or more
Percentage of workers working in this county: 71.4%
Number of people working at home: 181 (9.8% of all workers)
Travel time to work (commute)
- Less than 5 minutes: 28
- 5 to 9 minutes: 82
- 10 to 14 minutes: 283
- 15 to 19 minutes: 292
- 20 to 24 minutes: 286
- 25 to 29 minutes: 96
- 30 to 34 minutes: 221
- 35 to 39 minutes: 52
- 40 to 44 minutes: 19
- 45 to 59 minutes: 105
- 60 to 89 minutes: 110
- 90 or more minutes: 47
Means of transportation to work:
- Drove a car alone: 1,358 (82.5%)
- Carpooled: 208 (12.6%)
- Bicycle: 10 (0.6%)
- Walked: 14 (0.9%)
- Other means: 31 (1.9%)
- Worked at home: 26 (1.6%)


- Year of entry for the foreign-born population in Hillsboro, Tennessee
- 01995 to March 2000
- 91990 to 1994
- 71985 to 1989
- 91980 to 1984
- 61975 to 1979
- 131970 to 1974
- 01965 to 1969
- 4Before 1965
Most common places of birth for foreign-born residents (%):
| Hillsboro: | 20.8% (10) |
| Tennessee: | 5.2% (8,316) |
| Hillsboro: | 18.8% (9) |
| Tennessee: | 1.1% (1,694) |
| Hillsboro: | 18.8% (9) |
| Tennessee: | 2.3% (3,669) |
| Hillsboro: | 18.8% (9) |
| Tennessee: | 28.1% (44,682) |
| Hillsboro: | 14.6% (7) |
| Tennessee: | 2.6% (4,078) |
| Hillsboro: | 8.3% (4) |
| Tennessee: | 0.3% (481) |
Place of birth for U.S.-born residents:
- This state: 2,897
- Other state: 799
- Northeast: 127
- Midwest: 270
- South: 351
- West: 51
65% of Hillsboro residents lived in the same house 5 years ago.
Out of people who lived in different houses, 59% lived in this county.
Out of people who lived in different counties, 74% lived in Tennessee.
Education attainment for males 25 years and older:
- No schooling: 18
- Nursery to 4th grade: 13
- 5th and 6th grade: 36
- 7th and 8th grade: 87
- 9th grade: 38
- 10th grade: 117
- 11th grade: 28
- 12th grade, no diploma: 47
- High school graduate (or equivalency): 512
- Less than 1 year of college: 61
- Some college more than 1 year, no degree: 119
- Associate degree: 27
- Bachelor's degree: 86
- Master's degree: 12
- Professional school degree: 0
- Doctorate degree: 19

Education attainment for females 25 years and older:
- No schooling: 6
- Nursery to 4th grade: 0
- 5th and 6th grade: 11
- 7th and 8th grade: 121
- 9th grade: 84
- 10th grade: 101
- 11th grade: 58
- 12th grade, no diploma: 33
- High school graduate (or equivalency): 430
- Less than 1 year of college: 72
- Some college more than 1 year, no degree: 133
- Associate degree: 46
- Bachelor's degree: 135
- Master's degree: 34
- Professional school degree: 6
- Doctorate degree: 0


Housing units in structures:
- One, detached: 1,075
- Two: 18
- Mobile homes: 400
Median worth of mobile homes: $87,778
Housing units lacking complete kitchen facilities: 0.2%

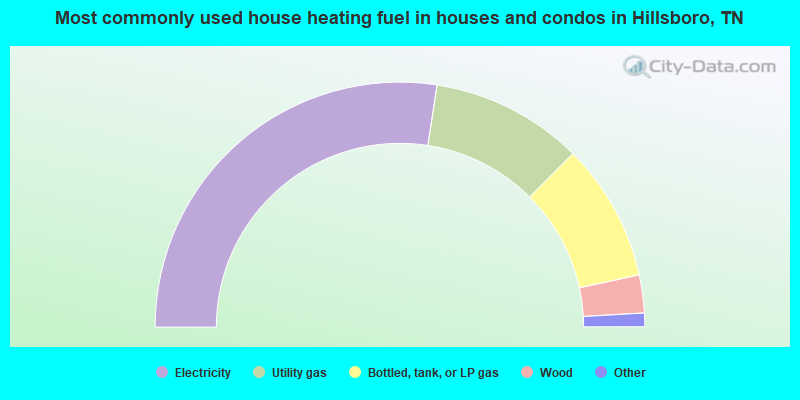
- 54.8%Electricity
- 20.1%Utility gas
- 18.2%Bottled, tank, or LP gas
- 5.0%Wood
- 1.2%Fuel oil, kerosene, etc.
- 0.6%Other fuel
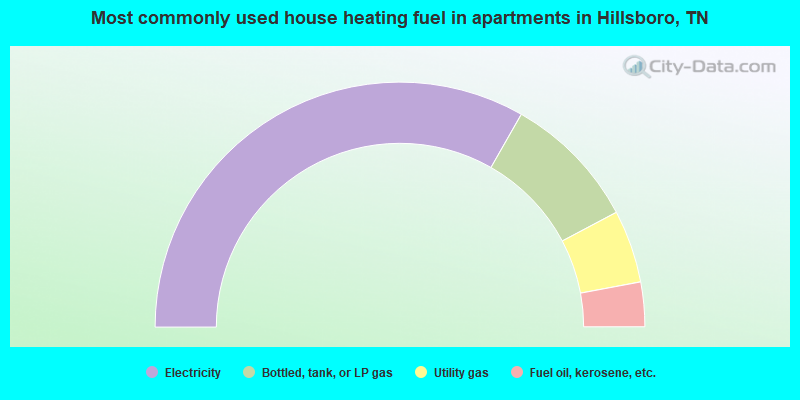
- 66.5%Electricity
- 18.0%Bottled, tank, or LP gas
- 9.6%Utility gas
- 5.9%Fuel oil, kerosene, etc.
Private vs. public school enrollment:
| Here: | 5.8% |
| Tennessee: | 9.5% |
| Here: | 1.8% |
| Tennessee: | 10.4% |
| Here: | 0.0% |
| Tennessee: | 22.8% |


