Hillsborough, CA (California) Houses and Residents
| Hillsborough: | over $2,201,486 |
| California: | $715,900 |
Mean price in 2022:
Detached houses: $5,707,490
Here: $5,707,490 State: $988,808 Townhouses or other attached units: $7,919,386
Here: $7,919,386 State: $838,546
Total population: 11,413 (Urban population: 10,823, Rural population: 0)
Houses: 3,827 (3,522 occupied: 3,239 owner occupied, 214 renter occupied)
| % of renters here: | 6% |
| State: | 44% |
Housing density: 615 houses/condos per square mile
Median price asked for vacant for-sale houses and condos in 2022: $4,662,143.
Median contract rent in 2022: over $2,000
Median rent asked for vacant for-rent units in 2022: $32,664
Median gross rent in Hillsborough, CA in 2022: over $2,000
Housing units in Hillsborough with a mortgage: 2,009 (357 second mortgage, 41 home equity loan, 325 both second mortgage and home equity loan)
Houses without a mortgage: 0
Median household income for houses/condos with a mortgage: $258,196
Median household income for apartments without a mortgage: $244,299
Median monthly housing costs: $3,819
Compare current foreclosures near Hillsborough, CA:
| Photo | Address | Area | Beds / Baths | Price | Details |
|---|---|---|---|---|---|

|
#1
Macarthur Blvd
Oakland, CA 94605
|
1,313 sq. feet
|
3 baths 3 beds |
$590,000
|
show details |

|
#2
Wickman Pl
San Lorenzo, CA 94580
|
900 sq. feet
|
1 baths 2 beds |
show details | |

|
#3
Van Ness Ave Apt 211
San Francisco, CA 94102
|
558 sq. feet
|
1 baths 1 beds |
show details | |

|
#4
Lorenzo Ave
San Lorenzo, CA 94580
|
1,937 sq. feet
|
1 baths 3 beds |
show details | |

|
#5
3rd St Apt 808
San Francisco, CA 94107
|
807 sq. feet
|
1 baths 3 beds |
show details | |

|
#6
Hemlock Ave
Redwood City, CA 94061
|
1,440 sq. feet
|
2 baths 4 beds |
show details | |

|
#7
Alameda De Las Pulgas
Redwood City, CA 94061
|
1,250 sq. feet
|
2 baths 3 beds |
show details | |

|
#8
Manor Dr
Pacifica, CA 94044
|
1,360 sq. feet
|
2 baths 3 beds |
show details | |

|
#9
Cymbidium Cir
South San Francisco, CA 94080
|
1,610 sq. feet
|
2 baths 3 beds |
show details | |

|
#10
Jouett Sq
Alameda, CA 94501
|
3,179 sq. feet
|
2 baths 3 beds |
show details |
| Photo | Address | Area | Beds / Baths | Price | Details |
|---|---|---|---|---|---|

|
#11
F St
Oakland, CA 94603
|
842 sq. feet
|
1 baths 2 beds |
show details | |

|
#12
Nevada St
Oakland, CA 94603
|
782 sq. feet
|
1 baths 2 beds |
show details | |

|
#13
70th Ave
Oakland, CA 94621
|
954 sq. feet
|
1 baths 3 beds |
show details | |

|
#14
Fleetwood Dr
San Bruno, CA 94066
|
1,440 sq. feet
|
3 baths 5 beds |
show details | |

|
#15
76th Ave
Oakland, CA 94621
|
912 sq. feet
|
1 baths 2 beds |
show details | |

|
#16
Balboa St
San Francisco, CA 94118
|
2,410 sq. feet
|
1 baths 3 beds |
show details | |

|
#17
Mirada Rd
Half Moon Bay, CA 94019
|
2,450 sq. feet
|
4 baths 4 beds |
show details | |

|
#18
86th Ave
Oakland, CA 94621
|
835 sq. feet
|
1 baths 2 beds |
show details | |

|
#19
Chestnut St
San Carlos, CA 94070
|
1,390 sq. feet
|
2 baths 3 beds |
show details | |

|
#20
Marcella St
San Leandro, CA 94578
|
1,426 sq. feet
|
1 baths 3 beds |
show details |
| Photo | Address | Area | Beds / Baths | Price | Details |
|---|---|---|---|---|---|

|
#21
101st Ave
Oakland, CA 94603
|
1,134 sq. feet
|
2 baths 3 beds |
show details | |

|
#22
Hempstead Pl
Redwood City, CA 94061
|
1,020 sq. feet
|
1 baths 3 beds |
show details | |

|
#23
7th Ave
Menlo Park, CA 94025
|
1,689 sq. feet
|
2 baths 3 beds |
show details | |

|
#24
72nd Ave
Oakland, CA 94621
|
1,170 sq. feet
|
2 baths 3 beds |
show details | |

|
#25
Holloway Ave
San Francisco, CA 94132
|
1,110 sq. feet
|
5 baths 1 beds |
show details | |

|
#26
Quesada Ave
San Francisco, CA 94124
|
2,220 sq. feet
|
4 baths 10 beds |
show details | |

|
#27
Cayuga Ave
San Francisco, CA 94112
|
1,340 sq. feet
|
1 baths 3 beds |
show details | |

|
#28
Lobos St
San Francisco, CA 94112
|
750 sq. feet
|
1 baths 2 beds |
show details | |

|
#29
Minerva St
San Francisco, CA 94112
|
878 sq. feet
|
1 baths 2 beds |
show details | |

|
#30
Sevier Ave
Menlo Park, CA 94025
|
1,030 sq. feet
|
1 baths 3 beds |
show details |
| Photo | Address | Area | Beds / Baths | Price | Details |
|---|---|---|---|---|---|

|
#31
Madrid St
San Francisco, CA 94112
|
1,018 sq. feet
|
1 baths 4 beds |
show details | |

|
#32
Byxbee St
San Francisco, CA 94132
|
800 sq. feet
|
1 baths 1 beds |
show details | |

|
#33
Saratoga Ave
Palo Alto, CA 94303
|
750 sq. feet
|
1 baths 3 beds |
show details | |

|
#34
Burke Dr
Hayward, CA 94544
|
1,193 sq. feet
|
1 baths 3 beds |
show details | |

|
#35
Page St
San Francisco, CA 94117
|
- sq. feet
|
4 baths 7 beds |
show details | |

|
#36
Munich St
San Francisco, CA 94112
|
1,103 sq. feet
|
1 baths 2 beds |
show details | |

|
#37
Hollister Ave
San Francisco, CA 94124
|
1,000 sq. feet
|
3 baths 5 beds |
show details | |

|
#38
Harkness Ave
San Francisco, CA 94134
|
1,412 sq. feet
|
2 baths 3 beds |
show details | |

|
#39
Vermont St
San Francisco, CA 94107
|
1,520 sq. feet
|
2 baths 2 beds |
show details | |

|
#40
Endicott St
San Leandro, CA 94579
|
1,164 sq. feet
|
1 baths 2 beds |
show details |
| Photo | Address | Area | Beds / Baths | Price | Details |
|---|---|---|---|---|---|

|
#41
Lorenzo Ave
San Lorenzo, CA 94580
|
2,037 sq. feet
|
2 baths 2 beds |
show details | |

|
#42
31st Ave
San Francisco, CA 94116
|
1,115 sq. feet
|
1 baths 2 beds |
show details | |

|
#43
-1725 7th Ave
San Francisco, CA 94122
|
2,376 sq. feet
|
2 baths 4 beds |
show details | |

|
#44
Cedar Ct
Daly City, CA 94014
|
1,200 sq. feet
|
2 baths 3 beds |
show details | |

|
#45
109th Ave
Oakland, CA 94603
|
998 sq. feet
|
1 baths 2 beds |
show details | |

|
#46
Vienna St
San Francisco, CA 94112
|
760 sq. feet
|
1 baths 3 beds |
show details | |

|
#47
100th Ave
Oakland, CA 94603
|
1,728 sq. feet
|
1 baths 2 beds |
show details | |

|
#48
83rd Ave
Oakland, CA 94621
|
1,304 sq. feet
|
1 baths 3 beds |
show details | |

|
#49
Greenwich St Apt 3
San Francisco, CA 94109
|
998 sq. feet
|
1 baths 1 beds |
show details | |

|
Check over 1 million property listings on Foreclosure.com!
|
browse all offers | |||

Latest news about housing in Hillsborough, CA collected exclusively by city-data.com from local newspapers, TV, and radio stations


Median year apartment built: 1968
Household type by relationship:
Households: 10,883- Male householders: 1,777 (115 living alone), Female householders: 1,589 (208 living alone)
2,727 spouses (2,674 opposite-sex spouses), 17 unmarried partners, (17 opposite-sex unmarried partners), 3,821 children (3,698 natural, 103 adopted, 19 stepchildren), 124 grandchildren, 128 brothers or sisters, 252 parents, 0 foster children, 81 other relatives, 357 non-relatives
- In group quarters: 5
Size of family households: 1,028 2-persons, 573 3-persons, 861 4-persons, 290 5-persons, 112 6-persons, 15 7-or-more-persons.
Size of nonfamily households: 366 1-person, 50 2-persons, 17 3-persons.
2,532 married couples with children.
143 single-parent households (75 men, 68 women).
65.1% of residents of Hillsborough speak English at home.
3.5% of residents speak Spanish at home (90% speak English very well, 8% speak English well, 2% speak English not well).
7.8% of residents speak other Indo-European language at home (95% speak English very well, 3% speak English well, 2% speak English not well).
21.9% of residents speak Asian or Pacific Island language at home (72% speak English very well, 20% speak English well, 5% speak English not well, 3% don't speak English at all).
1.9% of residents speak other language at home (100% speak English very well).
Foreign born population: 2,887 (26.5%)
(77.1% of them are naturalized citizens)
| Here: | 10.2 |
| State: | 6.0 |
| Here: | 7.6 |
| State: | 3.9 |

- Bedrooms in owner-occupied houses and condos in Hillsborough, California
- 0no bedroom
- 71 bedroom
- 722 bedrooms
- 4843 bedrooms
- 1,6514 bedrooms
- 1,0255+ bedrooms

- Bedrooms in renter-occupied apartments in Hillsborough, California
- 9no bedroom
- 01 bedroom
- 242 bedrooms
- 323 bedrooms
- 854 bedrooms
- 645+ bedrooms

- Cars and other vehicles available in Hillsborough in owner-occupied houses/condos
- 67no vehicle
- 3001 vehicle
- 1,1882 vehicles
- 1,0233 vehicles
- 4594 vehicles
- 2015+ vehicles

- Cars and other vehicles available in Hillsborough in renter-occupied apartments
- 0no vehicle
- 431 vehicle
- 352 vehicles
- 853 vehicles
- 434 vehicles
- 95+ vehicles

- Rooms in owner-occupied houses in Hillsborough, California
- 01 room
- 02 rooms
- 03 rooms
- 1054 rooms
- 995 rooms
- 2376 rooms
- 3467 rooms
- 5668 rooms
- 1,8869+ rooms

- Rooms in renter-occupied apartments in Hillsborough, California
- 01 room
- 92 rooms
- 03 rooms
- 44 rooms
- 115 rooms
- 346 rooms
- 357 rooms
- 508 rooms
- 729+ rooms


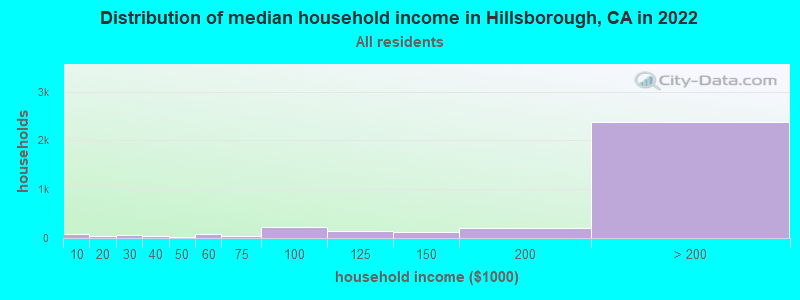
Hillsborough, CA household income distribution

- 79Less than $10,000
- 43$10,000 to $19,999
- 58$20,000 to $29,999
- 42$30,000 to $39,999
- 22$40,000 to $49,999
- 73$50,000 to $59,999
- 50$60,000 to $74,999
- 228$75,000 to $99,999
- 138$100,000 to $124,999
- 113$125,000 to $149,999
- 214$150,000 to $199,999
- 2,377$200,000 or more
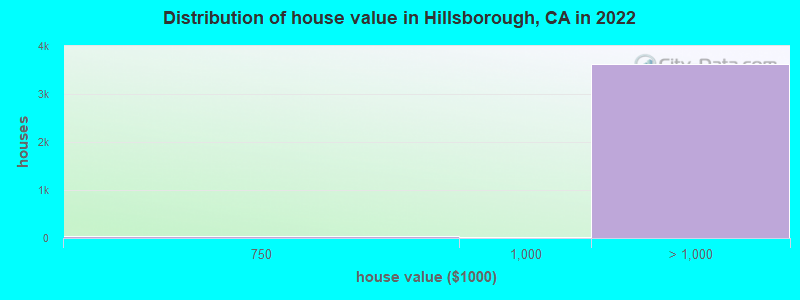
Home value of owner - occupied houses in 2022 in Hillsborough, CA
-
- 13Less than $10,000
- 13$10,000 to $14,999
- 6$200,000 to $249,999
- 6$400,000 to $499,999
- 33$500,000 to $749,999
- 15$750,000 to $999,999
- 23$1,000,000 to $1,499,999
- 97$1,500,000 to $1,999,999
- 3,505$2,000,000 or more
Rent paid by renters in 2022 in Hillsborough, CA
-
- 18$500 to $549
- 11$1,500 to $1,999
- 2$2,500 to $2,999
- 49$3,500 or more
- 139No cash rent


Percentage of workers working in this county: 72.7%
Number of people working at home: 1,710 (36.6% of all workers)
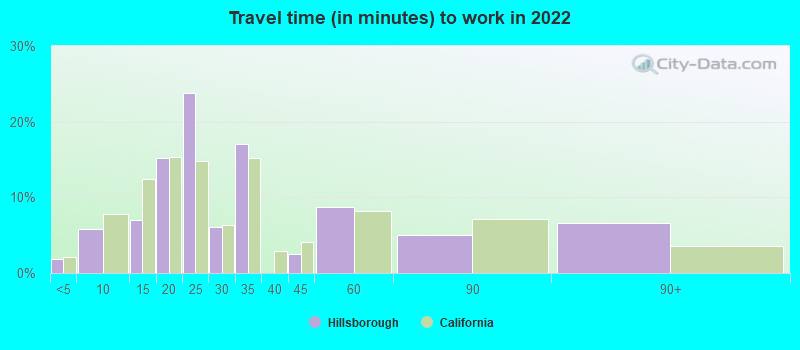
Travel time to work (commute)
- Less than 5 minutes: 56
- 5 to 9 minutes: 177
- 10 to 14 minutes: 387
- 15 to 19 minutes: 614
- 20 to 24 minutes: 300
- 25 to 29 minutes: 168
- 30 to 34 minutes: 484
- 35 to 39 minutes: 311
- 40 to 44 minutes: 129
- 45 to 59 minutes: 234
- 60 to 89 minutes: 181
- 90 or more minutes: 71
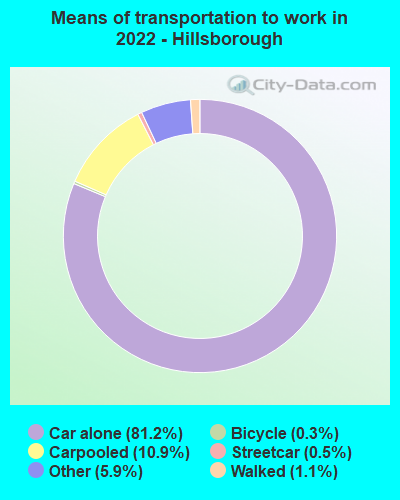
Means of transportation to work:
- Drove a car alone: 1,384 (43.8%)
- Carpooled: 204 (6.4%)
- Subway or elevated rail: 7 (0.2%)
- Taxi: 82 (2.6%)
- Bicycle: 6 (0.2%)
- Walked: 22 (0.7%)
- Worked at home: 1,710 (54.1%)

- Unemployment by race in 2022
- Unemployment rate for White non-Hispanic residents
- 5.9%Males
- 2.4%Females
- Unemployment rate for Asian residents
- 1.7%Males
- 4.2%Females
- Unemployment rate for other race residents
- 55.3%Males
- Unemployment rate for two or more race residents
- 2.8%Males

- Year of entry for the foreign-born population in Hillsborough, California
- 3932010 or later
- 3652000 to 2009
- 5091990 to 1999
- 5541980 to 1989
- 7361970 to 1979
- 883Before 1970

First ancestries reported:
- English: 333 (5.9%)
- Irish: 253 (4.5%)
- German: 217 (3.8%)
- Italian: 215 (3.8%)
- European: 167 (3.0%)
- American: 153 (2.7%)
- Iranian: 108 (1.9%)
- Eastern European: 58 (1.0%)
- Polish: 36 (0.6%)
- Hungarian: 31 (0.5%)
- Lebanese: 28 (0.5%)
- Israeli: 23 (0.4%)
- Egyptian: 21 (0.4%)
- Portuguese: 21 (0.4%)
- Scottish: 21 (0.4%)
- French: 19 (0.3%)
- Lithuanian: 17 (0.3%)
- Danish: 17 (0.3%)
- British: 16 (0.3%)
- Norwegian: 16 (0.3%)
- Northern European: 12 (0.2%)
- Scandinavian: 12 (0.2%)
- Serbian: 12 (0.2%)
- Basque: 11 (0.2%)
- Assyrian: 10 (0.2%)
- Romanian: 10 (0.2%)
- Ukrainian: 10 (0.2%)
- Brazilian: 9 (0.2%)
- Greek: 9 (0.2%)
- Dutch: 9 (0.2%)
- Swiss: 9 (0.2%)
- Belgian: 7 (0.1%)
- Russian: 7 (0.1%)
- Slovak: 7 (0.1%)
- Australian: 6 (0.1%)
- Armenian: 5 (0.09%)
Most common places of birth for foreign-born residents (%):
| Hillsborough: | 28.2% (826) |
| California: | 6.6% (684,672) |
| Hillsborough: | 7.8% (228) |
| California: | 5.2% (539,184) |
| Hillsborough: | 7.3% (212) |
| California: | 1.7% (176,274) |
| Hillsborough: | 6.5% (189) |
| California: | 7.8% (818,297) |
| Hillsborough: | 6.5% (189) |
| California: | 1.0% (105,215) |
| Hillsborough: | 5.1% (150) |
| California: | 0.6% (60,761) |
| Hillsborough: | 3.3% (97) |
| California: | 2.0% (206,004) |
| Hillsborough: | 3.2% (93) |
| California: | 3.0% (315,248) |
| Hillsborough: | 2.7% (78) |
| California: | 0.1% (5,897) |
| Hillsborough: | 2.3% (67) |
| California: | 1.0% (103,575) |
| Hillsborough: | 2.1% (61) |
| California: | 0.5% (55,249) |
| Hillsborough: | 2.0% (59) |
| California: | 0.1% (11,157) |
| Hillsborough: | 1.9% (57) |
| California: | 0.7% (74,025) |
| Hillsborough: | 1.6% (46) |
| California: | 0.6% (65,335) |
| Hillsborough: | 1.5% (45) |
| California: | 4.9% (512,335) |
| Hillsborough: | 1.5% (44) |
| California: | 1.2% (127,477) |
Place of birth for U.S.-born residents:
- This state: 5,802
- Other state: 2,014
- Northeast: 589
- Midwest: 787
- South: 256
- West: 388
90.8% of Hillsborough residents lived in the same house 1 years ago.
Out of people who lived in different houses, 40.9% lived in this county.
Out of people who lived in different counties, 77.4% lived in California.
| Hillsborough: | 90.8% |
| State average: | 88.9% |
Education attainment for males 25 years and older:
- No schooling: 16
- Nursery to 4th grade: 6
- 5th and 6th grade: 0
- 7th and 8th grade: 0
- 9th grade: 0
- 10th grade: 0
- 11th grade: 0
- 12th grade, no diploma: 0
- High school graduate (or equivalency): 117
- Less than 1 year of college: 55
- Some college more than 1 year, no degree: 133
- Associate degree: 94
- Bachelor's degree: 1,098
- Master's degree: 1,180
- Professional school degree: 682
- Doctorate degree: 293

Education attainment for females 25 years and older:
- No schooling: 29
- Nursery to 4th grade: 0
- 5th and 6th grade: 3
- 7th and 8th grade: 28
- 9th grade: 0
- 10th grade: 9
- 11th grade: 0
- 12th grade, no diploma: 26
- High school graduate (or equivalency): 170
- Less than 1 year of college: 85
- Some college more than 1 year, no degree: 260
- Associate degree: 183
- Bachelor's degree: 1,356
- Master's degree: 1,000
- Professional school degree: 535
- Doctorate degree: 139


Housing units in structures:
- One, detached: 3,769
- One, attached: 57
Housing units lacking complete kitchen facilities in 2022: 0.6%
House/condo owner moved in on average 15 years ago
Renter moved in on average 10 years ago

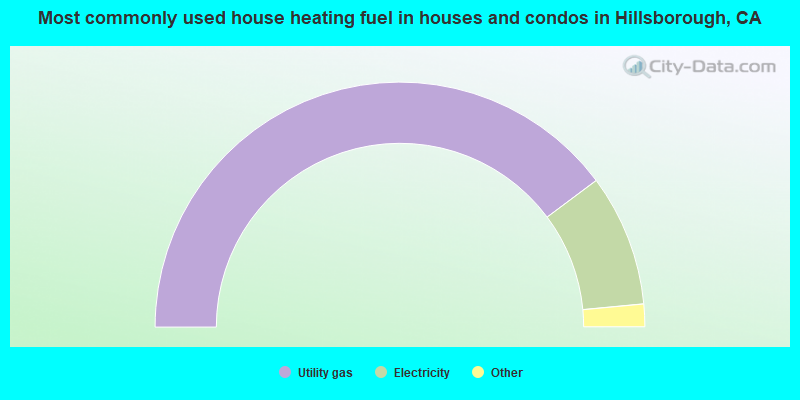
- 79.6%Utility gas
- 17.4%Electricity
- 1.7%Solar energy
- 1.3%Bottled, tank, or LP gas
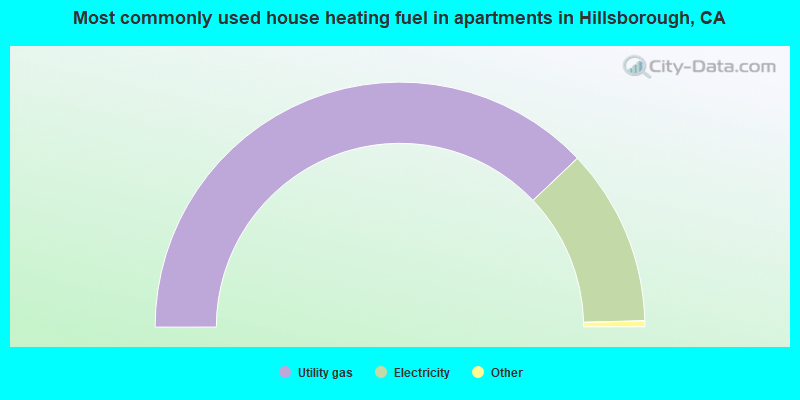
- 76.4%Utility gas
- 23.6%Electricity
Private vs. public school enrollment:
| Here: | 20.8% |
| California: | 10.5% |
| Here: | 48.3% |
| California: | 8.5% |
| Here: | 45.0% |
| California: | 15.9% |


