Hillsdale, MI (Michigan) Houses and Residents
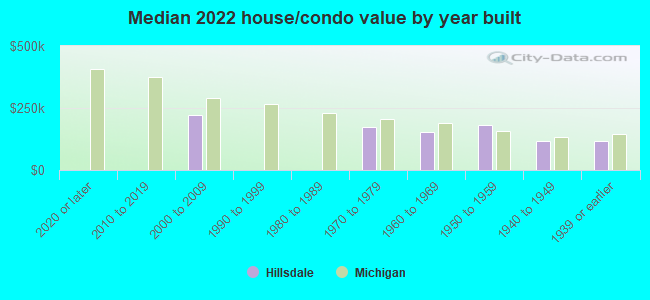
| Hillsdale: | $129,775 |
| Michigan: | $224,400 |
Mean price in 2022:
Detached houses: $155,632
Here: $155,632 State: $280,038 Townhouses or other attached units: $251,835
Here: $251,835 State: $239,520 Mobile homes: $200,358
Here: $200,358 State: $72,868
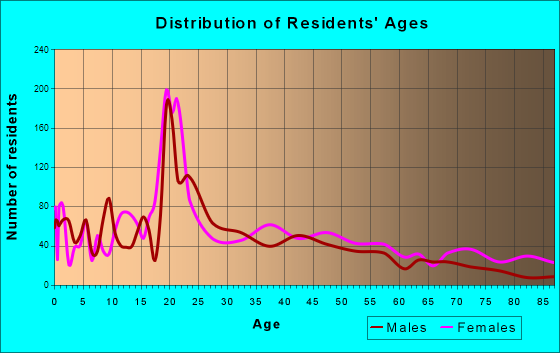
Total population: 8,149 (Urban population: 7,841 (all inside urban clusters), Rural population: 471 (all nonfarm))
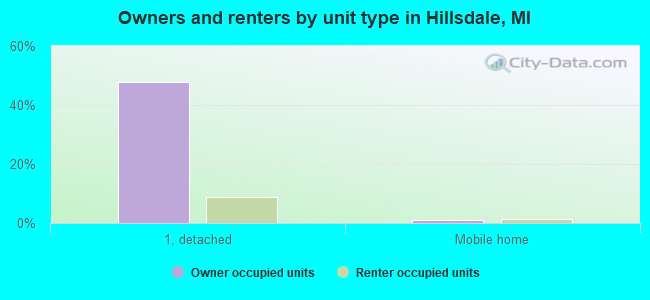
Houses: 3,046 (2,734 occupied: 1,423 owner occupied, 1,351 renter occupied)
| % of renters here: | 49% |
| State: | 27% |
Housing density: 573 houses/condos per square mile
Median price asked for vacant for-sale houses and condos in 2022: $415,998.
Median contract rent in 2022: $628 (lower quartile is $390, upper quartile is $797)
Median rent asked for vacant for-rent units in 2022: $770
Median gross rent in Hillsdale, MI in 2022: $776
Housing units in Hillsdale with a mortgage: 964 (143 second mortgage, 0 home equity loan, 123 both second mortgage and home equity loan)
Houses without a mortgage: 0
Median household income for houses/condos with a mortgage: $65,230
Median household income for apartments without a mortgage: $71,739
Median monthly housing costs: $773
Compare current foreclosures near Hillsdale, MI:
| Photo | Address | Area | Beds / Baths | Price | Details |
|---|---|---|---|---|---|

|
#1
N Norwood Ave
Hillsdale, MI 49242
|
1,193 sq. feet
|
2 baths 3 beds |
show details | |

|
#2
E Bacon St
Hillsdale, MI 49242
|
1,188 sq. feet
|
1 baths 3 beds |
show details | |

|
#3
W Bear Lake Rd
Hillsdale, MI 49242
|
1,440 sq. feet
|
2 baths 3 beds |
show details | |

|
#4
E Bacon Rd
Hillsdale, MI 49242
|
2,028 sq. feet
|
1 baths 5 beds |
show details | |

|
#5
E Bacon Rd
Hillsdale, MI 49242
|
1,336 sq. feet
|
1 baths - beds |
show details | |

|
#6
Morry St
Hillsdale, MI 49242
|
1,044 sq. feet
|
1 baths - beds |
show details | |

|
#7
N Hillsdale Rd
Hillsdale, MI 49242
|
960 sq. feet
|
1 baths - beds |
show details | |

|
#8
W Bear Lake Rd
Hillsdale, MI 49242
|
1,512 sq. feet
|
3 baths - beds |
show details | |

|
#9
Mechanic Rd
Hillsdale, MI 49242
|
1,120 sq. feet
|
2 baths - beds |
show details | |

|
#10
Morry St
Hillsdale, MI 49242
|
935 sq. feet
|
1 baths - beds |
show details |
| Photo | Address | Area | Beds / Baths | Price | Details |
|---|---|---|---|---|---|

|
#11
Westwood Dr
Hillsdale, MI 49242
|
1,176 sq. feet
|
1 baths - beds |
show details | |

|
#12
Mauck Rd
Hillsdale, MI 49242
|
1,220 sq. feet
|
1 baths - beds |
show details | |

|
#13
Brookside Pkwy
Hillsdale, MI 49242
|
- sq. feet
|
- baths - beds |
show details | |

|
#14
Vine St
Hillsdale, MI 49242
|
- sq. feet
|
- baths - beds |
show details | |

|
#15
W Carleton Rd # 83
Hillsdale, MI 49242
|
- sq. feet
|
- baths - beds |
show details | |

|
#16
S Meridian Rd
Hudson, MI 49247
|
1,539 sq. feet
|
2 baths 3 beds |
show details | |

|
#17
French Rd
Litchfield, MI 49252
|
1,200 sq. feet
|
1 baths 3 beds |
show details | |

|
#18
Dwight St
Camden, MI 49232
|
1,184 sq. feet
|
1 baths 3 beds |
show details | |

|
#19
Long Lake Rd
Reading, MI 49274
|
1,125 sq. feet
|
1 baths 6 beds |
show details | |

|
#20
Ogden St
Osseo, MI 49266
|
1,344 sq. feet
|
2 baths 3 beds |
show details |
| Photo | Address | Area | Beds / Baths | Price | Details |
|---|---|---|---|---|---|

|
#21
E Main St
Addison, MI 49220
|
- sq. feet
|
1 baths 4 beds |
show details | |

|
#22
Cole Dr
Osseo, MI 49266
|
624 sq. feet
|
1 baths 2 beds |
show details | |

|
#23
E Mosherville Rd
Jonesville, MI 49250
|
1,448 sq. feet
|
2 baths 4 beds |
show details | |

|
#24
County Road R
Pioneer, OH 43554
|
1,972 sq. feet
|
2 baths 4 beds |
show details | |

|
#25
Durbin Rd
Camden, MI 49232
|
1,755 sq. feet
|
2 baths - beds |
show details | |

|
#26
E Territorial Rd
Camden, MI 49232
|
2,153 sq. feet
|
1 baths - beds |
show details | |

|
#27
Pleasant St
Hudson, MI 49247
|
1,365 sq. feet
|
- baths 3 beds |
show details | |

|
#28
N Main St
Camden, MI 49232
|
1,083 sq. feet
|
1 baths - beds |
show details | |

|
#29
Litchfield Rd
Litchfield, MI 49252
|
1,248 sq. feet
|
1 baths - beds |
show details | |

|
#30
Spring St
Hudson, MI 49247
|
932 sq. feet
|
- baths 4 beds |
show details |
| Photo | Address | Area | Beds / Baths | Price | Details |
|---|---|---|---|---|---|

|
#31
W Burt Rd
Camden, MI 49232
|
1,404 sq. feet
|
1 baths - beds |
show details | |

|
#32
Townley Hwy
Manitou Beach, MI 49253
|
1,582 sq. feet
|
- baths 3 beds |
show details | |

|
#33
Franklin St
Jonesville, MI 49250
|
1,116 sq. feet
|
2 baths - beds |
show details | |

|
#34
Murphy St
Jonesville, MI 49250
|
1,184 sq. feet
|
1 baths - beds |
show details | |

|
#35
Hudson Rd
Osseo, MI 49266
|
1,248 sq. feet
|
1 baths - beds |
show details | |

|
#36
N Adams Rd
North Adams, MI 49262
|
1,832 sq. feet
|
1 baths - beds |
show details | |

|
#37
Moscow Rd
Moscow, MI 49257
|
- sq. feet
|
- baths - beds |
show details | |

|
#38
Mill St
Somerset Center, MI 49282
|
- sq. feet
|
- baths - beds |
show details | |

|
#39
Hillview Dr
Cement City, MI 49233
|
- sq. feet
|
- baths - beds |
show details | |

|
#40
Cone Ct
Jonesville, MI 49250
|
- sq. feet
|
- baths - beds |
show details |
| Photo | Address | Area | Beds / Baths | Price | Details |
|---|---|---|---|---|---|

|
#41
Tripp Rd
Camden, MI 49232
|
- sq. feet
|
- baths - beds |
show details | |

|
#42
24 Mile Rd
Homer, MI 49245
|
- sq. feet
|
- baths - beds |
show details | |

|
#43
W Shore Dr
Jerome, MI 49249
|
- sq. feet
|
- baths - beds |
show details | |

|
#44
Condra Rd
Allen, MI 49227
|
- sq. feet
|
- baths - beds |
show details | |

|
#45
Cole Dr
Osseo, MI 49266
|
- sq. feet
|
- baths - beds |
show details | |

|
#46
Kelso Rd
North Adams, MI 49262
|
- sq. feet
|
- baths - beds |
show details | |

|
#47
24 Mile Rd
Homer, MI 49245
|
- sq. feet
|
- baths - beds |
show details | |

|
#48
E Territorial Rd
Camden, MI 49232
|
- sq. feet
|
- baths - beds |
show details | |

|
#49
Equestrian Way
Quincy, MI 49082
|
- sq. feet
|
- baths - beds |
show details | |

|
Check over 1 million property listings on Foreclosure.com!
|
browse all offers | |||

Latest news about housing in Hillsdale, MI collected exclusively by city-data.com from local newspapers, TV, and radio stations

 | Has SE Michigan always been so ... grungy? (74 replies) |
| Something that blew my mind tonight, Detroit isn't alone in abandonment. (32 replies) |
| Jackson Michigan article on Mlive population decline (1 reply) |
| what are some nice lakes for 2nd home near Detroit? (13 replies) |
| Hillsdale, MI (7 replies) |
| Hillsdale: The Town I loved, the Town that Died (45 replies) |
Median year apartment built: 1970
Household type by relationship:
Households: 7,986- Male householders: 1,152 (421 living alone), Female householders: 1,561 (523 living alone)
1,039 spouses (1,039 opposite-sex spouses), 229 unmarried partners, (222 opposite-sex unmarried partners), 2,064 children (1,859 natural, 96 adopted, 107 stepchildren), 29 grandchildren, 18 brothers or sisters, 63 parents, 0 foster children, 28 other relatives, 441 non-relatives
- In group quarters: 1,355
Size of family households: 706 2-persons, 208 3-persons, 220 4-persons, 224 5-persons, 91 6-persons, 46 7-or-more-persons.
Size of nonfamily households: 982 1-person, 214 2-persons, 18 3-persons, 72 4-persons, 4 5-persons.
913 married couples with children.
600 single-parent households (74 men, 526 women).
96.2% of residents of Hillsdale speak English at home.
1.2% of residents speak Spanish at home (100% speak English very well).
1.0% of residents speak other Indo-European language at home (86% speak English very well, 14% speak English not well).
0.5% of residents speak Asian or Pacific Island language at home (100% speak English very well).
0.4% of residents speak other language at home (91% speak English very well, 9% speak English well).
Foreign born population: 231 (2.9%)
(67.1% of them are naturalized citizens)
| Here: | 6.8 |
| State: | 6.5 |
| Here: | 4.3 |
| State: | 4.3 |
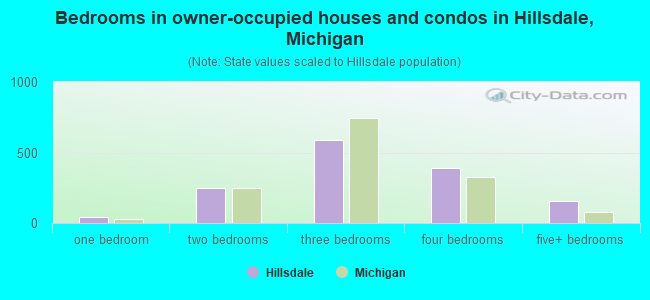
- Bedrooms in owner-occupied houses and condos in Hillsdale, Michigan
- 0no bedroom
- 421 bedroom
- 2472 bedrooms
- 5903 bedrooms
- 3894 bedrooms
- 1565+ bedrooms
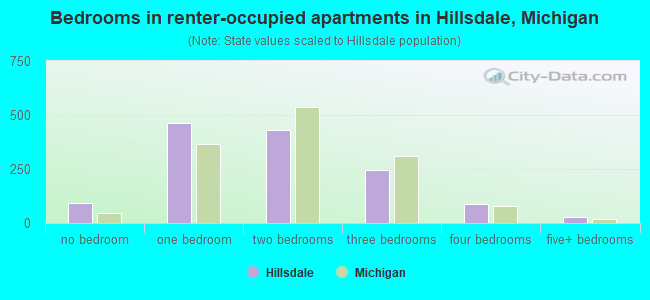
- Bedrooms in renter-occupied apartments in Hillsdale, Michigan
- 93no bedroom
- 4641 bedroom
- 4292 bedrooms
- 2473 bedrooms
- 894 bedrooms
- 305+ bedrooms
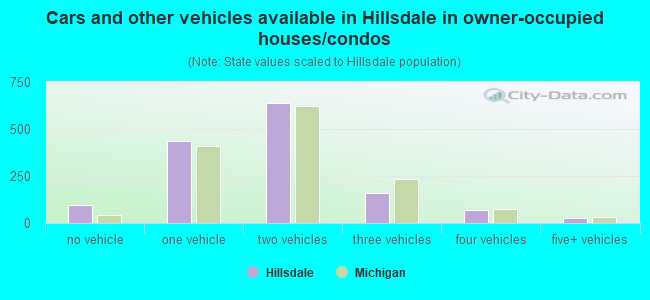
- Cars and other vehicles available in Hillsdale in owner-occupied houses/condos
- 94no vehicle
- 4361 vehicle
- 6392 vehicles
- 1613 vehicles
- 694 vehicles
- 245+ vehicles
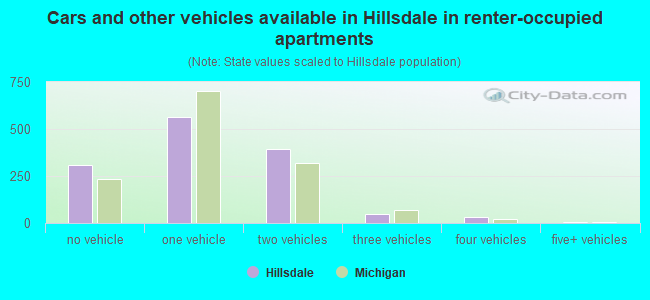
- Cars and other vehicles available in Hillsdale in renter-occupied apartments
- 311no vehicle
- 5641 vehicle
- 3932 vehicles
- 473 vehicles
- 324 vehicles
- 55+ vehicles
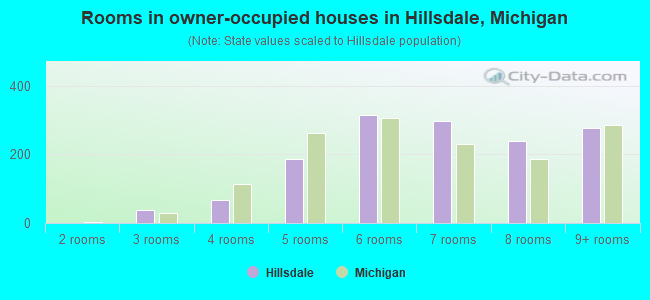
- Rooms in owner-occupied houses in Hillsdale, Michigan
- 01 room
- 02 rooms
- 383 rooms
- 684 rooms
- 1875 rooms
- 3156 rooms
- 2977 rooms
- 2408 rooms
- 2789+ rooms
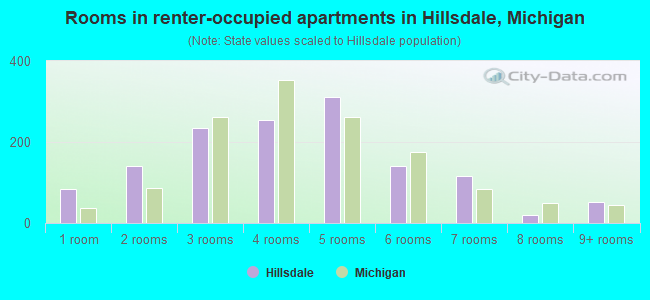
- Rooms in renter-occupied apartments in Hillsdale, Michigan
- 851 room
- 1402 rooms
- 2343 rooms
- 2544 rooms
- 3115 rooms
- 1416 rooms
- 1167 rooms
- 208 rooms
- 519+ rooms
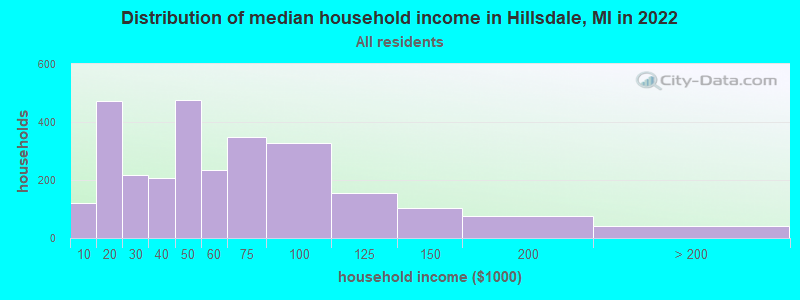
Hillsdale, MI household income distribution

- 121Less than $10,000
- 473$10,000 to $19,999
- 218$20,000 to $29,999
- 207$30,000 to $39,999
- 475$40,000 to $49,999
- 234$50,000 to $59,999
- 349$60,000 to $74,999
- 326$75,000 to $99,999
- 155$100,000 to $124,999
- 103$125,000 to $149,999
- 76$150,000 to $199,999
- 43$200,000 or more
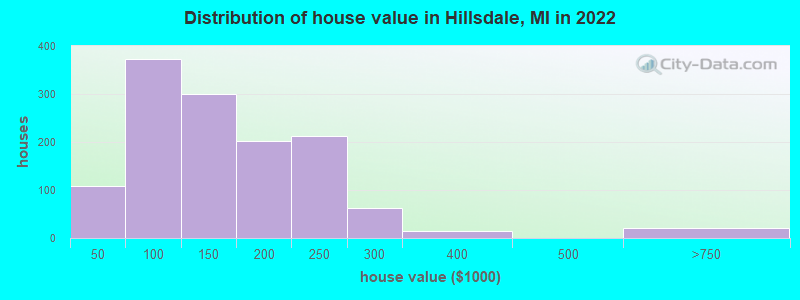
Home value of owner - occupied houses in 2022 in Hillsdale, MI
-
- 32Less than $10,000
- 13$15,000 to $19,999
- 8$20,000 to $24,999
- 29$25,000 to $29,999
- 2$30,000 to $34,999
- 8$35,000 to $39,999
- 15$40,000 to $49,999
- 30$50,000 to $59,999
- 38$60,000 to $69,999
- 76$70,000 to $79,999
- 75$80,000 to $89,999
- 136$90,000 to $99,999
- 215$100,000 to $124,999
- 84$125,000 to $149,999
- 116$150,000 to $174,999
- 86$175,000 to $199,999
- 212$200,000 to $249,999
- 63$250,000 to $299,999
- 14$300,000 to $399,999
- 14$500,000 to $749,999
- 6$750,000 to $999,999
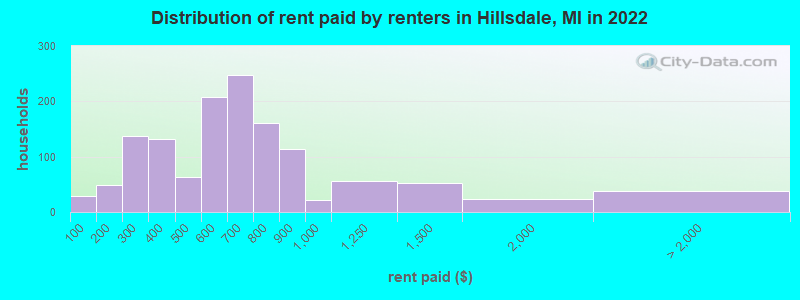
Rent paid by renters in 2022 in Hillsdale, MI
-
- 29Less than $100
- 48$150 to $199
- 102$200 to $249
- 36$250 to $299
- 57$300 to $349
- 73$350 to $399
- 33$400 to $449
- 29$450 to $499
- 141$500 to $549
- 66$550 to $599
- 75$600 to $649
- 170$650 to $699
- 66$700 to $749
- 94$750 to $799
- 113$800 to $899
- 21$900 to $999
- 55$1,000 to $1,249
- 52$1,250 to $1,499
- 22$1,500 to $1,999
- 37No cash rent
Percentage of workers working in this county: 89.7%
Number of people working at home: 388 (10.3% of all workers)
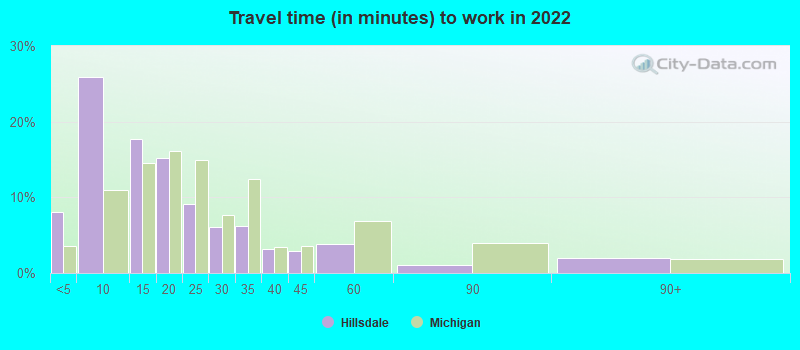
Travel time to work (commute)
- Less than 5 minutes: 491
- 5 to 9 minutes: 1,101
- 10 to 14 minutes: 596
- 15 to 19 minutes: 341
- 20 to 24 minutes: 209
- 25 to 29 minutes: 67
- 30 to 34 minutes: 309
- 35 to 39 minutes: 71
- 40 to 44 minutes: 31
- 45 to 59 minutes: 79
- 60 to 89 minutes: 56
- 90 or more minutes: 65
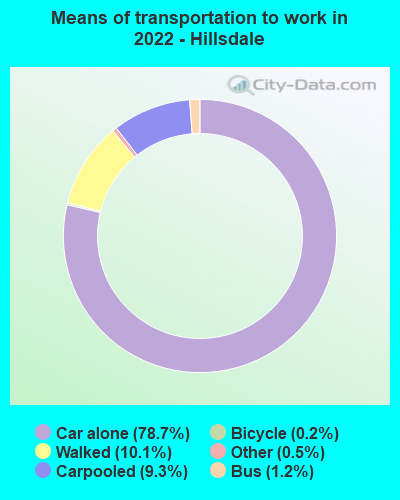
Means of transportation to work:
- Drove a car alone: 4,688 (72.1%)
- Carpooled: 557 (8.6%)
- Bus: 56 (0.9%)
- Taxi: 38 (0.6%)
- Bicycle: 16 (0.2%)
- Walked: 610 (9.4%)
- Worked at home: 388 (6.0%)
- Unemployment by race in 2022
- Unemployment rate for White non-Hispanic residents
- 1.3%Males
- 3.8%Females
- Unemployment rate for two or more race residents
- 44.1%Males
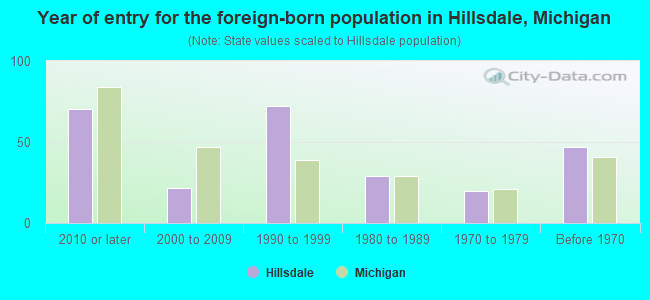
- Year of entry for the foreign-born population in Hillsdale, Michigan
- 712010 or later
- 212000 to 2009
- 721990 to 1999
- 291980 to 1989
- 201970 to 1979
- 47Before 1970
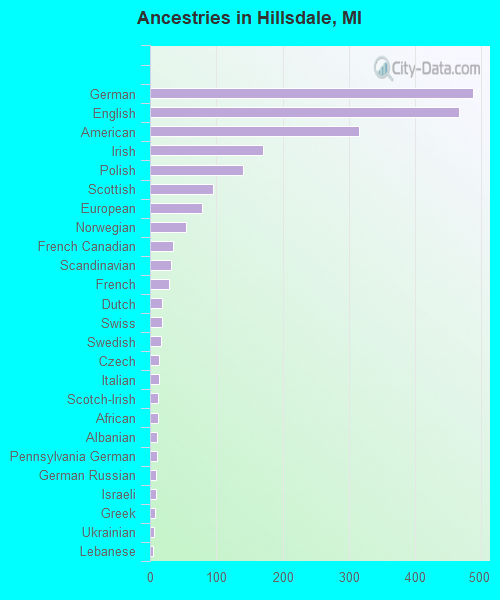
First ancestries reported:
- German: 487 (18.2%)
- English: 466 (17.4%)
- American: 315 (11.8%)
- Irish: 171 (6.4%)
- Polish: 141 (5.3%)
- Scottish: 95 (3.5%)
- European: 78 (2.9%)
- Norwegian: 55 (2.1%)
- French Canadian: 34 (1.3%)
- Scandinavian: 31 (1.2%)
- French: 29 (1.1%)
- Dutch: 18 (0.7%)
- Swiss: 18 (0.7%)
- Swedish: 16 (0.6%)
- Czech: 14 (0.5%)
- Italian: 14 (0.5%)
- Scotch-Irish: 12 (0.4%)
- African: 12 (0.4%)
- Albanian: 11 (0.4%)
- Pennsylvania German: 10 (0.4%)
- German Russian: 9 (0.3%)
- Israeli: 9 (0.3%)
- Greek: 7 (0.3%)
- Ukrainian: 6 (0.2%)
- Lebanese: 5 (0.2%)
- Eastern European: 5 (0.2%)
- Romanian: 2 (0.07%)
Most common places of birth for foreign-born residents (%):
| Hillsdale: | 38.1% (88) |
| Michigan: | 0.6% (3,969) |
| Hillsdale: | 19.9% (46) |
| Michigan: | 0.9% (6,481) |
| Hillsdale: | 10.8% (25) |
| Michigan: | 2.8% (19,112) |
| Hillsdale: | 7.4% (17) |
| Michigan: | 0.3% (1,965) |
| Hillsdale: | 4.8% (11) |
| Michigan: | 0.3% (1,942) |
| Hillsdale: | 3.5% (8) |
| Michigan: | 0.9% (6,424) |
| Hillsdale: | 3.5% (8) |
| Michigan: | 0.4% (2,721) |
| Hillsdale: | 3.0% (7) |
| Michigan: | 0.0% (307) |
Place of birth for U.S.-born residents:
- This state: 5,178
- Other state: 2,564
- Northeast: 278
- Midwest: 1,199
- South: 696
- West: 392
80.7% of Hillsdale residents lived in the same house 1 years ago.
Out of people who lived in different houses, 31.9% lived in this county.
Out of people who lived in different counties, 53.5% lived in Michigan.
| Hillsdale: | 80.7% |
| State average: | 88.4% |
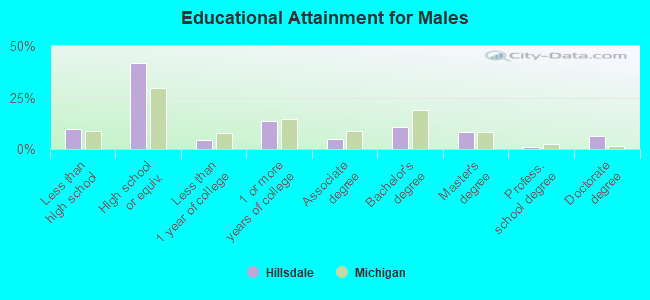
Education attainment for males 25 years and older:
- No schooling: 0
- Nursery to 4th grade: 0
- 5th and 6th grade: 0
- 7th and 8th grade: 12
- 9th grade: 30
- 10th grade: 75
- 11th grade: 48
- 12th grade, no diploma: 34
- High school graduate (or equivalency): 865
- Less than 1 year of college: 86
- Some college more than 1 year, no degree: 277
- Associate degree: 103
- Bachelor's degree: 216
- Master's degree: 170
- Professional school degree: 17
- Doctorate degree: 128
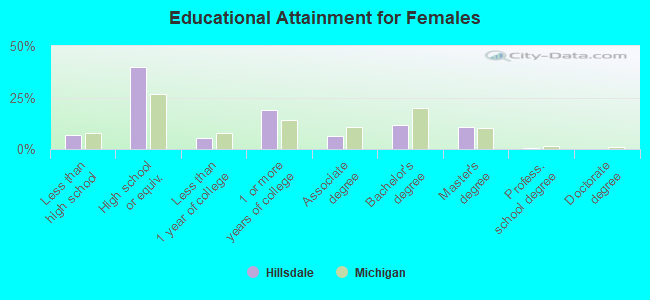
Education attainment for females 25 years and older:
- No schooling: 9
- Nursery to 4th grade: 1
- 5th and 6th grade: 0
- 7th and 8th grade: 23
- 9th grade: 6
- 10th grade: 35
- 11th grade: 44
- 12th grade, no diploma: 33
- High school graduate (or equivalency): 913
- Less than 1 year of college: 122
- Some college more than 1 year, no degree: 438
- Associate degree: 145
- Bachelor's degree: 261
- Master's degree: 249
- Professional school degree: 6
- Doctorate degree: 0
Housing units in structures:
- One, detached: 1,836
- One, attached: 36
- Two: 189
- 3 or 4: 176
- 5 to 9: 174
- 10 to 19: 188
- 20 to 49: 228
- 50 or more: 173
- Mobile homes: 42
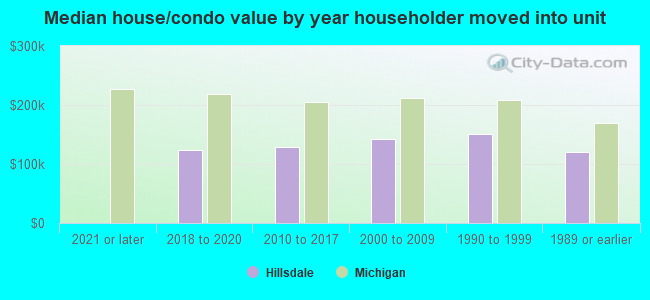
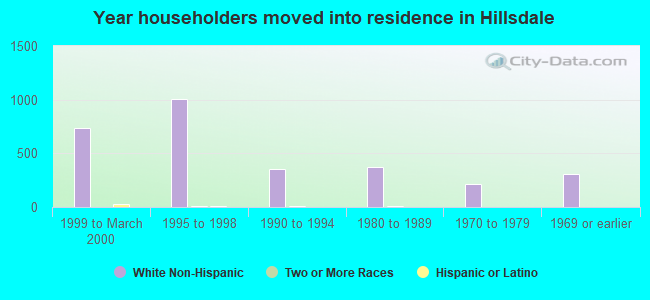
House/condo owner moved in on average 9 years ago
Renter moved in on average 5 years ago
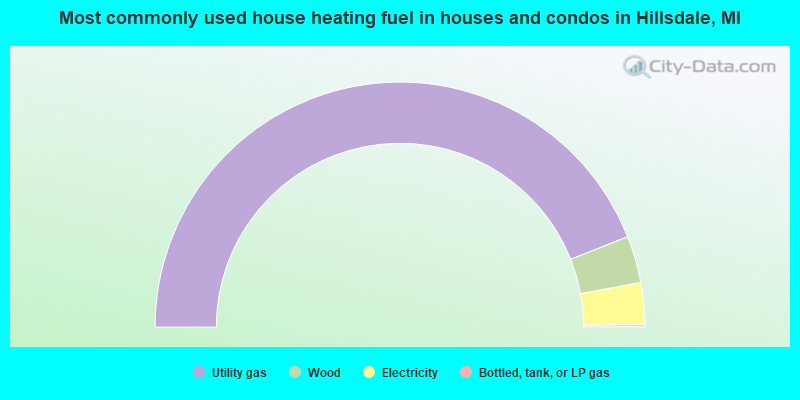
- 88.0%Utility gas
- 6.2%Wood
- 5.5%Electricity
- 0.3%Bottled, tank, or LP gas
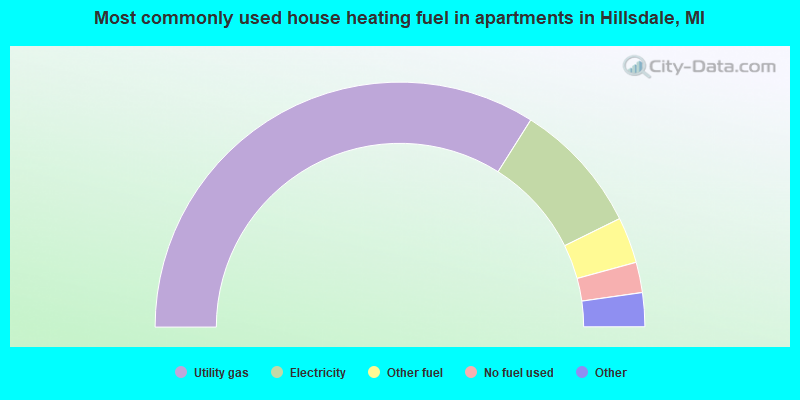
- 68.0%Utility gas
- 17.5%Electricity
- 6.1%Other fuel
- 4.0%No fuel used
- 2.3%Bottled, tank, or LP gas
- 2.0%Wood
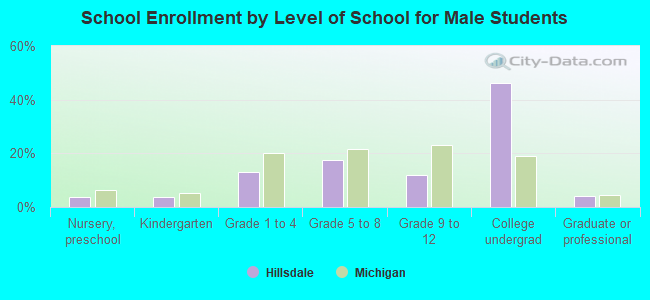
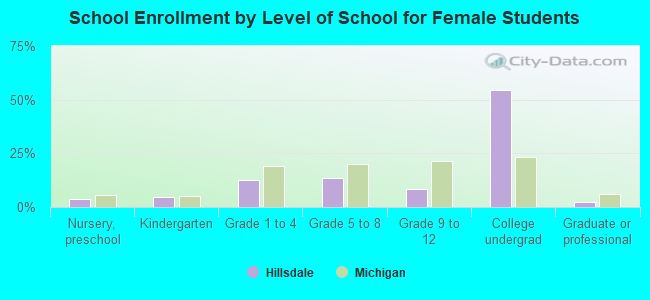
Private vs. public school enrollment:
| Here: | 12.9% |
| Michigan: | 12.4% |
| Here: | 12.7% |
| Michigan: | 9.8% |
| Here: | 91.7% |
| Michigan: | 14.9% |