Hillsville, VA (Virginia) Houses and Residents
| Hillsville: | $137,972 |
| Virginia: | $365,700 |
Mean price in 2022:
Detached houses: $142,854
Here: $142,854 State: $472,865 Mobile homes: $144,790
Here: $144,790 State: $100,736
Total population: 2,680 (Urban population: 0, Rural population: 2,591 (51 farm, 2,540 nonfarm))
Houses: 1,303 (1,013 occupied: 548 owner occupied, 475 renter occupied)
| % of renters here: | 46% |
| State: | 33% |
Housing density: 229 houses/condos per square mile
Median price asked for vacant for-sale houses and condos in 2022: $267,762.
Median contract rent in 2022: $536 (lower quartile is $439, upper quartile is $740)
Median rent asked for vacant for-rent units in 2022: $528
Median gross rent in Hillsville, VA in 2022: $658
Housing units in Hillsville with a mortgage: 281 (0 second mortgage, 0 home equity loan, 0 both second mortgage and home equity loan)
Houses without a mortgage: 15
Median household income for houses/condos with a mortgage: $65,120
Median household income for apartments without a mortgage: $48,300
Median monthly housing costs: $569
Compare current foreclosures near Hillsville, VA:
| Photo | Address | Area | Beds / Baths | Price | Details |
|---|---|---|---|---|---|

|
#1
Fincastle Way
Hillsville, VA 24343
|
- sq. feet
|
- baths - beds |
show details | |

|
#2
Loggy Ridge Rd
Hillsville, VA 24343
|
- sq. feet
|
- baths - beds |
show details | |

|
#3
Bronco Rd
Hillsville, VA 24343
|
- sq. feet
|
- baths - beds |
show details | |

|
#4
Wildlife Ln
Hillsville, VA 24343
|
- sq. feet
|
- baths - beds |
show details | |

|
#5
Antler Pt
Hillsville, VA 24343
|
- sq. feet
|
- baths - beds |
show details | |

|
#6
Mourning Dove Dr
Hillsville, VA 24343
|
- sq. feet
|
- baths - beds |
show details | |

|
#7
Whitetown Rd
Hillsville, VA 24343
|
- sq. feet
|
- baths - beds |
show details | |

|
#8
Coon Ridge Rd
Hillsville, VA 24343
|
- sq. feet
|
- baths - beds |
show details | |

|
#9
Petty Rd
Galax, VA 24333
|
- sq. feet
|
1 baths 3 beds |
show details | |

|
#10
Thomason Ln
Galax, VA 24333
|
- sq. feet
|
- baths - beds |
$16,900
|
show details |
| Photo | Address | Area | Beds / Baths | Price | Details |
|---|---|---|---|---|---|

|
#11
Kenbrook Dr
Galax, VA 24333
|
- sq. feet
|
1 baths 3 beds |
show details | |

|
#12
Lincoln Rd
Galax, VA 24333
|
- sq. feet
|
1 baths 3 beds |
show details | |

|
#13
Webster Rd
Mount Airy, NC 27030
|
- sq. feet
|
1 baths 3 beds |
show details | |

|
#14
Fancy Gap Rd
Mount Airy, NC 27030
|
- sq. feet
|
1 baths 4 beds |
show details | |

|
#15
Clyde Hayes Rd
Lowgap, NC 27024
|
- sq. feet
|
2 baths 3 beds |
show details | |

|
#16
Nettle Knob Trl
Lowgap, NC 27024
|
- sq. feet
|
3 baths 4 beds |
show details | |

|
#17
White Pines Country Clb Rd
Mount Airy, NC 27030
|
- sq. feet
|
2 baths 4 beds |
show details | |

|
#18
Wards Gap Rd
Mount Airy, NC 27030
|
- sq. feet
|
2 baths 2 beds |
show details | |

|
#19
Perry Bowman Rd
Ararat, VA 24053
|
- sq. feet
|
- baths - beds |
show details | |

|
#20
Doe Run Rd
Ararat, VA 24053
|
- sq. feet
|
- baths - beds |
show details |
| Photo | Address | Area | Beds / Baths | Price | Details |
|---|---|---|---|---|---|

|
#21
Poplar Dr
Ivanhoe, VA 24350
|
- sq. feet
|
- baths - beds |
show details | |

|
#22
Wildcat Ln
Max Meadows, VA 24360
|
- sq. feet
|
- baths - beds |
show details | |

|
#23
Gap Road
Mount Airy, NC 27030
|
- sq. feet
|
- baths - beds |
show details | |

|
#24
Fort Chiswell Rd
Max Meadows, VA 24360
|
- sq. feet
|
- baths - beds |
show details | |

|
#25
Ivanhoe Rd
Max Meadows, VA 24360
|
- sq. feet
|
- baths - beds |
show details | |

|
#26
Sheffey School Rd
Wytheville, VA 24382
|
- sq. feet
|
- baths - beds |
show details | |

|
#27
Road
Mount Airy, NC 27030
|
- sq. feet
|
- baths - beds |
show details | |

|
#28
Mid Ln
Mount Airy, NC 27030
|
- sq. feet
|
- baths - beds |
show details | |

|
#29
Cedar Ridge Pl
Mount Airy, NC 27030
|
- sq. feet
|
- baths - beds |
show details | |

|
#30
Ivanhoe Rd
Max Meadows, VA 24360
|
- sq. feet
|
- baths - beds |
show details |
| Photo | Address | Area | Beds / Baths | Price | Details |
|---|---|---|---|---|---|

|
#31
Wards Gap Rd
Mount Airy, NC 27030
|
- sq. feet
|
- baths - beds |
show details | |

|
#32
Ivanhoe Rd
Ivanhoe, VA 24350
|
- sq. feet
|
- baths - beds |
show details | |

|
#33
Rocky Hill Rd NW
Willis, VA 24380
|
- sq. feet
|
- baths - beds |
show details | |

|
#34
Sheffey School Rd
Max Meadows, VA 24360
|
- sq. feet
|
- baths - beds |
show details | |

|
#35
Willis Gap Rd
Mount Airy, NC 27030
|
- sq. feet
|
- baths - beds |
show details | |

|
#36
Holland Dr
Cana, VA 24317
|
- sq. feet
|
- baths - beds |
show details | |

|
#37
Country Club Ln
Galax, VA 24333
|
- sq. feet
|
- baths - beds |
show details | |

|
#38
Honeycutt Dam Rd
Woodlawn, VA 24381
|
- sq. feet
|
- baths - beds |
show details | |

|
#39
Knollwood Dr
Woodlawn, VA 24381
|
- sq. feet
|
- baths - beds |
show details | |

|
#40
Harrison Dr
Fancy Gap, VA 24328
|
- sq. feet
|
- baths - beds |
show details |
| Photo | Address | Area | Beds / Baths | Price | Details |
|---|---|---|---|---|---|

|
#41
Glendale Rd
Galax, VA 24333
|
- sq. feet
|
- baths - beds |
show details | |

|
#42
Browntown Rd
Max Meadows, VA 24360
|
- sq. feet
|
- baths - beds |
show details | |

|
#43
David Ridge Rd
Galax, VA 24333
|
- sq. feet
|
- baths - beds |
show details | |

|
#44
Armory Rd Apt C
Galax, VA 24333
|
- sq. feet
|
- baths - beds |
show details | |

|
#45
Gambetta Road
Galax, VA 24333
|
- sq. feet
|
- baths - beds |
show details | |

|
#46
Cliffview Rd
Galax, VA 24333
|
- sq. feet
|
- baths - beds |
show details | |

|
#47
Flower Gap Rd
Cana, VA 24317
|
- sq. feet
|
- baths - beds |
show details | |

|
#48
Rose Rd
Max Meadows, VA 24360
|
- sq. feet
|
- baths - beds |
show details | |

|
#49
Major Grahams Road
Wytheville, VA 24382
|
- sq. feet
|
- baths - beds |
show details | |

|
Check over 1 million property listings on Foreclosure.com!
|
browse all offers | |||

Latest news about housing in Hillsville, VA collected exclusively by city-data.com from local newspapers, TV, and radio stations

 | Relocating for VA homestead/farmstead (56 replies) |
| Visiting Floyd & Area in May - Recommendations? (6 replies) |
| Considering moving to Virginia (15 replies) |
| Looking for a place to land (10 replies) |
| Relocate to Meadows of Dan & Surrounding areas (12 replies) |
| Considering moving from Raleigh, NC to mountain/farm country VA. (8 replies) |

Median year apartment built: 1976
Household type by relationship:
Households: 2,875- Male householders: 498 (123 living alone), Female householders: 505 (91 living alone)
563 spouses (563 opposite-sex spouses), 25 unmarried partners, (25 opposite-sex unmarried partners), 658 children (545 natural, 8 adopted, 104 stepchildren), 259 grandchildren, 23 brothers or sisters, 8 parents, 0 foster children, 66 other relatives, 204 non-relatives
- In group quarters: 62
Size of family households: 406 2-persons, 160 3-persons, 121 4-persons, 89 6-persons.
Size of nonfamily households: 221 1-person, 33 2-persons.
221 married couples with children.
107 single-parent households (0 men, 107 women).
96.6% of residents of Hillsville speak English at home.
2.7% of residents speak Spanish at home (64% speak English very well, 18% speak English well, 18% speak English not well).
0.4% of residents speak other Indo-European language at home (100% speak English very well).
Foreign born population: 54 (1.9%)
(27.8% of them are naturalized citizens)
| Here: | 6.6 |
| State: | 7.0 |
| Here: | 4.2 |
| State: | 4.3 |

- Bedrooms in owner-occupied houses and condos in Hillsville, Virginia
- 7no bedroom
- 01 bedroom
- 522 bedrooms
- 4063 bedrooms
- 834 bedrooms
- 05+ bedrooms

- Bedrooms in renter-occupied apartments in Hillsville, Virginia
- 27no bedroom
- 371 bedroom
- 1582 bedrooms
- 2353 bedrooms
- 184 bedrooms
- 05+ bedrooms

- Cars and other vehicles available in Hillsville in owner-occupied houses/condos
- 6no vehicle
- 1231 vehicle
- 2712 vehicles
- 923 vehicles
- 494 vehicles
- 65+ vehicles

- Cars and other vehicles available in Hillsville in renter-occupied apartments
- 35no vehicle
- 2091 vehicle
- 1102 vehicles
- 153 vehicles
- 764 vehicles
- 315+ vehicles

- Rooms in owner-occupied houses in Hillsville, Virginia
- 71 room
- 02 rooms
- 03 rooms
- 274 rooms
- 965 rooms
- 1346 rooms
- 927 rooms
- 1338 rooms
- 619+ rooms

- Rooms in renter-occupied apartments in Hillsville, Virginia
- 271 room
- 02 rooms
- 203 rooms
- 2484 rooms
- 1045 rooms
- 426 rooms
- 227 rooms
- 08 rooms
- 149+ rooms


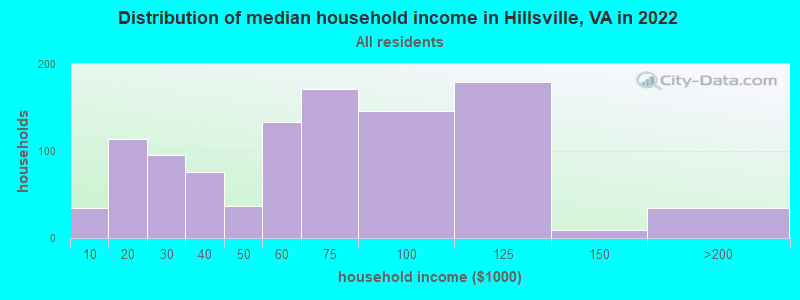
Hillsville, VA household income distribution

- 34Less than $10,000
- 114$10,000 to $19,999
- 95$20,000 to $29,999
- 76$30,000 to $39,999
- 37$40,000 to $49,999
- 133$50,000 to $59,999
- 171$60,000 to $74,999
- 146$75,000 to $99,999
- 179$100,000 to $124,999
- 9$125,000 to $149,999
- 32$150,000 to $199,999
- 2$200,000 or more
Home value of owner - occupied houses in 2022 in Hillsville, VA
-
- 8$15,000 to $19,999
- 15$50,000 to $59,999
- 7$60,000 to $69,999
- 86$80,000 to $89,999
- 18$90,000 to $99,999
- 104$100,000 to $124,999
- 43$125,000 to $149,999
- 91$150,000 to $174,999
- 11$175,000 to $199,999
- 75$200,000 to $249,999
- 7$250,000 to $299,999
- 10$300,000 to $399,999

Rent paid by renters in 2022 in Hillsville, VA
-
- 59$200 to $249
- 5$250 to $299
- 6$350 to $399
- 65$400 to $449
- 58$450 to $499
- 48$500 to $549
- 9$550 to $599
- 18$600 to $649
- 70$700 to $749
- 4$750 to $799
- 51$800 to $899
- 28$1,500 to $1,999
- 60No cash rent


Percentage of workers working in this county: 65.7%
Number of people working at home: 7 (0.6% of all workers)

Travel time to work (commute)
- Less than 5 minutes: 4
- 5 to 9 minutes: 232
- 10 to 14 minutes: 160
- 15 to 19 minutes: 132
- 20 to 24 minutes: 76
- 25 to 29 minutes: 0
- 30 to 34 minutes: 139
- 35 to 39 minutes: 20
- 40 to 44 minutes: 115
- 45 to 59 minutes: 85
- 60 to 89 minutes: 98
- 90 or more minutes: 41

Means of transportation to work:
- Drove a car alone: 1,739 (76.8%)
- Carpooled: 328 (14.5%)
- Walked: 95 (4.2%)
- Worked at home: 7 (0.3%)

- Unemployment by race in 2022
- Unemployment rate for White non-Hispanic residents
- 11.7%Males

- Year of entry for the foreign-born population in Hillsville, Virginia
- 02010 or later
- 382000 to 2009
- 01990 to 1999
- 31980 to 1989
- 01970 to 1979
- 11Before 1970

First ancestries reported:
- American: 701 (45.9%)
- English: 465 (30.4%)
- Irish: 148 (9.7%)
- German: 37 (2.4%)
- Scottish: 21 (1.4%)
- Italian: 17 (1.1%)
- Jamaican: 14 (0.9%)
Most common places of birth for foreign-born residents (%):
| Hillsville: | 66.7% (36) |
| Virginia: | 5.3% (57,498) |
| Hillsville: | 24.1% (13) |
| Virginia: | 1.0% (10,734) |
Place of birth for U.S.-born residents:
- This state: 1,994
- Other state: 813
- Northeast: 46
- Midwest: 33
- South: 721
- West: 7
74.4% of Hillsville residents lived in the same house 1 years ago.
Out of people who lived in different houses, 33.8% lived in this county.
Out of people who lived in different counties, 25.9% lived in Virginia.
| Hillsville: | 74.4% |
| State average: | 86.6% |
Education attainment for males 25 years and older:
- No schooling: 21
- Nursery to 4th grade: 0
- 5th and 6th grade: 41
- 7th and 8th grade: 0
- 9th grade: 4
- 10th grade: 12
- 11th grade: 33
- 12th grade, no diploma: 14
- High school graduate (or equivalency): 444
- Less than 1 year of college: 22
- Some college more than 1 year, no degree: 157
- Associate degree: 109
- Bachelor's degree: 103
- Master's degree: 35
- Professional school degree: 21
- Doctorate degree: 27

Education attainment for females 25 years and older:
- No schooling: 15
- Nursery to 4th grade: 0
- 5th and 6th grade: 0
- 7th and 8th grade: 13
- 9th grade: 42
- 10th grade: 39
- 11th grade: 12
- 12th grade, no diploma: 33
- High school graduate (or equivalency): 321
- Less than 1 year of college: 43
- Some college more than 1 year, no degree: 144
- Associate degree: 133
- Bachelor's degree: 155
- Master's degree: 6
- Professional school degree: 6
- Doctorate degree: 0


Housing units in structures:
- One, detached: 866
- 3 or 4: 78
- 5 to 9: 147
- 10 to 19: 8
- 20 to 49: 70
- Mobile homes: 133
Median worth of mobile homes: $174,581
House/condo owner moved in on average 10 years ago
Renter moved in on average 5 years ago


- 82.8%Electricity
- 6.2%Bottled, tank, or LP gas
- 4.9%Fuel oil, kerosene, etc.
- 3.4%No fuel used
- 2.8%Wood

- 91.1%Electricity
- 4.8%Fuel oil, kerosene, etc.
- 3.2%Other fuel
- 0.9%Wood
Private vs. public school enrollment:
| Here: | 0.0% |
| Virginia: | 13.2% |
| Here: | 0.0% |
| Virginia: | 10.2% |
| Here: | 50.0% |
| Virginia: | 18.7% |


