Hillville, TN (Tennessee) Houses and Residents
| Hillville: | $130,913 |
| Tennessee: | $284,800 |
Total population: 940 (Urban population: 0, Rural population: 967 (all nonfarm))
Houses: 397 (357 occupied: 289 owner occupied, 68 renter occupied)
| % of renters here: | 19% |
| State: | 33% |
Housing density: 7 houses/condos per square mile
Median price asked for vacant for-sale houses and condos in 2022 in this county: $213,479.
Median contract rent in 2022: $456 (lower quartile is $437, upper quartile is $612)
Median gross rent in Hillville, TN in 2022: $720
Housing units in Hillville with a mortgage: 75 (22 second mortgage, 0 home equity loan, 0 both second mortgage and home equity loan)
Houses without a mortgage: 70


Household type by relationship:
Households: 18,613- In family households: 15,913 (2,829 male householders, 2,283 female householders)
3,062 spouses, 5,681 children (5,293 natural, 119 adopted, 269 stepchildren), 853 grandchildren, 255 brothers or sisters, 131 parents, foster children, 331 other relatives, 404 non-relatives
- In nonfamily households: 2,700 (998 male householders (842 living alone)), 1,349 female householders (1,220 living alone)), 353 nonrelatives
- In group quarters: 174 (all institutionalized)
2,608 married couples with children.
1,834 single-parent households (177 men, 1,657 women).
All residents speak only English at home
| Here: | 6.3 |
| State: | 6.5 |
| Here: | 6.1 |
| State: | 4.4 |

- Bedrooms in owner-occupied houses and condos in Hillville, Tennessee
- 0no bedroom
- 111 bedroom
- 342 bedrooms
- 1893 bedrooms
- 554 bedrooms
- 05+ bedrooms

- Bedrooms in renter-occupied apartments in Hillville, Tennessee
- 0no bedroom
- 61 bedroom
- 162 bedrooms
- 403 bedrooms
- 64 bedrooms
- 05+ bedrooms

- Cars and other vehicles available in Hillville in owner-occupied houses/condos
- 14no vehicle
- 541 vehicle
- 1422 vehicles
- 573 vehicles
- 224 vehicles
- 05+ vehicles

- Cars and other vehicles available in Hillville in renter-occupied apartments
- 6no vehicle
- 201 vehicle
- 362 vehicles
- 63 vehicles
- 04 vehicles
- 05+ vehicles

- Rooms in owner-occupied houses in Hillville, Tennessee
- 01 room
- 52 rooms
- 03 rooms
- 144 rooms
- 1095 rooms
- 826 rooms
- 217 rooms
- 588 rooms
- 09+ rooms

- Rooms in renter-occupied apartments in Hillville, Tennessee
- 01 room
- 02 rooms
- 03 rooms
- 64 rooms
- 275 rooms
- 166 rooms
- 77 rooms
- 68 rooms
- 69+ rooms


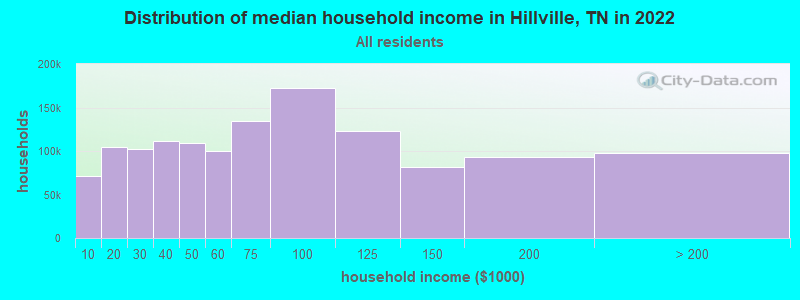
Hillville, TN household income distribution

- 46,775Less than $10,000
- 78,455$10,000 to $19,999
- 74,403$20,000 to $29,999
- 76,074$30,000 to $39,999
- 73,555$40,000 to $49,999
- 68,080$50,000 to $59,999
- 92,821$60,000 to $74,999
- 118,311$75,000 to $99,999
- 88,483$100,000 to $124,999
- 52,705$125,000 to $149,999
- 57,848$150,000 to $199,999
- 48,902$200,000 or more
Percentage of workers working in this county: 42.0%
Number of people working at home: 54 (9.7% of all workers)
Travel time to work (commute)
- Less than 5 minutes: 0
- 5 to 9 minutes: 22
- 10 to 14 minutes: 9
- 15 to 19 minutes: 70
- 20 to 24 minutes: 106
- 25 to 29 minutes: 23
- 30 to 34 minutes: 112
- 35 to 39 minutes: 25
- 40 to 44 minutes: 17
- 45 to 59 minutes: 63
- 60 to 89 minutes: 24
- 90 or more minutes: 27
Means of transportation to work:
- Drove a car alone: 402 (80.7%)
- Carpooled: 81 (16.3%)
- Other means: 15 (3.0%)

Place of birth for U.S.-born residents:
- This state: 844
- Other state: 123
- Northeast: 0
- Midwest: 75
- South: 48
- West: 0
52% of Hillville residents lived in the same house 5 years ago.
Out of people who lived in different houses, 60% lived in this county.
Out of people who lived in different counties, 48% lived in Tennessee.
Education attainment for males 25 years and older:
- No schooling: 0
- Nursery to 4th grade: 0
- 5th and 6th grade: 0
- 7th and 8th grade: 48
- 9th grade: 25
- 10th grade: 16
- 11th grade: 11
- 12th grade, no diploma: 29
- High school graduate (or equivalency): 157
- Less than 1 year of college: 8
- Some college more than 1 year, no degree: 26
- Associate degree: 0
- Bachelor's degree: 0
- Master's degree: 0
- Professional school degree: 0
- Doctorate degree: 0

Education attainment for females 25 years and older:
- No schooling: 7
- Nursery to 4th grade: 0
- 5th and 6th grade: 0
- 7th and 8th grade: 24
- 9th grade: 12
- 10th grade: 19
- 11th grade: 28
- 12th grade, no diploma: 23
- High school graduate (or equivalency): 134
- Less than 1 year of college: 10
- Some college more than 1 year, no degree: 42
- Associate degree: 12
- Bachelor's degree: 0
- Master's degree: 5
- Professional school degree: 0
- Doctorate degree: 0


Housing units in structures:
- One, detached: 269
- Mobile homes: 128
Median worth of mobile homes: $103,971

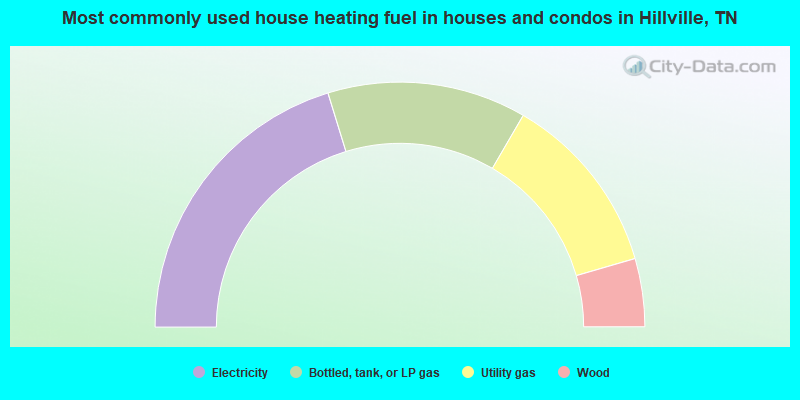
- 40.5%Electricity
- 26.3%Bottled, tank, or LP gas
- 24.2%Utility gas
- 9.0%Wood
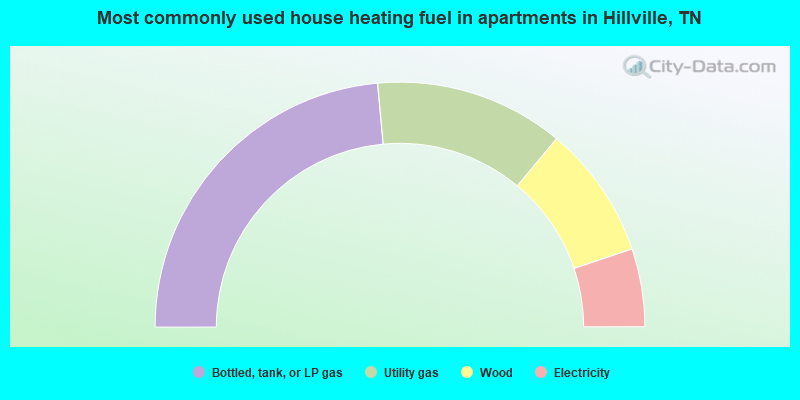
- 47.1%Bottled, tank, or LP gas
- 25.0%Utility gas
- 17.6%Wood
- 10.3%Electricity
Private vs. public school enrollment:
| Here: | 6.8% |
| Tennessee: | 9.5% |
| Here: | 0.0% |
| Tennessee: | 10.4% |
| Here: | 28.6% |
| Tennessee: | 22.8% |


