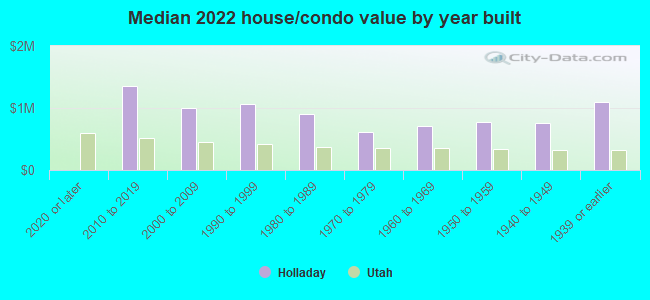
Holladay, UT (Utah) Houses and Residents
| Holladay: | $775,596 |
| Utah: | $499,500 |
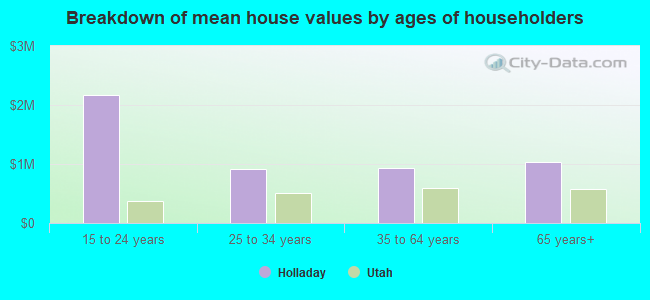
Mean price in 2022:
Detached houses: $1,010,213
Here: $1,010,213 State: $607,750 Townhouses or other attached units: $547,168
Here: $547,168 State: $444,505 In 2-unit structures: $410,129
Here: $410,129 State: $433,540 In 3-to-4-unit structures: $512,286
Here: $512,286 State: $362,850 In 5-or-more-unit structures: $282,242
Here: $282,242 State: $412,810 Mobile homes: $174,869
Here: $174,869 State: $113,475
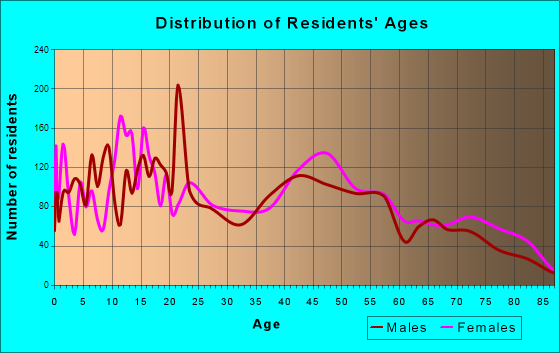
Total population: 27,129 (Urban population: 14,452, Rural population: 99 (all nonfarm))
Houses: 13,167 (12,280 occupied: 9,536 owner occupied, 2,668 renter occupied)
| % of renters here: | 22% |
| State: | 29% |
Housing density: 2,465 houses/condos per square mile
Median price asked for vacant for-sale houses and condos in 2022: $1,893,791.
Median contract rent in 2022: $1,364 (lower quartile is $990, upper quartile is $1,951)
Median rent asked for vacant for-rent units in 2022: $1,850
Median gross rent in Holladay, UT in 2022: $1,554
Housing units in Holladay with a mortgage: 5,894 (849 second mortgage, 67 home equity loan, 746 both second mortgage and home equity loan)
Houses without a mortgage: 221
Median household income for houses/condos with a mortgage: $142,407
Median household income for apartments without a mortgage: $98,903
Median monthly housing costs: $1,607
Compare current foreclosures near Holladay, UT:
| Photo | Address | Area | Beds / Baths | Price | Details |
|---|---|---|---|---|---|

|
#1
S Holladay Cir
Salt Lake City, UT 84117
|
2,440 sq. feet
|
2 baths 4 beds |
$799,900
|
show details |

|
#2
E Downington Ave
Salt Lake City, UT 84108
|
2,580 sq. feet
|
2 baths 1 beds |
$949,900
|
show details |

|
#3
N Fairway Dr
North Salt Lake, UT 84054
|
2,929 sq. feet
|
3 baths 4 beds |
show details | |

|
#4
W Alta View Way
Sandy, UT 84070
|
1,440 sq. feet
|
2 baths 3 beds |
show details | |

|
#5
W 3500 S Ste 5040w
Salt Lake City, UT 84119
|
736 sq. feet
|
2 baths 3 beds |
show details | |

|
#6
W Aspen Springs Dr
Herriman, UT 84096
|
1,334 sq. feet
|
2 baths 2 beds |
show details | |

|
#7
S Interlochin Ln
West Jordan, UT 84084
|
2,054 sq. feet
|
2 baths 3 beds |
show details | |

|
#8
S Cascade Way
Salt Lake City, UT 84109
|
1,185 sq. feet
|
1 baths 5 beds |
show details | |

|
#9
W Mason Way
Magna, UT 84044
|
932 sq. feet
|
2 baths 4 beds |
show details | |

|
#10
W 3800 S
Salt Lake City, UT 84119
|
2,050 sq. feet
|
2 baths 3 beds |
show details |
| Photo | Address | Area | Beds / Baths | Price | Details |
|---|---|---|---|---|---|

|
#11
E Wilson Ave
Salt Lake City, UT 84105
|
950 sq. feet
|
1 baths 3 beds |
show details | |

|
#12
W 6785 S
West Jordan, UT 84084
|
1,516 sq. feet
|
3 baths 4 beds |
show details | |

|
#13
W Patriot Cir
Magna, UT 84044
|
912 sq. feet
|
1 baths 2 beds |
show details | |

|
#14
W 300 S
Salt Lake City, UT 84104
|
1,313 sq. feet
|
1 baths 3 beds |
show details | |

|
#15
S Solano Cir
Salt Lake City, UT 84120
|
1,009 sq. feet
|
2 baths 5 beds |
show details | |

|
#16
W 5780 S
Salt Lake City, UT 84129
|
1,100 sq. feet
|
1 baths 1 beds |
show details | |

|
#17
W Heath Ave
Salt Lake City, UT 84118
|
979 sq. feet
|
1 baths 5 beds |
show details | |

|
#18
S Meadowlark Ln
West Jordan, UT 84088
|
1,748 sq. feet
|
2 baths 3 beds |
show details | |

|
#19
Mankato St
Herriman, UT 84096
|
1,468 sq. feet
|
2 baths 3 beds |
show details | |

|
#20
Ashley Ridge Rd
Sandy, UT 84092
|
2,661 sq. feet
|
2 baths 6 beds |
show details |
| Photo | Address | Area | Beds / Baths | Price | Details |
|---|---|---|---|---|---|

|
#21
S 4340 W
Salt Lake City, UT 84118
|
1,176 sq. feet
|
2 baths 3 beds |
show details | |

|
#22
S Eagle Chase Dr
Draper, UT 84020
|
1,660 sq. feet
|
2 baths 3 beds |
show details | |

|
#23
S 1100 W
Salt Lake City, UT 84104
|
918 sq. feet
|
1 baths 3 beds |
show details | |

|
#24
S Skeeswood Dr
Salt Lake City, UT 84129
|
1,592 sq. feet
|
1 baths 5 beds |
show details | |

|
#25
E Manti Dr
Draper, UT 84020
|
3,530 sq. feet
|
2 baths 4 beds |
show details | |

|
#26
S 2855 W
Salt Lake City, UT 84119
|
1,170 sq. feet
|
1 baths 2 beds |
show details | |

|
#27
W 6775 S
West Jordan, UT 84084
|
1,674 sq. feet
|
2 baths 3 beds |
show details | |

|
#28
S Granite Ridge Ln
Draper, UT 84020
|
1,465 sq. feet
|
2 baths 2 beds |
show details | |

|
#29
S 1300 W
Salt Lake City, UT 84104
|
1,886 sq. feet
|
2 baths 3 beds |
show details | |

|
#30
E Walker Ln
Salt Lake City, UT 84117
|
11,879 sq. feet
|
7 baths 5 beds |
show details |
| Photo | Address | Area | Beds / Baths | Price | Details |
|---|---|---|---|---|---|

|
#31
S 3335 W
West Jordan, UT 84084
|
1,415 sq. feet
|
2 baths 3 beds |
show details | |

|
#32
E 1st Ave
Salt Lake City, UT 84103
|
1,369 sq. feet
|
1 baths 3 beds |
show details | |

|
#33
S Sunburn Cir
Sandy, UT 84094
|
1,920 sq. feet
|
2 baths 4 beds |
show details | |

|
#34
E Montana Dr
Sandy, UT 84070
|
2,456 sq. feet
|
2 baths 5 beds |
show details | |

|
#35
W Dutch Apple Cv
Salt Lake City, UT 84129
|
1,246 sq. feet
|
2 baths 3 beds |
show details | |

|
#36
W 6100 S
Salt Lake City, UT 84129
|
1,378 sq. feet
|
1 baths 3 beds |
show details | |

|
#37
W 5620 S
Salt Lake City, UT 84129
|
1,454 sq. feet
|
2 baths 4 beds |
show details | |

|
#38
E Meadow Bluff Ln
Draper, UT 84020
|
7,272 sq. feet
|
3 baths 5 beds |
show details | |

|
#39
W 2920 S
Salt Lake City, UT 84128
|
1,419 sq. feet
|
1 baths 3 beds |
show details | |

|
#40
S 2870 W
West Jordan, UT 84088
|
1,310 sq. feet
|
2 baths 4 beds |
show details |
| Photo | Address | Area | Beds / Baths | Price | Details |
|---|---|---|---|---|---|

|
#41
Autumn Dr
West Jordan, UT 84084
|
2,125 sq. feet
|
4 baths 4 beds |
show details | |

|
#42
W 6610 S
West Jordan, UT 84084
|
1,719 sq. feet
|
2 baths 4 beds |
show details | |

|
#43
Sunburn Ln
Sandy, UT 84094
|
3,184 sq. feet
|
3 baths 5 beds |
show details | |

|
#44
S Nielsen Way
Salt Lake City, UT 84119
|
2,598 sq. feet
|
4 baths 4 beds |
show details | |

|
#45
W 5620 S
Salt Lake City, UT 84129
|
1,388 sq. feet
|
1 baths 4 beds |
show details | |

|
#46
S Alder Glen Ln
Draper, UT 84020
|
2,807 sq. feet
|
4 baths 5 beds |
show details | |

|
#47
Wasatch Blvd
Sandy, UT 84092
|
3,405 sq. feet
|
3 baths 3 beds |
show details | |

|
#48
S Robert Cir
West Jordan, UT 84084
|
1,753 sq. feet
|
2 baths 5 beds |
show details | |

|
#49
W Fernbrook Dr
Salt Lake City, UT 84129
|
1,012 sq. feet
|
1 baths 3 beds |
show details | |

|
Check over 1 million property listings on Foreclosure.com!
|
browse all offers | |||

Latest news about housing in Holladay, UT collected exclusively by city-data.com from local newspapers, TV, and radio stations

 | Dog friendly SLC rental homes (5 replies) |
| Best apartments in SLC metro for $1000 or less? (3 replies) |
| Best apartments in SLC (14 replies) |
| Relocating to SLC - safe downtown apartments! (8 replies) |
| SLC apartment locating services? (7 replies) |
| Housing condition and landscaping (17 replies) |
Median year apartment built: 1978
Household type by relationship:
Households: 31,713- Male householders: 5,933 (1,254 living alone), Female householders: 5,849 (1,501 living alone)
6,445 spouses (6,285 opposite-sex spouses), 685 unmarried partners, (620 opposite-sex unmarried partners), 10,053 children (9,392 natural, 481 adopted, 179 stepchildren), 704 grandchildren, 50 brothers or sisters, 190 parents, 14 foster children, 435 other relatives, 1,174 non-relatives
- In group quarters: 176
Size of family households: 4,057 2-persons, 1,803 3-persons, 1,352 4-persons, 658 5-persons, 463 6-persons, 219 7-or-more-persons.
Size of nonfamily households: 2,788 1-person, 531 2-persons, 214 3-persons, 56 4-persons, 101 5-persons, 7 7-or-more-persons.
5,724 married couples with children.
1,223 single-parent households (246 men, 977 women).
90.5% of residents of Holladay speak English at home.
3.4% of residents speak Spanish at home (69% speak English very well, 16% speak English well, 15% speak English not well).
4.1% of residents speak other Indo-European language at home (86% speak English very well, 6% speak English well, 5% speak English not well, 3% don't speak English at all).
1.1% of residents speak Asian or Pacific Island language at home (56% speak English very well, 42% speak English well, 2% speak English not well).
0.8% of residents speak other language at home (39% speak English very well, 27% speak English well, 32% speak English not well, 2% don't speak English at all).
Foreign born population: 2,081 (6.6%)
(70.3% of them are naturalized citizens)
| Here: | 8.2 |
| State: | 7.6 |
| Here: | 4.8 |
| State: | 4.3 |
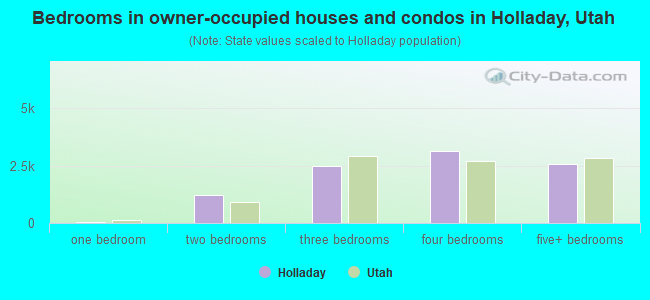
- Bedrooms in owner-occupied houses and condos in Holladay, Utah
- 17no bedroom
- 601 bedroom
- 1,2392 bedrooms
- 2,4863 bedrooms
- 3,1434 bedrooms
- 2,5925+ bedrooms
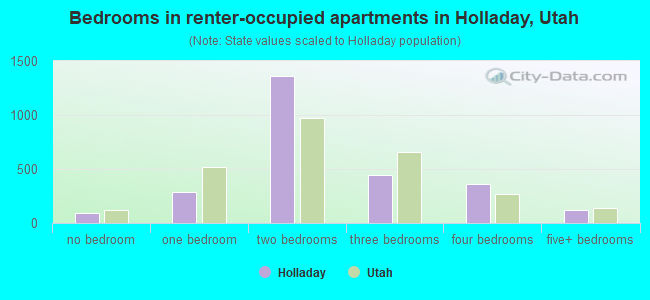
- Bedrooms in renter-occupied apartments in Holladay, Utah
- 97no bedroom
- 2841 bedroom
- 1,3582 bedrooms
- 4463 bedrooms
- 3604 bedrooms
- 1235+ bedrooms
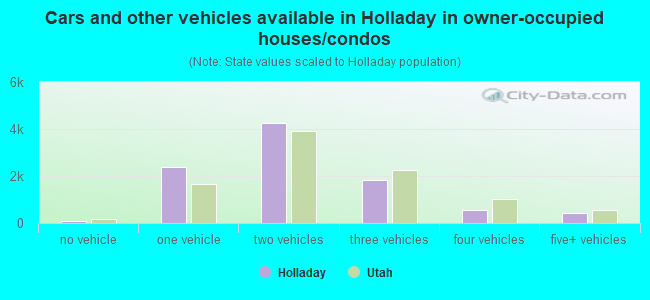
- Cars and other vehicles available in Holladay in owner-occupied houses/condos
- 101no vehicle
- 2,3731 vehicle
- 4,2402 vehicles
- 1,8243 vehicles
- 5704 vehicles
- 4285+ vehicles
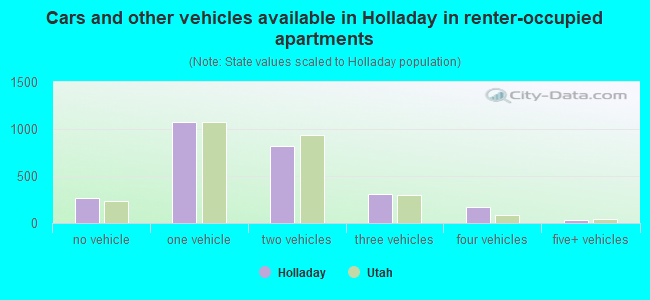
- Cars and other vehicles available in Holladay in renter-occupied apartments
- 262no vehicle
- 1,0781 vehicle
- 8192 vehicles
- 3073 vehicles
- 1714 vehicles
- 315+ vehicles
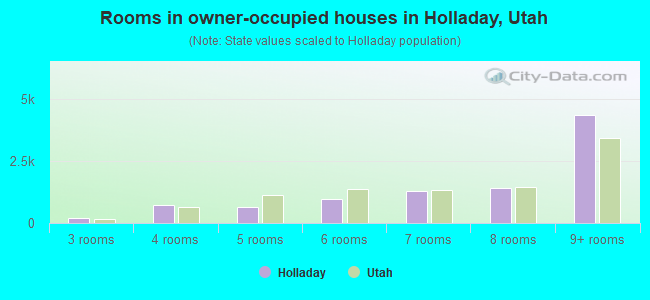
- Rooms in owner-occupied houses in Holladay, Utah
- 171 room
- 212 rooms
- 2013 rooms
- 7184 rooms
- 6245 rooms
- 9466 rooms
- 1,2757 rooms
- 1,3898 rooms
- 4,3459+ rooms
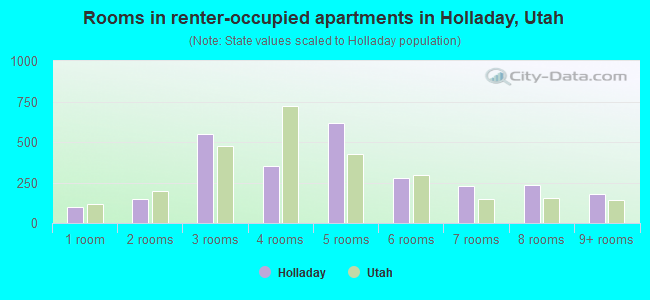
- Rooms in renter-occupied apartments in Holladay, Utah
- 971 room
- 1462 rooms
- 5473 rooms
- 3494 rooms
- 6185 rooms
- 2756 rooms
- 2267 rooms
- 2338 rooms
- 1789+ rooms
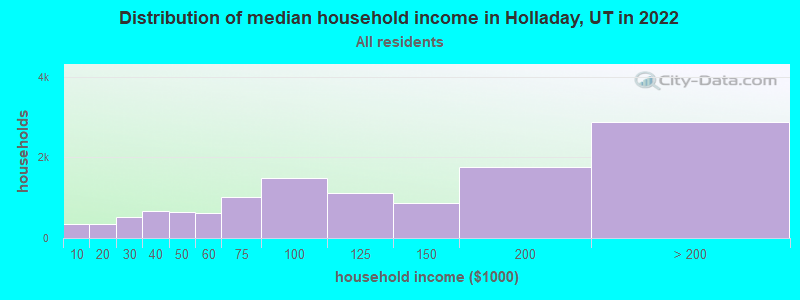
Holladay, UT household income distribution

- 356Less than $10,000
- 356$10,000 to $19,999
- 516$20,000 to $29,999
- 670$30,000 to $39,999
- 635$40,000 to $49,999
- 611$50,000 to $59,999
- 1,029$60,000 to $74,999
- 1,479$75,000 to $99,999
- 1,117$100,000 to $124,999
- 875$125,000 to $149,999
- 1,771$150,000 to $199,999
- 2,878$200,000 or more
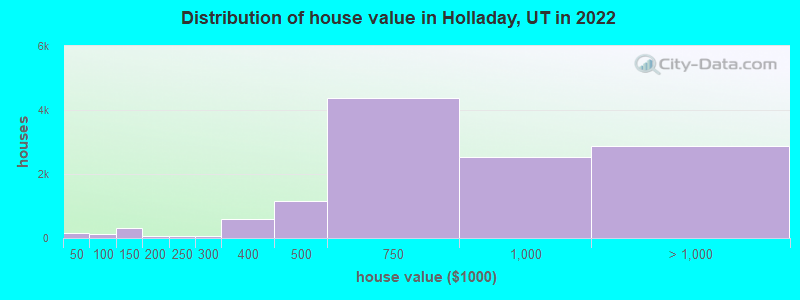
Home value of owner - occupied houses in 2022 in Holladay, UT
-
- 46Less than $10,000
- 6$15,000 to $19,999
- 9$20,000 to $24,999
- 37$25,000 to $29,999
- 20$30,000 to $34,999
- 27$40,000 to $49,999
- 42$50,000 to $59,999
- 45$60,000 to $69,999
- 294$100,000 to $124,999
- 11$125,000 to $149,999
- 28$150,000 to $174,999
- 22$175,000 to $199,999
- 70$200,000 to $249,999
- 61$250,000 to $299,999
- 601$300,000 to $399,999
- 1,147$400,000 to $499,999
- 4,382$500,000 to $749,999
- 2,531$750,000 to $999,999
- 1,666$1,000,000 to $1,499,999
- 611$1,500,000 to $1,999,999
- 583$2,000,000 or more
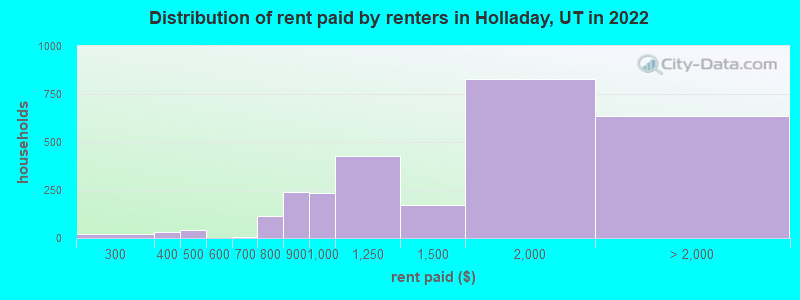
Rent paid by renters in 2022 in Holladay, UT
-
- 6Less than $100
- 20$200 to $249
- 30$300 to $349
- 6$400 to $449
- 37$450 to $499
- 7$650 to $699
- 10$700 to $749
- 103$750 to $799
- 238$800 to $899
- 235$900 to $999
- 424$1,000 to $1,249
- 172$1,250 to $1,499
- 826$1,500 to $1,999
- 417$2,000 to $2,499
- 86$2,500 to $2,999
- 11$3,000 to $3,499
- 44$3,500 or more
- 78No cash rent
Percentage of workers working in this county: 93.2%
Number of people working at home: 3,938 (25.1% of all workers)
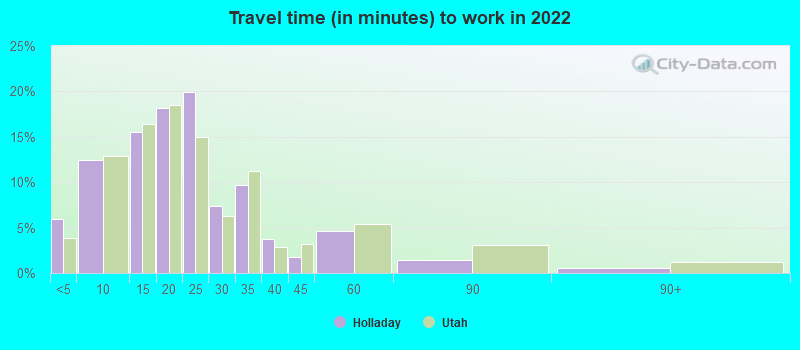
Travel time to work (commute)
- Less than 5 minutes: 398
- 5 to 9 minutes: 1,139
- 10 to 14 minutes: 2,016
- 15 to 19 minutes: 2,422
- 20 to 24 minutes: 2,701
- 25 to 29 minutes: 1,007
- 30 to 34 minutes: 1,213
- 35 to 39 minutes: 180
- 40 to 44 minutes: 369
- 45 to 59 minutes: 313
- 60 to 89 minutes: 117
- 90 or more minutes: 65
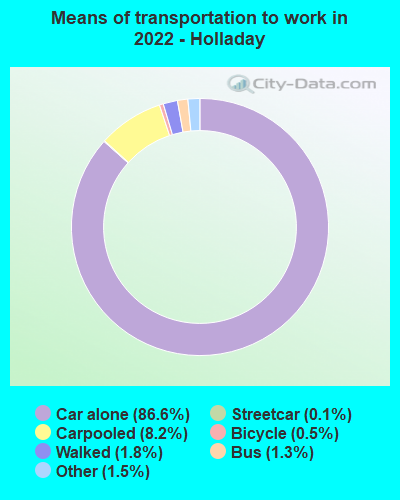
Means of transportation to work:
- Drove a car alone: 6,625 (59.7%)
- Carpooled: 675 (6.1%)
- Bus: 69 (0.6%)
- Subway or elevated rail: 6 (0.1%)
- Taxi: 120 (1.1%)
- Bicycle: 33 (0.3%)
- Walked: 140 (1.3%)
- Worked at home: 3,938 (35.5%)
- Unemployment by race in 2022
- Unemployment rate for White non-Hispanic residents
- 0.8%Males
- 3.8%Females
- Unemployment rate for Asian residents
- 1.0%Males
- 2.6%Females
- Unemployment rate for other race residents
- 20.5%Females
- Unemployment rate for two or more race residents
- 2.5%Males
- 4.6%Females
- Unemployment rate for Hispanic or Latino residents
- 2.6%Males
- 2.2%Females
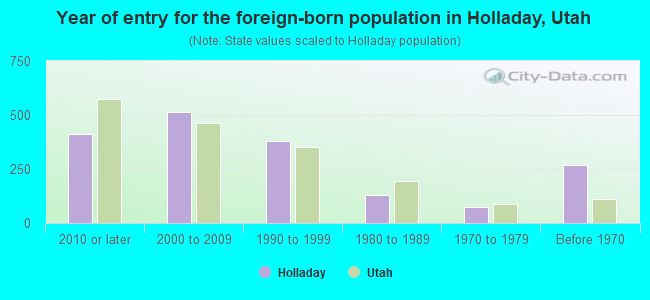
- Year of entry for the foreign-born population in Holladay, Utah
- 4132010 or later
- 5152000 to 2009
- 3801990 to 1999
- 1301980 to 1989
- 731970 to 1979
- 270Before 1970
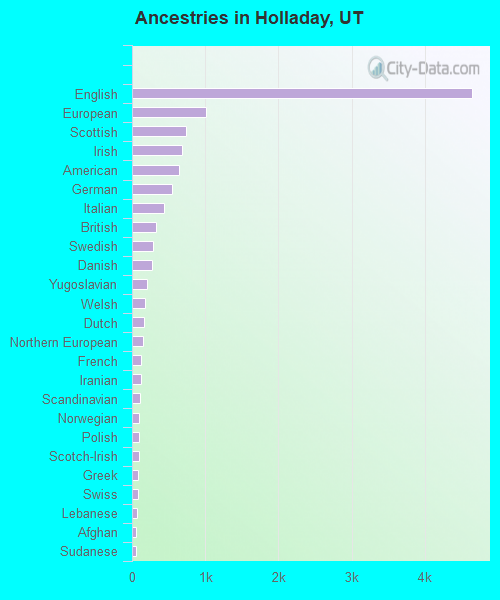
First ancestries reported:
- English: 4,645 (32.4%)
- European: 1,009 (7.0%)
- Scottish: 738 (5.1%)
- Irish: 683 (4.8%)
- American: 639 (4.5%)
- German: 541 (3.8%)
- Italian: 438 (3.1%)
- British: 328 (2.3%)
- Swedish: 282 (2.0%)
- Danish: 274 (1.9%)
- Yugoslavian: 205 (1.4%)
- Welsh: 183 (1.3%)
- Dutch: 162 (1.1%)
- Northern European: 151 (1.1%)
- French: 128 (0.9%)
- Iranian: 117 (0.8%)
- Scandinavian: 114 (0.8%)
- Norwegian: 100 (0.7%)
- Polish: 94 (0.7%)
- Scotch-Irish: 89 (0.6%)
- Greek: 87 (0.6%)
- Swiss: 83 (0.6%)
- Lebanese: 62 (0.4%)
- Afghan: 61 (0.4%)
- Sudanese: 56 (0.4%)
- African: 54 (0.4%)
- Basque: 45 (0.3%)
- West Indian: 36 (0.3%)
- Cajun: 33 (0.2%)
- Russian: 30 (0.2%)
- Slovak: 24 (0.2%)
- Eastern European: 23 (0.2%)
- Palestinian: 19 (0.1%)
- Austrian: 17 (0.1%)
- Czech: 16 (0.1%)
- Ghanaian: 12 (0.08%)
- Ukrainian: 12 (0.08%)
- Brazilian: 10 (0.07%)
- French Canadian: 10 (0.07%)
- South African: 6 (0.04%)
- Canadian: 6 (0.04%)
- Hungarian: 5 (0.03%)
Most common places of birth for foreign-born residents (%):
| Holladay: | 8.5% (178) |
| Utah: | 3.0% (8,294) |
| Holladay: | 8.3% (175) |
| Utah: | 36.1% (99,740) |
| Holladay: | 7.3% (153) |
| Utah: | 3.0% (8,341) |
| Holladay: | 6.5% (137) |
| Utah: | 0.2% (627) |
| Holladay: | 4.1% (86) |
| Utah: | 0.8% (2,137) |
| Holladay: | 3.7% (78) |
| Utah: | 2.9% (8,017) |
| Holladay: | 3.5% (73) |
| Utah: | 0.5% (1,280) |
| Holladay: | 3.4% (72) |
| Utah: | 2.1% (5,902) |
| Holladay: | 3.2% (68) |
| Utah: | 2.7% (7,472) |
| Holladay: | 3.1% (65) |
| Utah: | 1.3% (3,479) |
| Holladay: | 3.0% (64) |
| Utah: | 3.2% (8,804) |
| Holladay: | 2.9% (60) |
| Utah: | 1.1% (2,900) |
| Holladay: | 2.8% (59) |
| Utah: | 0.6% (1,743) |
| Holladay: | 2.6% (54) |
| Utah: | 0.5% (1,475) |
| Holladay: | 2.4% (51) |
| Utah: | 0.6% (1,545) |
| Holladay: | 2.1% (45) |
| Utah: | 0.2% (640) |
| Holladay: | 2.1% (45) |
| Utah: | 1.6% (4,524) |
| Holladay: | 2.0% (43) |
| Utah: | 0.7% (2,014) |
| Holladay: | 1.5% (32) |
| Utah: | 0.4% (1,143) |
Place of birth for U.S.-born residents:
- This state: 19,341
- Other state: 9,866
- Northeast: 1,439
- Midwest: 2,401
- South: 1,272
- West: 4,893
88.5% of Holladay residents lived in the same house 1 years ago.
Out of people who lived in different houses, 37.5% lived in this county.
Out of people who lived in different counties, 34.1% lived in Utah.
| Holladay: | 88.5% |
| State average: | 85.7% |
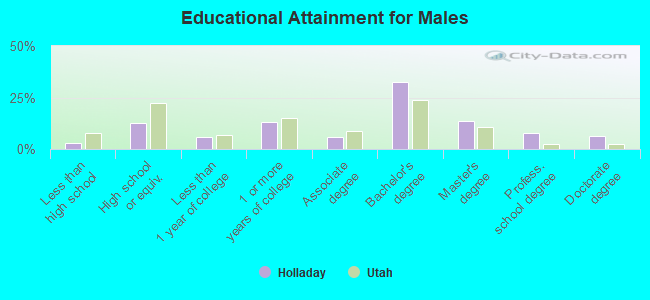
Education attainment for males 25 years and older:
- No schooling: 101
- Nursery to 4th grade: 31
- 5th and 6th grade: 0
- 7th and 8th grade: 0
- 9th grade: 5
- 10th grade: 6
- 11th grade: 25
- 12th grade, no diploma: 122
- High school graduate (or equivalency): 1,350
- Less than 1 year of college: 656
- Some college more than 1 year, no degree: 1,397
- Associate degree: 650
- Bachelor's degree: 3,519
- Master's degree: 1,492
- Professional school degree: 824
- Doctorate degree: 667
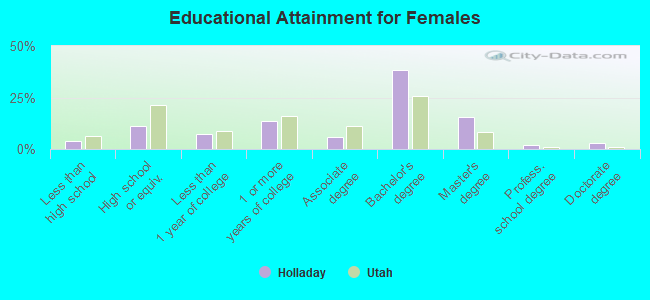
Education attainment for females 25 years and older:
- No schooling: 197
- Nursery to 4th grade: 0
- 5th and 6th grade: 8
- 7th and 8th grade: 1
- 9th grade: 21
- 10th grade: 19
- 11th grade: 39
- 12th grade, no diploma: 137
- High school graduate (or equivalency): 1,260
- Less than 1 year of college: 838
- Some college more than 1 year, no degree: 1,510
- Associate degree: 651
- Bachelor's degree: 4,289
- Master's degree: 1,729
- Professional school degree: 215
- Doctorate degree: 299
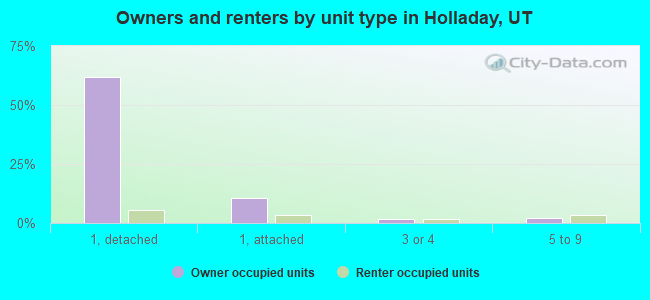
Housing units in structures:
- One, detached: 8,763
- One, attached: 1,669
- Two: 210
- 3 or 4: 257
- 5 to 9: 918
- 10 to 19: 770
- 20 to 49: 343
- 50 or more: 180
- Mobile homes: 54
Housing units lacking complete kitchen facilities in 2022: 1.0%
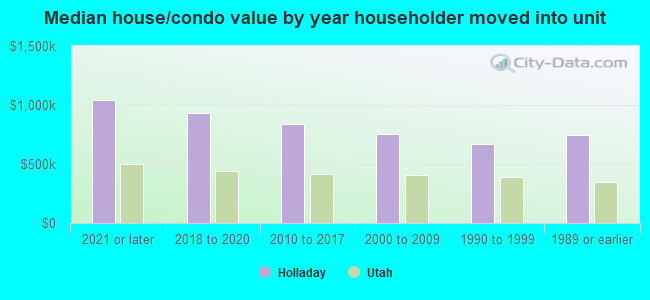
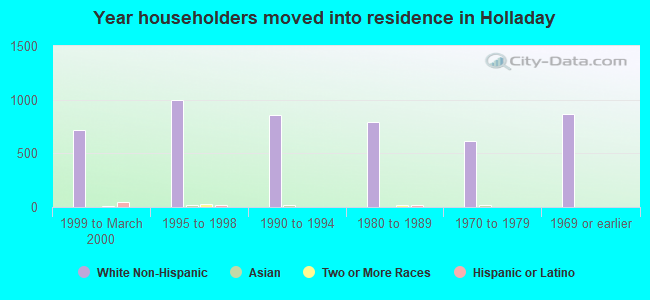
House/condo owner moved in on average 12 years ago
Renter moved in on average 5 years ago

- 87.7%Utility gas
- 10.9%Electricity
- 0.9%Solar energy
- 0.5%Bottled, tank, or LP gas
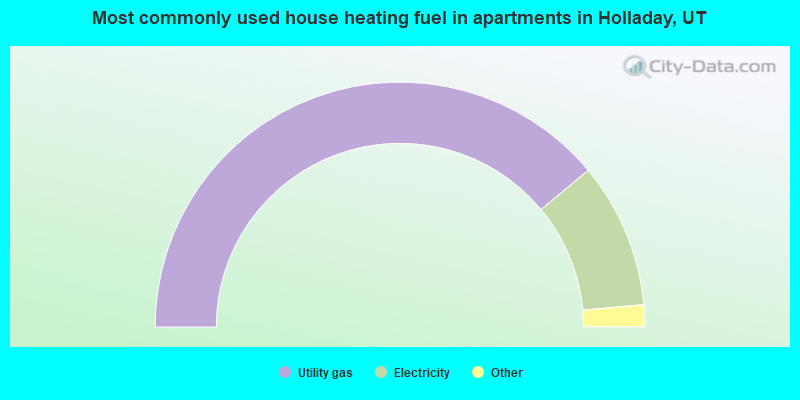
- 77.9%Utility gas
- 19.2%Electricity
- 1.3%Other fuel
- 0.9%No fuel used
- 0.7%Bottled, tank, or LP gas
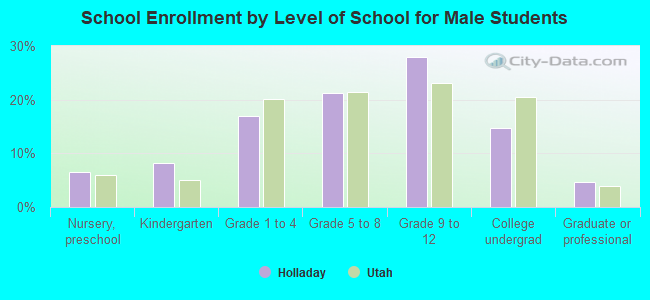
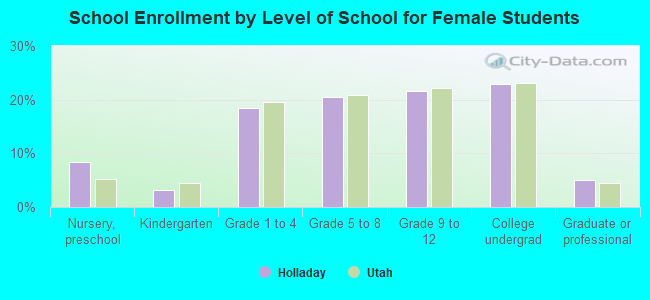
Private vs. public school enrollment:
| Here: | 21.0% |
| Utah: | 7.2% |
| Here: | 10.8% |
| Utah: | 5.3% |
| Here: | 21.6% |
| Utah: | 26.7% |