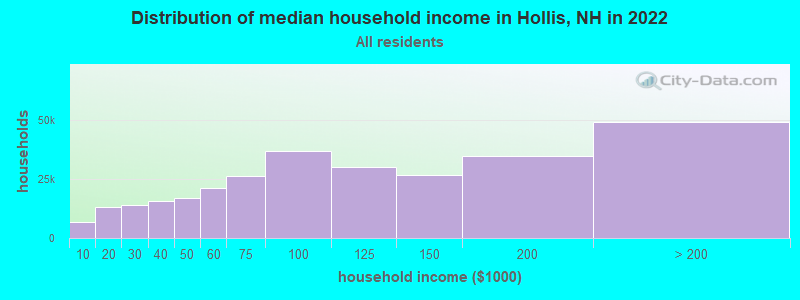
Median price asked for vacant for-sale houses and condos in 2022 in this county: $219,786.
Median contract rent in 2022: $1,427 (lower quartile is $1,235, upper quartile is $1,941)
Median gross rent in Hollis, NH in 2022: $1,690
Housing units in Hollis with a mortgage: 1,563 (80 second mortgage, 247 home equity loan, 8 both second mortgage and home equity loan) Houses without a mortgage: 485
Compare current foreclosures near Hollis, NH:
#1
Van Dyke Rd
Hollis, NH 03049
2,908
sq. feet
2
baths
4
beds
#2
Ash St # F
Hollis, NH 03049
-
sq. feet
-
baths
-
beds
#3
$464,900
Great Rd
Shirley, MA 01464
1,672
sq. feet
1
baths
2
beds
#4
$529,900
Pearl Hill Rd
Fitchburg, MA 01420
2,152
sq. feet
2
baths
3
beds
#5
Depot Rd
Hollis, NH 03049
-
sq. feet
-
baths
-
beds
#6
Nashua St
Milford, NH 03055
2,172
sq. feet
2
baths
4
beds
#7
Harvard St
Lowell, MA 01851
2,676
sq. feet
2
baths
4
beds
#8
Brook St
Derry, NH 03038
1,476
sq. feet
2
baths
4
beds
#9
Mallard Drive, Unit 59 Coggshall Crossing Condominium
In family households: 326,724 (73,081 male householders, 30,878 female householders)
80,219 spouses, 116,046 children (108,604 natural, 2,355 adopted, 5,087 stepchildren), 5,202 grandchildren, 2,916 brothers or sisters, 3,400 parents, foster children, 2,901 other relatives, 9,588 non-relatives
In nonfamily households: 66,238 (25,502 male householders (18,551 living alone)), 26,005 female householders (20,836 living alone)), 14,731 nonrelatives
In group quarters: 7,759 (3,560 institutionalized population)
74,304 married couples with children.
19,641 single-parent households (5,030 men, 14,611 women).
92.9% of residents of Hollis speak English at home.
0.7% of residents speak Spanish at home (100% speak English very well).
5.2% of residents speak other Indo-European language at home (86% speak English very well, 10% speak English well, 4% speak English not well).
0.9% of residents speak Asian or Pacific Island language at home (70% speak English very well, 13% speak English well, 17% speak English not well).
0.4% of residents speak other language at home (100% speak English very well).
Foreign born population: 585 (7.4%)
(76.9% of them are naturalized citizens)
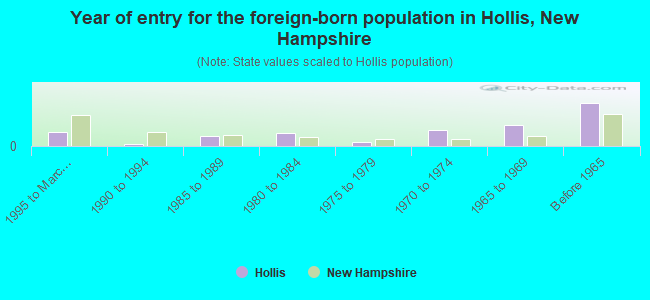
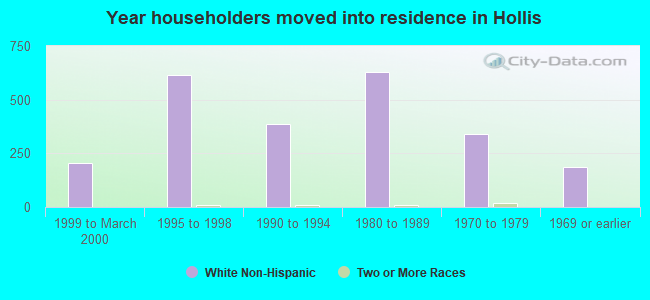
Year of entry for the foreign-born population in Hollis, New Hampshire
401995 to March 2000
71990 to 1994
281985 to 1989
361980 to 1984
101975 to 1979
461970 to 1974
601965 to 1969
121Before 1965
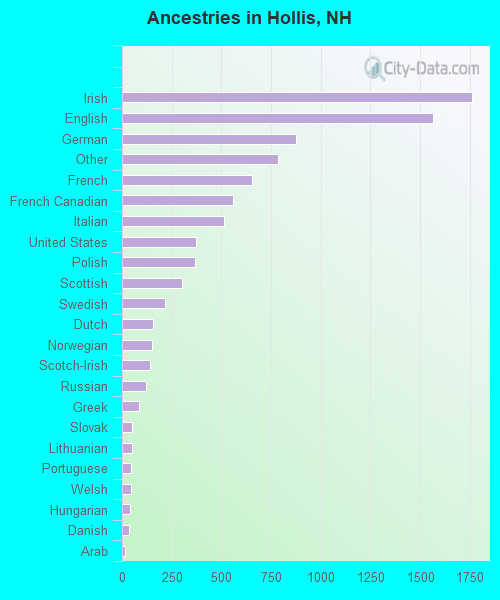
First ancestries reported:
Irish: 1,759 (19.7%)
English: 1,563 (17.5%)
German: 874 (9.8%)
Other: 784 (8.8%)
French: 653 (7.3%)
French Canadian: 561 (6.3%)
Italian: 512 (5.7%)
United States: 372 (4.2%)
Polish: 367 (4.1%)
Scottish: 304 (3.4%)
Swedish: 215 (2.4%)
Dutch: 157 (1.8%)
Norwegian: 149 (1.7%)
Scotch-Irish: 141 (1.6%)
Russian: 123 (1.4%)
Greek: 86 (1.0%)
Slovak: 51 (0.6%)
Lithuanian: 50 (0.6%)
Portuguese: 44 (0.5%)
Welsh: 43 (0.5%)
Hungarian: 40 (0.4%)
Danish: 36 (0.4%)
Arab: 17 (0.2%)
Ukrainian: 10 (0.1%)
Subsaharan African: 9 (0.1%)
Czech: 8 (0.09%)
Most common places of birth for foreign-born residents (%):
United Kingdom
Hollis:
22.1% (77)
New Hampshire:
8.1% (4,396)
Canada
Hollis:
15.2% (53)
New Hampshire:
22.9% (12,397)
Germany
Hollis:
11.2% (39)
New Hampshire:
4.9% (2,670)
Italy
Hollis:
7.5% (26)
New Hampshire:
1.5% (813)
Sweden
Hollis:
5.2% (18)
New Hampshire:
0.5% (250)
Netherlands
Hollis:
5.2% (18)
New Hampshire:
0.9% (471)
Korea
Hollis:
5.2% (18)
New Hampshire:
2.9% (1,582)
Japan
Hollis:
3.2% (11)
New Hampshire:
1.3% (706)
Bolivia
Hollis:
3.2% (11)
New Hampshire:
0.1% (74)
Portugal
Hollis:
2.9% (10)
New Hampshire:
1.5% (835)
Iran
Hollis:
2.9% (10)
New Hampshire:
0.6% (338)
Thailand
Hollis:
2.9% (10)
New Hampshire:
0.6% (314)
Taiwan
Hollis:
2.6% (9)
New Hampshire:
0.9% (464)
Philippines
Hollis:
2.6% (9)
New Hampshire:
1.9% (1,031)
Other Northern Europe
Hollis:
2.3% (8)
New Hampshire:
0.9% (508)
Austria
Hollis:
2.3% (8)
New Hampshire:
0.3% (183)
India
Hollis:
2.0% (7)
New Hampshire:
4.7% (2,530)
Poland
Hollis:
1.7% (6)
New Hampshire:
1.7% (931)
Place of birth for U.S.-born residents:
This state: 2,574
Other state: 4,007
Northeast: 3,116
Midwest: 340
South: 342
West: 209
66% of Hollis residents lived in the same house 5 years ago. Out of people who lived in different houses, 53% lived in this county. Out of people who lived in different counties, 5% lived in New Hampshire.
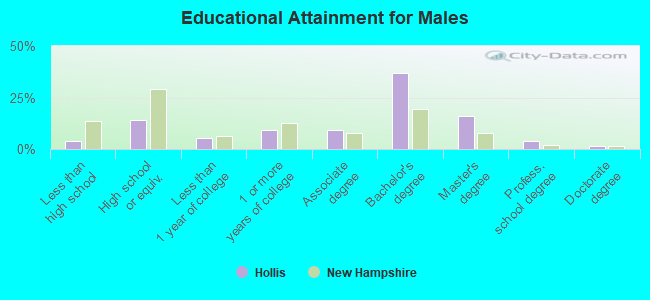
Education attainment for males 25 years and older:
No schooling: 0
Nursery to 4th grade: 0
5th and 6th grade: 0
7th and 8th grade: 26
9th grade: 20
10th grade: 20
11th grade: 8
12th grade, no diploma: 20
High school graduate (or equivalency): 328
Less than 1 year of college: 129
Some college more than 1 year, no degree: 213
Associate degree: 209
Bachelor's degree: 856
Master's degree: 369
Professional school degree: 88
Doctorate degree: 35
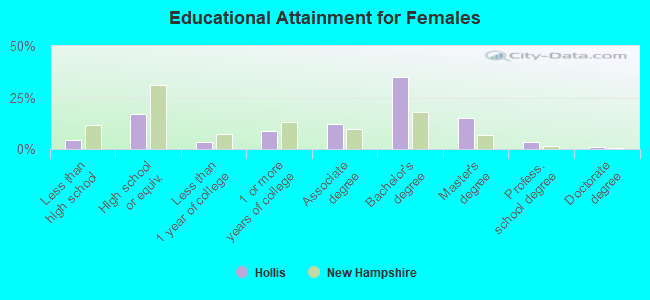
Education attainment for females 25 years and older:
No schooling: 0
Nursery to 4th grade: 0
5th and 6th grade: 0
7th and 8th grade: 8
9th grade: 17
10th grade: 25
11th grade: 17
12th grade, no diploma: 31
High school graduate (or equivalency): 397
Less than 1 year of college: 79
Some college more than 1 year, no degree: 207
Associate degree: 290
Bachelor's degree: 826
Master's degree: 352
Professional school degree: 83
Doctorate degree: 27
Housing units in structures:
One, detached: 2,256
One, attached: 24
Two: 78
5 to 9: 16
10 to 19: 13
20 to 49: 13
Mobile homes: 91
Median worth of mobile homes: $127,356
Housing units lacking complete plumbing facilities: 0.8%
Housing units lacking complete kitchen facilities: 0.5%