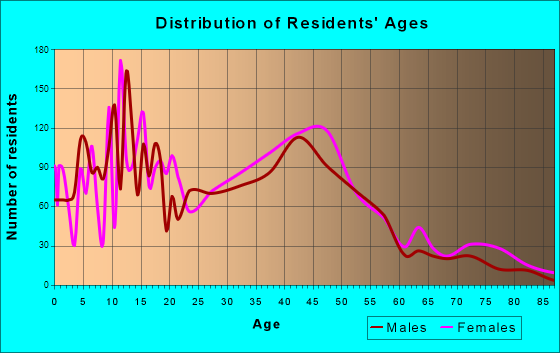
Holt, MI (Michigan) Houses and Residents
| Holt: | $211,727 |
| Michigan: | $224,400 |
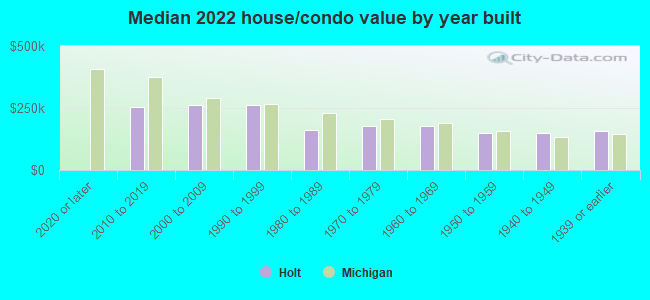
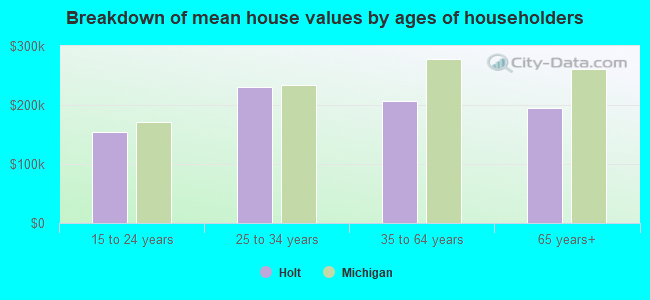
Mean price in 2022:
Detached houses: $237,273
Here: $237,273 State: $280,038 Townhouses or other attached units: $181,834
Here: $181,834 State: $239,520 In 2-unit structures: $122,292
Here: $122,292 State: $219,481 In 3-to-4-unit structures: $175,507
Here: $175,507 State: $207,067 In 5-or-more-unit structures: $57,887
Here: $57,887 State: $192,733 Mobile homes: $14,002
Here: $14,002 State: $72,868
Total population: 23,973 (Urban population: 11,257, Rural population: 28 (all nonfarm))
Houses: 10,973 (10,481 occupied: 7,001 owner occupied, 3,662 renter occupied)
| % of renters here: | 34% |
| State: | 27% |
Housing density: 2,544 houses/condos per square mile
Median price asked for vacant for-sale houses and condos in 2022: $76,276.
Median contract rent in 2022: $983 (lower quartile is $728, upper quartile is $1,382)
Median rent asked for vacant for-rent units in 2022: $1,168
Median gross rent in Holt, MI in 2022: $1,143
Housing units in Holt with a mortgage: 4,671 (351 second mortgage, 13 home equity loan, 249 both second mortgage and home equity loan)
Houses without a mortgage: 125
Median household income for houses/condos with a mortgage: $96,691
Median household income for apartments without a mortgage: $76,251
Median monthly housing costs: $1,189
Compare current foreclosures in Holt, MI:
| Photo | Address | Area | Beds / Baths | Price | Details |
|---|---|---|---|---|---|

|
#1
Pine Tree Rd
Holt, MI 48842
|
963 sq. feet
|
1 baths 3 beds |
show details | |

|
#2
Somerset Drive
Holt, MI 48842
|
2,368 sq. feet
|
3 baths 4 beds |
show details | |

|
#3
Jacqueline Dr
Holt, MI 48842
|
1,116 sq. feet
|
1 baths 3 beds |
show details | |

|
#4
Woodworth Ave
Holt, MI 48842
|
1,821 sq. feet
|
2 baths 5 beds |
show details | |

|
#5
Park Ln
Holt, MI 48842
|
1,288 sq. feet
|
2 baths 3 beds |
show details | |

|
#6
Willow Ridge Dr
Holt, MI 48842
|
1,924 sq. feet
|
1 baths 3 beds |
show details | |

|
#7
Chestnut St
Holt, MI 48842
|
1,776 sq. feet
|
1 baths 3 beds |
show details | |

|
#8
Onondaga Rd
Holt, MI 48842
|
3,107 sq. feet
|
3 baths 3 beds |
show details | |

|
#9
Kate St
Holt, MI 48842
|
- sq. feet
|
- baths - beds |
show details | |

|
#10
Boyman Dr # 154
Holt, MI 48842
|
- sq. feet
|
1 baths - beds |
show details |
| Photo | Address | Area | Beds / Baths | Price | Details |
|---|---|---|---|---|---|

|
#11
Flying Gulch Dr Apt 3
Holt, MI 48842
|
- sq. feet
|
- baths - beds |
show details | |

|
#12
Tamarack St
Holt, MI 48842
|
- sq. feet
|
- baths - beds |
show details | |

|
#13
Holt Rd Lot
Holt, MI 48842
|
- sq. feet
|
- baths - beds |
show details | |

|
#14
Cedar St # H
Holt, MI 48842
|
- sq. feet
|
- baths - beds |
show details | |

|
#15
Calypso Rd
Holt, MI 48842
|
- sq. feet
|
- baths - beds |
show details | |

|
#16
Sunshine Peak Dr
Holt, MI 48842
|
- sq. feet
|
- baths - beds |
show details | |

|
#17
Keller Rd
Holt, MI 48842
|
- sq. feet
|
- baths - beds |
show details | |

|
#18
Samper Ln Apt 1
Holt, MI 48842
|
- sq. feet
|
- baths - beds |
show details | |

|
#19
Keller Rd Apt 113
Holt, MI 48842
|
- sq. feet
|
- baths - beds |
show details | |

|
#20
Holt Rd Lot 75
Holt, MI 48842
|
- sq. feet
|
- baths - beds |
show details |
| Photo | Address | Area | Beds / Baths | Price | Details |
|---|---|---|---|---|---|

|
#21
Meadowlawn Dr
Holt, MI 48842
|
- sq. feet
|
- baths - beds |
show details | |

|
#22
Rotterdam Rd
Holt, MI 48842
|
- sq. feet
|
- baths - beds |
show details | |

|
#23
Nightingale Dr
Holt, MI 48842
|
- sq. feet
|
- baths - beds |
show details | |

|
#24
Holt Rd Lot 11
Holt, MI 48842
|
- sq. feet
|
- baths - beds |
show details | |

|
#25
West Blvd
Holt, MI 48842
|
- sq. feet
|
- baths - beds |
show details | |

|
#26
Cricket Ridge Dr Apt 204
Holt, MI 48842
|
- sq. feet
|
- baths - beds |
show details | |

|
#27
Aurelius Rd Apt A9
Holt, MI 48842
|
- sq. feet
|
- baths - beds |
show details | |

|
#28
Aurelius Rd Apt 37
Holt, MI 48842
|
- sq. feet
|
- baths - beds |
show details | |

|
#29
Willoughby Rd
Holt, MI 48842
|
- sq. feet
|
- baths - beds |
show details | |

|
#30
Rotterdam Rd
Holt, MI 48842
|
- sq. feet
|
1 baths - beds |
show details |
| Photo | Address | Area | Beds / Baths | Price | Details |
|---|---|---|---|---|---|

|
Check over 1 million property listings on Foreclosure.com!
|
browse all offers | |||
| Photo | Address | Area | Beds / Baths | Price | Details |
|---|

Latest news about housing in Holt, MI collected exclusively by city-data.com from local newspapers, TV, and radio stations

 | Retired & Looking to buy home near Okemos MI. where our son/grand kids live (5 replies) |
| Commute from Lansing to Grand Rapids and Warren (6 replies) |
| Aspen Lakes Estates and Holt Area Feedback (1 reply) |
| Looking to Move Home (13 replies) |
| Areas to Rent within 20 Miles of MSU (16 replies) |
| From Arizona to Michigan (76 replies) |
Median year apartment built: 1996
Household type by relationship:
Households: 25,514- Male householders: 5,019 (1,344 living alone), Female householders: 5,447 (1,816 living alone)
5,104 spouses (5,058 opposite-sex spouses), 768 unmarried partners, (768 opposite-sex unmarried partners), 6,980 children (6,270 natural, 464 adopted, 245 stepchildren), 486 grandchildren, 76 brothers or sisters, 156 parents, 52 foster children, 361 other relatives, 926 non-relatives
- In group quarters: 134
Size of family households: 2,946 2-persons, 1,545 3-persons, 1,161 4-persons, 722 5-persons, 135 6-persons, 24 7-or-more-persons.
Size of nonfamily households: 3,402 1-person, 565 2-persons, 66 3-persons, 21 4-persons, 20 6-persons.
3,000 married couples with children.
1,713 single-parent households (566 men, 1,147 women).
92.7% of residents of Holt speak English at home.
1.7% of residents speak Spanish at home (65% speak English very well, 30% speak English well, 5% speak English not well).
1.7% of residents speak other Indo-European language at home (55% speak English very well, 22% speak English well, 19% speak English not well, 4% don't speak English at all).
3.0% of residents speak Asian or Pacific Island language at home (56% speak English very well, 23% speak English well, 19% speak English not well, 3% don't speak English at all).
0.8% of residents speak other language at home (31% speak English very well, 69% speak English well).
Foreign born population: 1,571 (6.2%)
(66.1% of them are naturalized citizens)
| Here: | 6.6 |
| State: | 6.5 |
| Here: | 4.3 |
| State: | 4.3 |
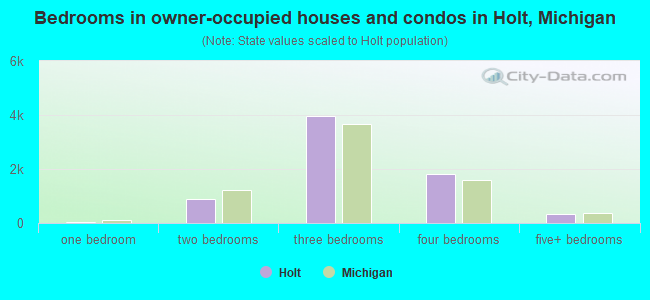
- Bedrooms in owner-occupied houses and condos in Holt, Michigan
- 0no bedroom
- 191 bedroom
- 8772 bedrooms
- 3,9543 bedrooms
- 1,8134 bedrooms
- 3385+ bedrooms
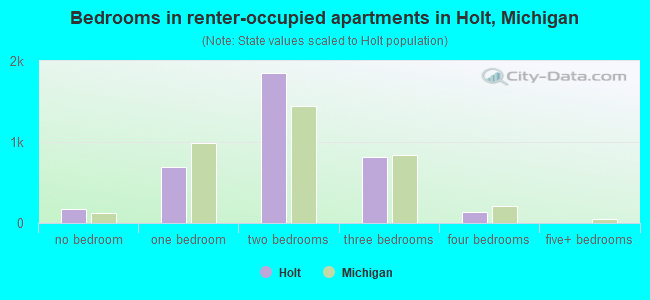
- Bedrooms in renter-occupied apartments in Holt, Michigan
- 172no bedroom
- 6941 bedroom
- 1,8492 bedrooms
- 8103 bedrooms
- 1374 bedrooms
- 05+ bedrooms

- Cars and other vehicles available in Holt in owner-occupied houses/condos
- 163no vehicle
- 1,9751 vehicle
- 3,5032 vehicles
- 9413 vehicles
- 2834 vehicles
- 1375+ vehicles
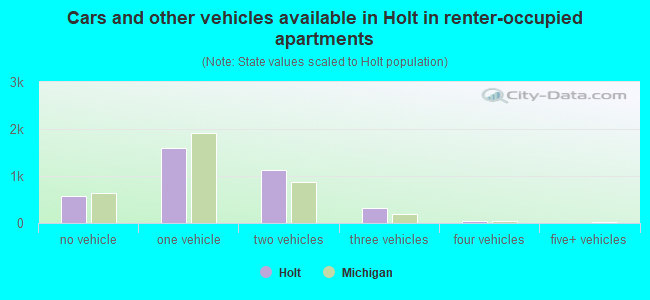
- Cars and other vehicles available in Holt in renter-occupied apartments
- 574no vehicle
- 1,5991 vehicle
- 1,1302 vehicles
- 3283 vehicles
- 324 vehicles
- 05+ vehicles
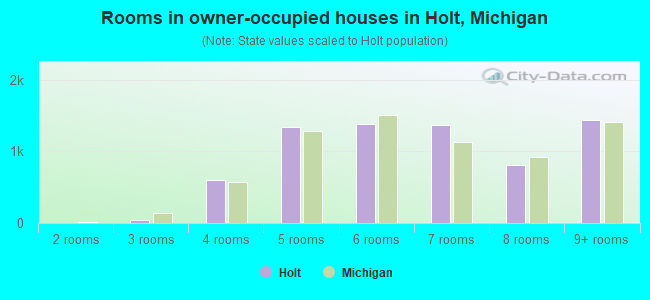
- Rooms in owner-occupied houses in Holt, Michigan
- 01 room
- 02 rooms
- 473 rooms
- 6044 rooms
- 1,3435 rooms
- 1,3876 rooms
- 1,3647 rooms
- 8108 rooms
- 1,4469+ rooms

- Rooms in renter-occupied apartments in Holt, Michigan
- 1721 room
- 1762 rooms
- 4633 rooms
- 1,2994 rooms
- 6965 rooms
- 5346 rooms
- 727 rooms
- 498 rooms
- 2029+ rooms

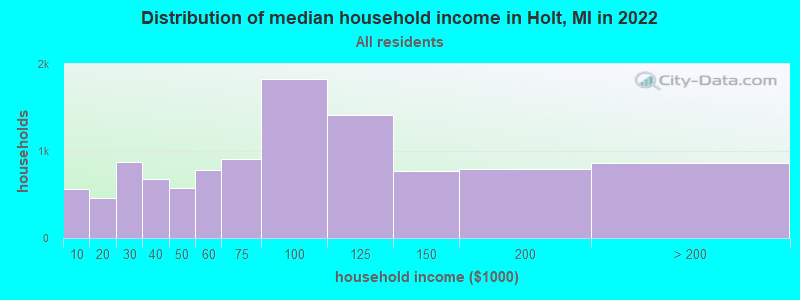
Holt, MI household income distribution

- 563Less than $10,000
- 461$10,000 to $19,999
- 871$20,000 to $29,999
- 681$30,000 to $39,999
- 579$40,000 to $49,999
- 778$50,000 to $59,999
- 910$60,000 to $74,999
- 1,832$75,000 to $99,999
- 1,419$100,000 to $124,999
- 768$125,000 to $149,999
- 796$150,000 to $199,999
- 863$200,000 or more
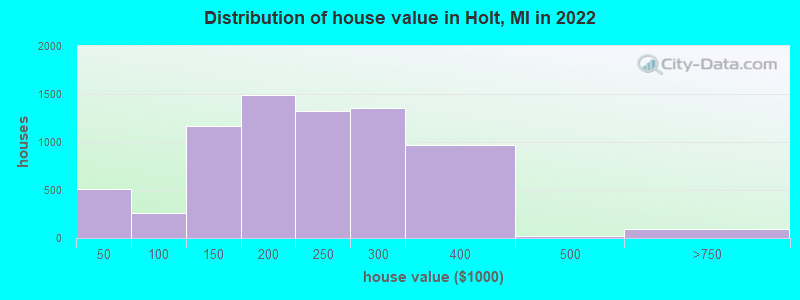
Home value of owner - occupied houses in 2022 in Holt, MI
-
- 203Less than $10,000
- 58$10,000 to $14,999
- 102$15,000 to $19,999
- 137$20,000 to $24,999
- 12$25,000 to $29,999
- 15$50,000 to $59,999
- 121$60,000 to $69,999
- 47$80,000 to $89,999
- 80$90,000 to $99,999
- 452$100,000 to $124,999
- 709$125,000 to $149,999
- 725$150,000 to $174,999
- 763$175,000 to $199,999
- 1,323$200,000 to $249,999
- 1,356$250,000 to $299,999
- 973$300,000 to $399,999
- 22$400,000 to $499,999
- 95$500,000 to $749,999
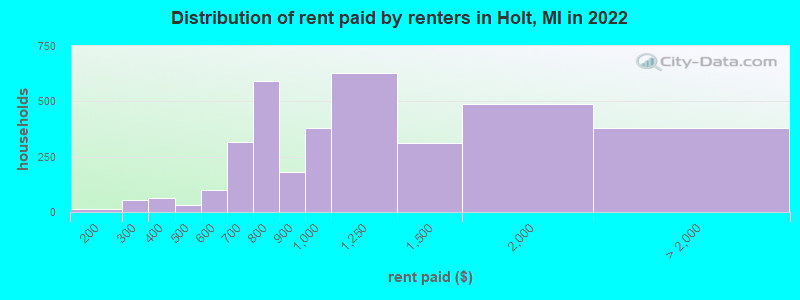
Rent paid by renters in 2022 in Holt, MI
-
- 15$100 to $149
- 26$200 to $249
- 25$250 to $299
- 29$300 to $349
- 31$350 to $399
- 18$400 to $449
- 12$450 to $499
- 66$500 to $549
- 34$550 to $599
- 274$600 to $649
- 41$650 to $699
- 252$700 to $749
- 339$750 to $799
- 179$800 to $899
- 380$900 to $999
- 628$1,000 to $1,249
- 309$1,250 to $1,499
- 489$1,500 to $1,999
- 256$2,000 to $2,499
- 57$2,500 to $2,999
- 15$3,000 to $3,499
- 52No cash rent
Percentage of workers working in this county: 82.6%
Number of people working at home: 2,156 (15.7% of all workers)
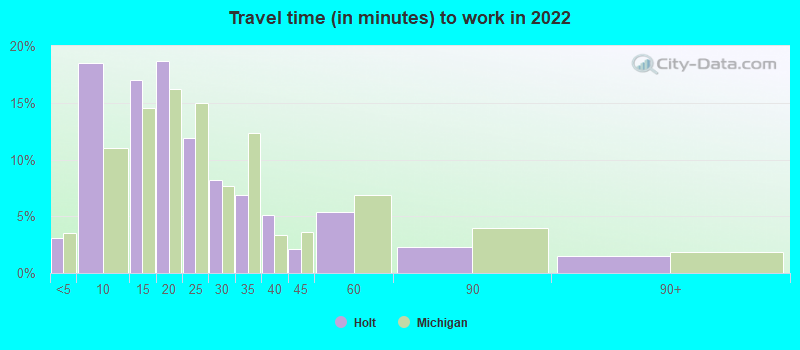
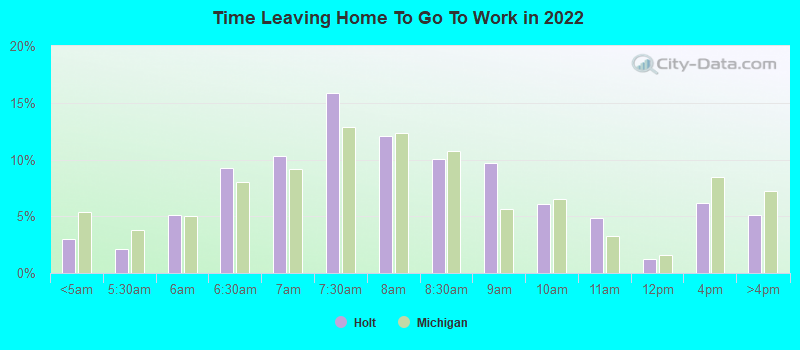
Travel time to work (commute)
- Less than 5 minutes: 286
- 5 to 9 minutes: 1,088
- 10 to 14 minutes: 1,418
- 15 to 19 minutes: 2,513
- 20 to 24 minutes: 3,287
- 25 to 29 minutes: 795
- 30 to 34 minutes: 868
- 35 to 39 minutes: 333
- 40 to 44 minutes: 92
- 45 to 59 minutes: 301
- 60 to 89 minutes: 473
- 90 or more minutes: 181
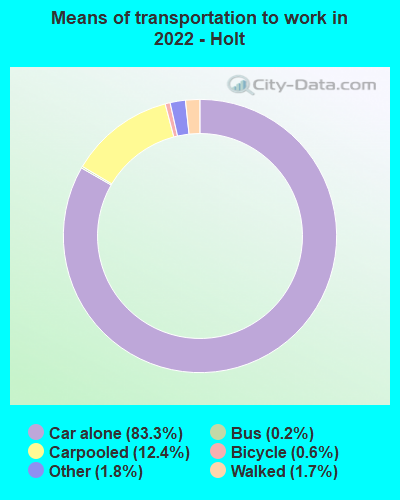
Means of transportation to work:
- Drove a car alone: 4,499 (61.0%)
- Carpooled: 619 (8.4%)
- Bus: 9 (0.1%)
- Taxi: 136 (1.8%)
- Bicycle: 61 (0.8%)
- Walked: 120 (1.6%)
- Worked at home: 2,156 (29.2%)
- Unemployment by race in 2022
- Unemployment rate for White non-Hispanic residents
- 1.6%Males
- 4.1%Females
- Unemployment rate for Black residents
- 2.3%Males
- 28.1%Females
- Unemployment rate for Asian residents
- 2.7%Females
- Unemployment rate for other race residents
- 7.0%Males
- Unemployment rate for two or more race residents
- 5.8%Males
- 6.5%Females
- Unemployment rate for Hispanic or Latino residents
- 0.9%Males
- 11.6%Females
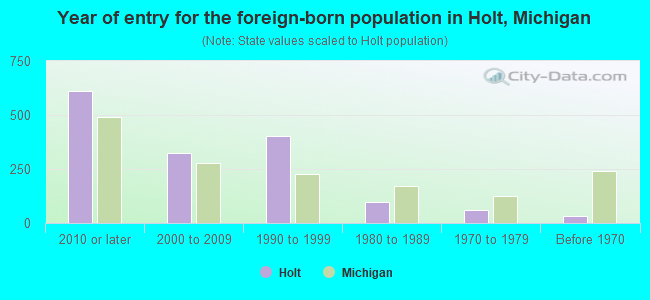
- Year of entry for the foreign-born population in Holt, Michigan
- 6122010 or later
- 3242000 to 2009
- 4041990 to 1999
- 981980 to 1989
- 581970 to 1979
- 34Before 1970
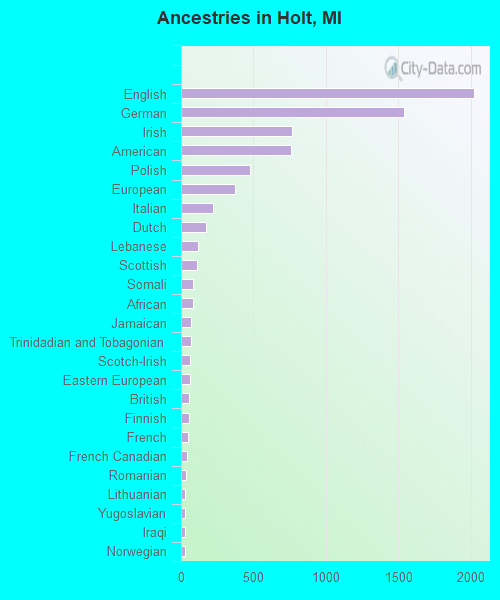
First ancestries reported:
- English: 2,023 (20.0%)
- German: 1,541 (15.2%)
- Irish: 767 (7.6%)
- American: 761 (7.5%)
- Polish: 474 (4.7%)
- European: 373 (3.7%)
- Italian: 224 (2.2%)
- Dutch: 173 (1.7%)
- Lebanese: 117 (1.2%)
- Scottish: 112 (1.1%)
- Somali: 84 (0.8%)
- African: 81 (0.8%)
- Jamaican: 70 (0.7%)
- Trinidadian and Tobagonian: 66 (0.7%)
- Scotch-Irish: 61 (0.6%)
- Eastern European: 59 (0.6%)
- British: 55 (0.5%)
- Finnish: 52 (0.5%)
- French: 46 (0.5%)
- French Canadian: 43 (0.4%)
- Romanian: 36 (0.4%)
- Lithuanian: 30 (0.3%)
- Yugoslavian: 30 (0.3%)
- Iraqi: 27 (0.3%)
- Norwegian: 25 (0.2%)
- Ukrainian: 25 (0.2%)
- Brazilian: 22 (0.2%)
- Hungarian: 20 (0.2%)
- Belgian: 17 (0.2%)
- Swiss: 17 (0.2%)
- Portuguese: 16 (0.2%)
- Swedish: 15 (0.1%)
- Slovak: 14 (0.1%)
- Nigerian: 14 (0.1%)
- Austrian: 13 (0.1%)
- Canadian: 13 (0.1%)
- West Indian: 13 (0.1%)
- Czech: 10 (0.10%)
- Slavic: 8 (0.08%)
Most common places of birth for foreign-born residents (%):
| Holt: | 18.4% (297) |
| Michigan: | 11.1% (77,240) |
| Holt: | 13.9% (225) |
| Michigan: | 1.8% (12,679) |
| Holt: | 10.8% (175) |
| Michigan: | 0.5% (3,687) |
| Holt: | 6.9% (111) |
| Michigan: | 2.8% (19,112) |
| Holt: | 5.1% (83) |
| Michigan: | 1.2% (8,563) |
| Holt: | 5.0% (81) |
| Michigan: | 1.0% (7,097) |
| Holt: | 4.0% (65) |
| Michigan: | 4.9% (34,295) |
| Holt: | 3.6% (59) |
| Michigan: | 0.2% (1,188) |
| Holt: | 3.5% (57) |
| Michigan: | 0.7% (4,645) |
| Holt: | 3.1% (50) |
| Michigan: | 3.0% (20,884) |
| Holt: | 3.1% (50) |
| Michigan: | 10.9% (75,965) |
| Holt: | 2.3% (37) |
| Michigan: | 3.7% (25,634) |
| Holt: | 2.2% (35) |
| Michigan: | 8.1% (55,954) |
| Holt: | 2.0% (32) |
| Michigan: | 1.1% (7,485) |
| Holt: | 1.9% (30) |
| Michigan: | 0.6% (4,450) |
| Holt: | 1.9% (30) |
| Michigan: | 1.1% (7,792) |
Place of birth for U.S.-born residents:
- This state: 19,678
- Other state: 4,022
- Northeast: 668
- Midwest: 1,877
- South: 810
- West: 678
86.4% of Holt residents lived in the same house 1 years ago.
Out of people who lived in different houses, 32.4% lived in this county.
Out of people who lived in different counties, 70.9% lived in Michigan.
| Holt: | 86.4% |
| State average: | 88.4% |
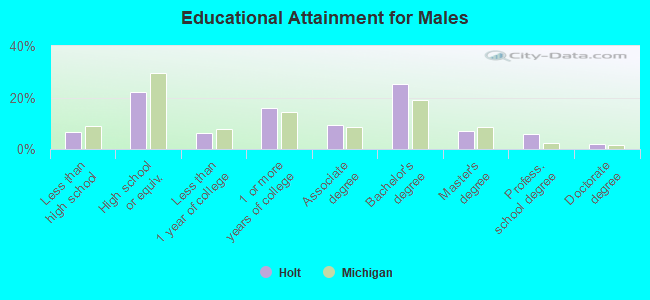
Education attainment for males 25 years and older:
- No schooling: 87
- Nursery to 4th grade: 0
- 5th and 6th grade: 15
- 7th and 8th grade: 0
- 9th grade: 11
- 10th grade: 168
- 11th grade: 90
- 12th grade, no diploma: 189
- High school graduate (or equivalency): 1,869
- Less than 1 year of college: 531
- Some college more than 1 year, no degree: 1,346
- Associate degree: 784
- Bachelor's degree: 2,147
- Master's degree: 610
- Professional school degree: 505
- Doctorate degree: 153
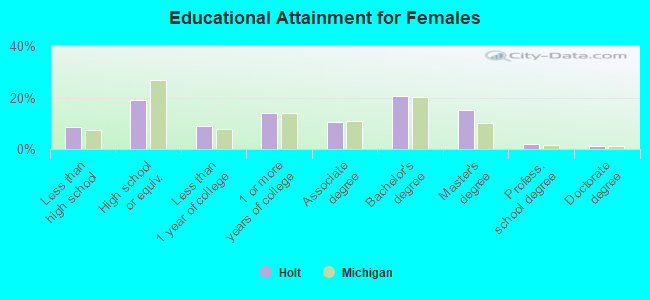
Education attainment for females 25 years and older:
- No schooling: 211
- Nursery to 4th grade: 0
- 5th and 6th grade: 0
- 7th and 8th grade: 0
- 9th grade: 53
- 10th grade: 246
- 11th grade: 226
- 12th grade, no diploma: 30
- High school graduate (or equivalency): 1,740
- Less than 1 year of college: 814
- Some college more than 1 year, no degree: 1,256
- Associate degree: 966
- Bachelor's degree: 1,857
- Master's degree: 1,368
- Professional school degree: 182
- Doctorate degree: 104
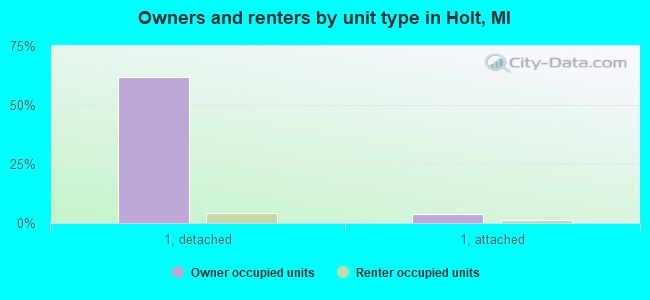
Housing units in structures:
- One, detached: 6,492
- One, attached: 713
- Two: 216
- 3 or 4: 307
- 5 to 9: 756
- 10 to 19: 881
- 20 to 49: 392
- 50 or more: 389
- Mobile homes: 823
Median worth of mobile homes: $12,396
Housing units lacking complete kitchen facilities in 2022: 1.1%
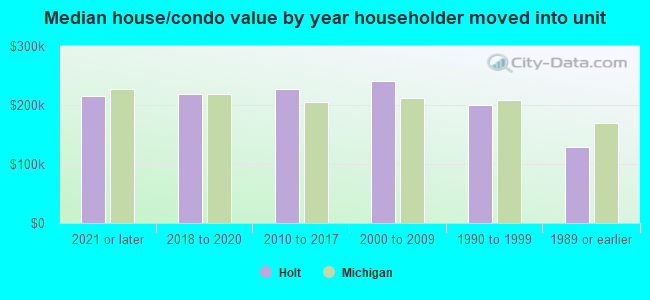
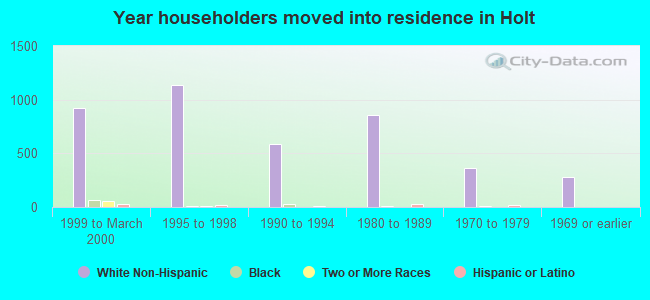
House/condo owner moved in on average 10 years ago
Renter moved in on average 1 years ago
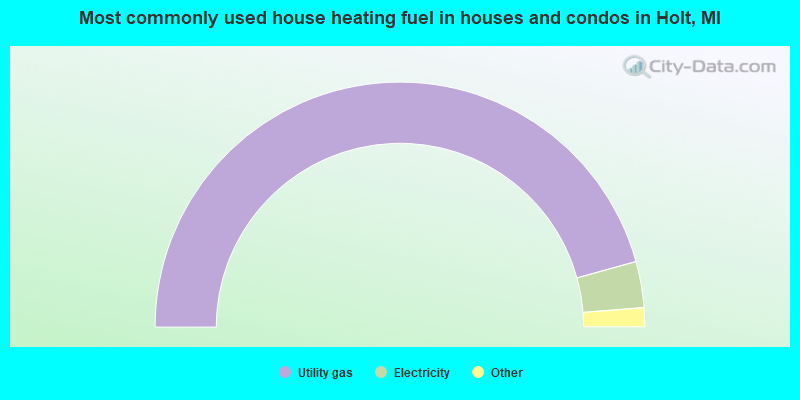
- 91.4%Utility gas
- 6.1%Electricity
- 2.1%Bottled, tank, or LP gas
- 0.2%Fuel oil, kerosene, etc.
- 0.2%Wood
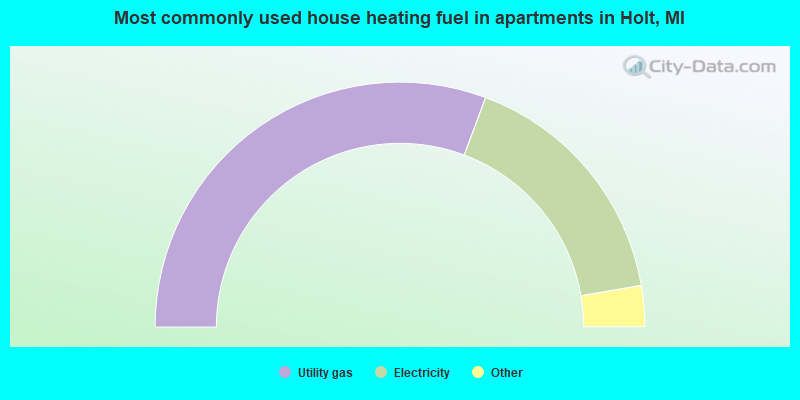
- 61.4%Utility gas
- 33.2%Electricity
- 3.0%Bottled, tank, or LP gas
- 1.4%Other fuel
- 1.0%No fuel used
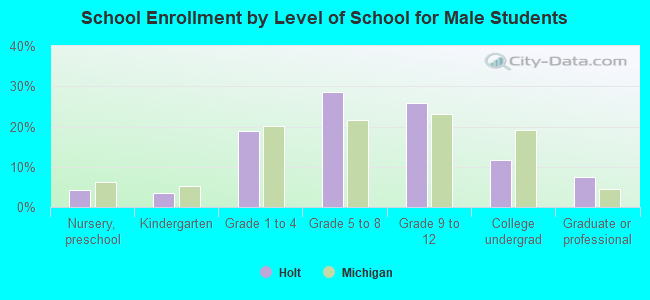
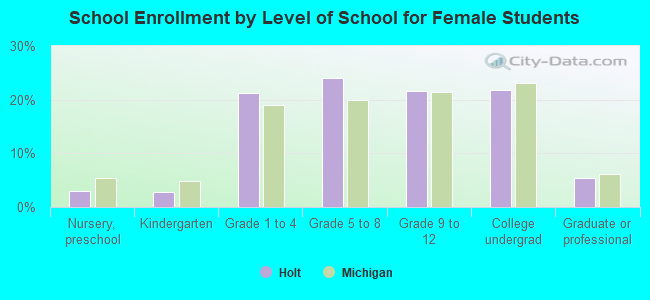
Private vs. public school enrollment:
| Here: | 16.4% |
| Michigan: | 12.4% |
| Here: | 6.9% |
| Michigan: | 9.8% |
| Here: | 11.2% |
| Michigan: | 14.9% |