Holualoa, HI (Hawaii) Houses and Residents
| Holualoa: | $1,265,236 |
| Hawaii: | $820,100 |
Total population: 8,538 (Urban population: 5,574 (all inside urban clusters), Rural population: 534 (81 farm, 453 nonfarm))
Houses: 1,365 (1,135 occupied: 898 owner occupied, 250 renter occupied)
| % of renters here: | 22% |
| State: | 37% |
Housing density: 96 houses/condos per square mile
Median price asked for vacant for-sale houses and condos in 2022 in this county: $596,834.
Median contract rent in 2022: $1,312 (lower quartile is $1,072, upper quartile is $1,808)
Median rent asked for vacant for-rent units in 2022: $49,247
Median gross rent in Holualoa, HI in 2022: $1,411
Housing units in Holualoa with a mortgage: 439 (26 second mortgage, 0 home equity loan, 25 both second mortgage and home equity loan)
Houses without a mortgage: 6
Median household income for houses/condos with a mortgage: $134,747
Median household income for apartments without a mortgage: $76,165
Median monthly housing costs: $1,356
Compare current foreclosures near Holualoa, HI:
| Photo | Address | Area | Beds / Baths | Price | Details |
|---|---|---|---|---|---|

|
#1
Mamalahoa Hwy
Holualoa, HI 96725
|
- sq. feet
|
- baths - beds |
show details | |

|
#2
Mamalahoa Hwy
Holualoa, HI 96725
|
- sq. feet
|
- baths - beds |
show details | |

|
#3
Palani Rd Apt G2
Kailua Kona, HI 96740
|
616 sq. feet
|
1 baths 2 beds |
$138,900
|
show details |

|
#4
5178 Kanai Pl
Kailua Kona, HI 96740
|
- sq. feet
|
1 baths 3 beds |
$519,900
|
show details |

|
#5
Kalani Way # 4
Kailua Kona, HI 96740
|
906 sq. feet
|
2 baths 2 beds |
show details | |

|
#6
Hale Makai Pl
Kailua Kona, HI 96740
|
1,462 sq. feet
|
2 baths 3 beds |
show details | |

|
#7
Hoene St
Kailua Kona, HI 96740
|
- sq. feet
|
2 baths 3 beds |
show details | |

|
#8
Ilau St
Kailua Kona, HI 96740
|
- sq. feet
|
- baths - beds |
show details | |

|
#9
Kuakini Hwy
Kailua Kona, HI 96740
|
- sq. feet
|
- baths - beds |
show details | |

|
#10
Nuhi Pl
Kailua Kona, HI 96740
|
- sq. feet
|
- baths - beds |
show details |
| Photo | Address | Area | Beds / Baths | Price | Details |
|---|---|---|---|---|---|

|
#11
Hooloa St
Kailua Kona, HI 96740
|
- sq. feet
|
- baths - beds |
show details | |

|
#12
Koakoa St
Kailua Kona, HI 96740
|
- sq. feet
|
- baths - beds |
show details | |

|
#13
Alahou St Apt 1
Kailua Kona, HI 96740
|
- sq. feet
|
- baths - beds |
show details | |

|
#14
Kini Loop
Kailua Kona, HI 96740
|
- sq. feet
|
- baths - beds |
show details | |

|
#15
Nani Kailua Dr Apt 34
Kailua Kona, HI 96740
|
- sq. feet
|
- baths - beds |
show details | |

|
#16
Halewili Pl
Kailua Kona, HI 96740
|
- sq. feet
|
- baths - beds |
show details | |

|
#17
Alii Dr Ste 231
Kailua Kona, HI 96740
|
- sq. feet
|
- baths - beds |
show details | |

|
#18
Kamilo St
Kailua Kona, HI 96740
|
- sq. feet
|
- baths - beds |
show details | |

|
#19
Lehua Rd
Kailua Kona, HI 96740
|
- sq. feet
|
- baths - beds |
show details | |

|
#20
Middle Keei Rd
Captain Cook, HI 96704
|
- sq. feet
|
- baths - beds |
show details |
| Photo | Address | Area | Beds / Baths | Price | Details |
|---|---|---|---|---|---|

|
Check over 1 million property listings on Foreclosure.com!
|
browse all offers | |||
| Photo | Address | Area | Beds / Baths | Price | Details |
|---|

Latest news about housing in Holualoa, HI collected exclusively by city-data.com from local newspapers, TV, and radio stations


Median year apartment built: 1980
Household type by relationship:
Households: 3,146- Male householders: 690 (169 living alone), Female householders: 445 (71 living alone)
661 spouses (661 opposite-sex spouses), 36 unmarried partners, (20 opposite-sex unmarried partners), 788 children (783 natural, 5 adopted, 0 stepchildren), 87 grandchildren, 83 brothers or sisters, 93 parents, 0 foster children, 79 other relatives, 167 non-relatives
- In group quarters: 10
Size of family households: 418 2-persons, 114 3-persons, 67 4-persons, 31 5-persons, 175 6-persons, 23 7-or-more-persons.
Size of nonfamily households: 258 1-person, 48 2-persons, 39 3-persons, 8 7-or-more-persons.
546 married couples with children.
115 single-parent households (45 men, 70 women).
83.5% of residents of Holualoa speak English at home.
5.7% of residents speak Spanish at home (73% speak English very well, 27% speak English well).
3.8% of residents speak other Indo-European language at home (64% speak English very well, 36% speak English well).
8.7% of residents speak Asian or Pacific Island language at home (34% speak English very well, 22% speak English well, 44% speak English not well).
Foreign born population: 511 (16.2%)
(49.1% of them are naturalized citizens)
| Here: | 6.5 |
| State: | 5.5 |
| Here: | 5.0 |
| State: | 3.9 |

- Bedrooms in owner-occupied houses and condos in Holualoa, Hawaii
- 20no bedroom
- 01 bedroom
- 1872 bedrooms
- 2413 bedrooms
- 2874 bedrooms
- 1645+ bedrooms

- Bedrooms in renter-occupied apartments in Holualoa, Hawaii
- 28no bedroom
- 231 bedroom
- 982 bedrooms
- 903 bedrooms
- 124 bedrooms
- 05+ bedrooms

- Cars and other vehicles available in Holualoa in owner-occupied houses/condos
- 0no vehicle
- 1951 vehicle
- 3952 vehicles
- 2423 vehicles
- 244 vehicles
- 425+ vehicles

- Cars and other vehicles available in Holualoa in renter-occupied apartments
- 0no vehicle
- 1221 vehicle
- 792 vehicles
- 153 vehicles
- 284 vehicles
- 65+ vehicles

- Rooms in owner-occupied houses in Holualoa, Hawaii
- 201 room
- 02 rooms
- 03 rooms
- 1114 rooms
- 1765 rooms
- 1376 rooms
- 1707 rooms
- 1058 rooms
- 1789+ rooms

- Rooms in renter-occupied apartments in Holualoa, Hawaii
- 281 room
- 02 rooms
- 863 rooms
- 04 rooms
- 325 rooms
- 976 rooms
- 87 rooms
- 08 rooms
- 09+ rooms


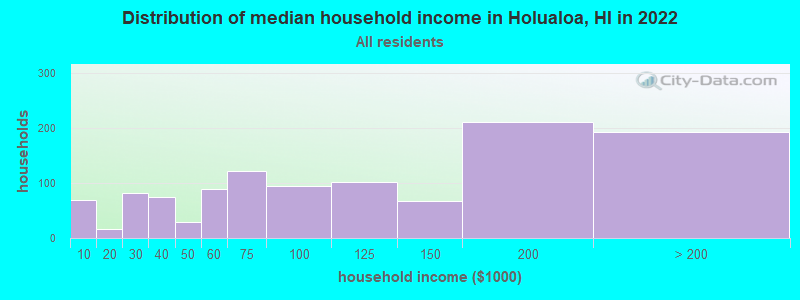
Holualoa, HI household income distribution

- 70Less than $10,000
- 16$10,000 to $19,999
- 82$20,000 to $29,999
- 74$30,000 to $39,999
- 30$40,000 to $49,999
- 90$50,000 to $59,999
- 122$60,000 to $74,999
- 95$75,000 to $99,999
- 102$100,000 to $124,999
- 67$125,000 to $149,999
- 211$150,000 to $199,999
- 192$200,000 or more
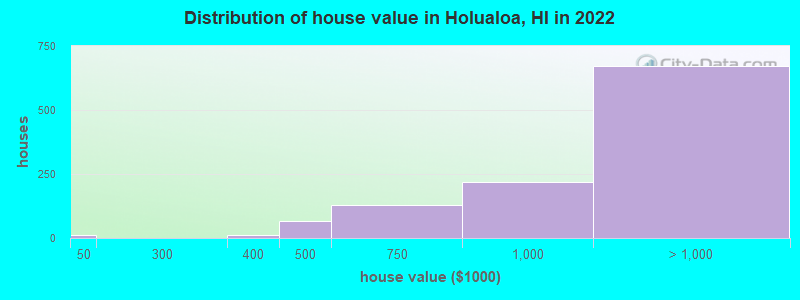
Home value of owner - occupied houses in 2022 in Holualoa, HI
-
- 10$10,000 to $14,999
- 10$300,000 to $399,999
- 67$400,000 to $499,999
- 128$500,000 to $749,999
- 220$750,000 to $999,999
- 506$1,000,000 to $1,499,999
- 68$1,500,000 to $1,999,999
- 95$2,000,000 or more
Rent paid by renters in 2022 in Holualoa, HI
-
- 31$800 to $899
- 61$1,000 to $1,249
- 23$1,250 to $1,499
- 45$1,500 to $1,999
- 8$2,000 to $2,499
- 7$2,500 to $2,999
- 27$3,500 or more
- 8No cash rent


Percentage of workers working in this county: 97.3%
Number of people working at home: 402 (29.8% of all workers)
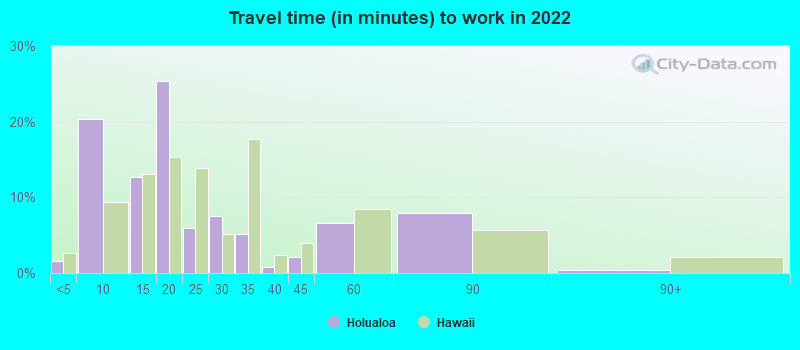
Travel time to work (commute)
- Less than 5 minutes: 43
- 5 to 9 minutes: 103
- 10 to 14 minutes: 145
- 15 to 19 minutes: 130
- 20 to 24 minutes: 145
- 25 to 29 minutes: 27
- 30 to 34 minutes: 207
- 35 to 39 minutes: 91
- 40 to 44 minutes: 21
- 45 to 59 minutes: 29
- 60 to 89 minutes: 25
- 90 or more minutes: 11
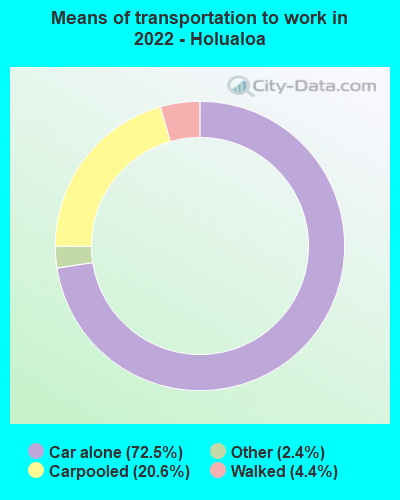
Means of transportation to work:
- Drove a car alone: 530 (38.1%)
- Carpooled: 151 (10.9%)
- Taxi: 17 (1.2%)
- Walked: 30 (2.2%)
- Worked at home: 1,081 (77.7%)

- Unemployment by race in 2022
- Unemployment rate for White non-Hispanic residents
- 6.4%Females
- Unemployment rate for other race residents
- 24.3%Males
- Unemployment rate for Hispanic or Latino residents
- 30.4%Males

- Year of entry for the foreign-born population in Holualoa, Hawaii
- 1032010 or later
- 1172000 to 2009
- 1701990 to 1999
- 1041980 to 1989
- 691970 to 1979
- 124Before 1970

First ancestries reported:
- German: 236 (19.4%)
- American: 92 (7.6%)
- English: 88 (7.3%)
- Irish: 56 (4.6%)
- European: 54 (4.5%)
- Polish: 43 (3.5%)
- Pennsylvania German: 26 (2.1%)
- Swiss: 24 (2.0%)
- Brazilian: 14 (1.2%)
- Scandinavian: 14 (1.2%)
- Canadian: 13 (1.1%)
- Italian: 11 (0.9%)
- Scottish: 10 (0.8%)
- Northern European: 8 (0.7%)
- British: 6 (0.5%)
- Hungarian: 6 (0.5%)
- Lithuanian: 6 (0.5%)
Most common places of birth for foreign-born residents (%):
| Holualoa: | 29.9% (160) |
| Hawaii: | 1.1% (2,843) |
| Holualoa: | 20.3% (109) |
| Hawaii: | 7.6% (19,835) |
| Holualoa: | 17.2% (92) |
| Hawaii: | 1.8% (4,752) |
| Holualoa: | 6.7% (36) |
| Hawaii: | 8.5% (22,321) |
| Holualoa: | 5.0% (27) |
| Hawaii: | 1.8% (4,635) |
| Holualoa: | 3.4% (18) |
| Hawaii: | 0.1% (352) |
| Holualoa: | 3.4% (18) |
| Hawaii: | 0.1% (326) |
| Holualoa: | 2.6% (14) |
| Hawaii: | 0.4% (979) |
| Holualoa: | 2.4% (13) |
| Hawaii: | 0.5% (1,303) |
| Holualoa: | 2.4% (13) |
| Hawaii: | 0.1% (180) |
Place of birth for U.S.-born residents:
- This state: 805
- Other state: 1,802
- Northeast: 113
- Midwest: 256
- South: 284
- West: 1,144
88.8% of Holualoa residents lived in the same house 1 years ago.
Out of people who lived in different houses, 28.3% lived in this county.
Out of people who lived in different counties, 0.0% lived in Hawaii.
| Holualoa: | 88.8% |
| State average: | 87.8% |
Education attainment for males 25 years and older:
- No schooling: 0
- Nursery to 4th grade: 0
- 5th and 6th grade: 0
- 7th and 8th grade: 37
- 9th grade: 0
- 10th grade: 15
- 11th grade: 41
- 12th grade, no diploma: 9
- High school graduate (or equivalency): 186
- Less than 1 year of college: 45
- Some college more than 1 year, no degree: 278
- Associate degree: 14
- Bachelor's degree: 334
- Master's degree: 114
- Professional school degree: 8
- Doctorate degree: 38

Education attainment for females 25 years and older:
- No schooling: 39
- Nursery to 4th grade: 0
- 5th and 6th grade: 0
- 7th and 8th grade: 37
- 9th grade: 0
- 10th grade: 0
- 11th grade: 32
- 12th grade, no diploma: 0
- High school graduate (or equivalency): 102
- Less than 1 year of college: 174
- Some college more than 1 year, no degree: 165
- Associate degree: 45
- Bachelor's degree: 313
- Master's degree: 205
- Professional school degree: 85
- Doctorate degree: 7


Housing units in structures:
- One, detached: 1,258
- One, attached: 46
- Two: 21
- 5 to 9: 13
- 50 or more: 19
- Boats, RVs, vans, etc.: 6
Housing units lacking complete kitchen facilities in 2022: 0.2%
House/condo owner moved in on average 6 years ago
Renter moved in on average 3 years ago

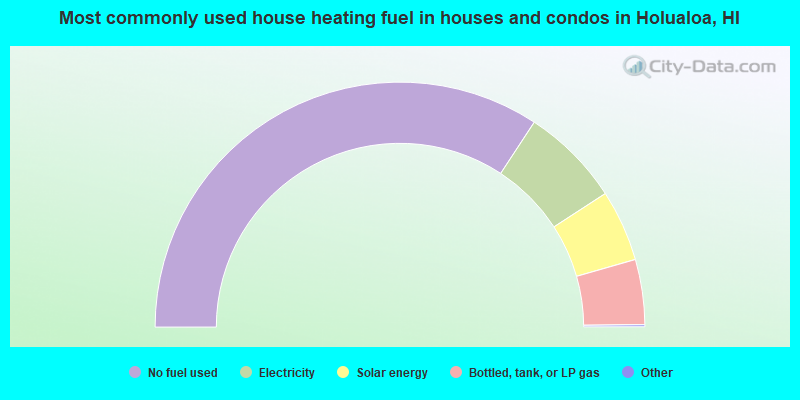
- 68.7%No fuel used
- 13.2%Electricity
- 9.5%Solar energy
- 8.6%Bottled, tank, or LP gas
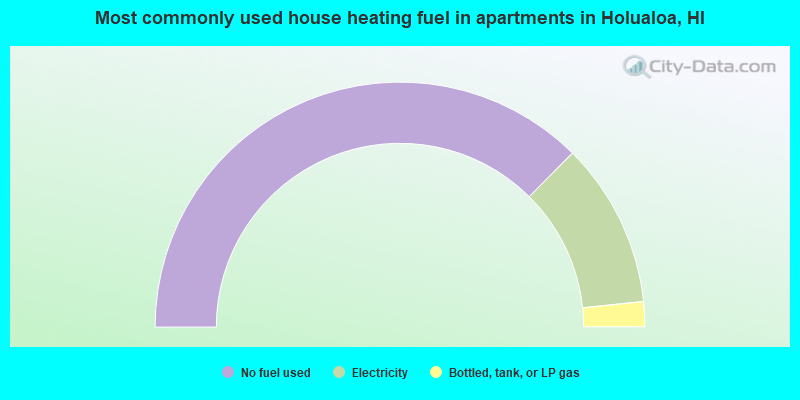
- 74.9%No fuel used
- 21.8%Electricity
- 3.3%Bottled, tank, or LP gas
Private vs. public school enrollment:
| Here: | 42.9% |
| Hawaii: | 21.6% |
| Here: | 5.9% |
| Hawaii: | 21.5% |
| Here: | 71.4% |
| Hawaii: | 23.3% |


