Homer, IL (Illinois) Houses and Residents
| Homer: | $121,569 |
| Illinois: | $251,600 |
Mean price in 2022:
Detached houses: $137,717
Here: $137,717 State: $310,164 Mobile homes: $29,563
Here: $29,563 State: $78,855
Total population: 1,207 (Urban population: 0, Rural population: 1,187 (all nonfarm))
Houses: 514 (466 occupied: 384 owner occupied, 86 renter occupied)
| % of renters here: | 18% |
| State: | 33% |
Housing density: 501 houses/condos per square mile
Median price asked for vacant for-sale houses and condos in 2022: $78,696.
Median contract rent in 2022: $663 (lower quartile is $587, upper quartile is $904)
Median rent asked for vacant for-rent units in 2022: $784
Median gross rent in Homer, IL in 2022: $867
Housing units in Homer with a mortgage: 257 (6 second mortgage, 0 home equity loan, 7 both second mortgage and home equity loan)
Houses without a mortgage: 1
Median household income for houses/condos with a mortgage: $79,540
Median household income for apartments without a mortgage: $60,020
Median monthly housing costs: $983
Compare current foreclosures near Homer, IL:
| Photo | Address | Area | Beds / Baths | Price | Details |
|---|---|---|---|---|---|

|
#1
N West St
Homer, IL 61849
|
- sq. feet
|
- baths - beds |
show details | |

|
#2
County Road 1050 N
Homer, IL 61849
|
- sq. feet
|
- baths - beds |
show details | |

|
#3
W Bradley Ave
Champaign, IL 61820
|
1,202 sq. feet
|
1 baths 2 beds |
$139,000
|
show details |

|
#4
S Church St
Homer, IL 61849
|
- sq. feet
|
- baths - beds |
show details | |

|
#5
E Hancock St
Longview, IL 61852
|
2 sq. feet
|
1 baths 3 beds |
show details | |

|
#6
N Vermilion Ave
Allerton, IL 61810
|
1,560 sq. feet
|
2 baths 3 beds |
show details | |

|
#7
W Hill St
Champaign, IL 61820
|
918 sq. feet
|
2 baths - beds |
show details | |

|
#8
Lantern Hill Dr
Urbana, IL 61802
|
912 sq. feet
|
2 baths - beds |
show details | |

|
#9
S Spruce St
Villa Grove, IL 61956
|
1,200 sq. feet
|
1 baths 4 beds |
show details | |

|
#10
N Pine St
Villa Grove, IL 61956
|
1,077 sq. feet
|
1 baths 2 beds |
show details |
| Photo | Address | Area | Beds / Baths | Price | Details |
|---|---|---|---|---|---|

|
#11
E Elm St
Villa Grove, IL 61956
|
1 sq. feet
|
1 baths 2 beds |
show details | |

|
#12
Kingsdale Ave
Tilton, IL 61833
|
969 sq. feet
|
1 baths 2 beds |
show details | |

|
#13
N Eastern Ave
Urbana, IL 61802
|
- sq. feet
|
- baths - beds |
show details | |

|
#14
S Walnut St
Urbana, IL 61801
|
- sq. feet
|
- baths - beds |
show details | |

|
#15
John Jay St
Urbana, IL 61802
|
- sq. feet
|
- baths - beds |
show details | |

|
#16
E Michigan Ave Apt 3
Urbana, IL 61801
|
- sq. feet
|
- baths - beds |
show details | |

|
#17
W Illinois St Apt 412
Urbana, IL 61801
|
- sq. feet
|
- baths - beds |
show details | |

|
#18
Betsy Ross Dr
Urbana, IL 61802
|
- sq. feet
|
- baths - beds |
show details | |

|
#19
W Center St
Catlin, IL 61817
|
- sq. feet
|
- baths - beds |
show details | |

|
#20
W Illinois St Apt 311
Urbana, IL 61801
|
- sq. feet
|
- baths - beds |
show details |
| Photo | Address | Area | Beds / Baths | Price | Details |
|---|---|---|---|---|---|

|
#21
Oakland Ave Apt 206
Urbana, IL 61802
|
- sq. feet
|
- baths - beds |
show details | |

|
#22
W Park St
Urbana, IL 61801
|
- sq. feet
|
- baths - beds |
show details | |

|
#23
Peach Tree St
Urbana, IL 61802
|
- sq. feet
|
- baths - beds |
show details | |

|
#24
W Church St
Urbana, IL 61801
|
- sq. feet
|
- baths - beds |
show details | |

|
#25
Quail Run Dr
Savoy, IL 61874
|
- sq. feet
|
- baths - beds |
show details | |

|
#26
E White St
Champaign, IL 61820
|
- sq. feet
|
- baths - beds |
show details | |

|
#27
E Hill St
Champaign, IL 61820
|
- sq. feet
|
- baths - beds |
show details | |

|
#28
Carver Dr
Champaign, IL 61820
|
- sq. feet
|
- baths - beds |
show details | |

|
#29
N 4th St # 1304
Champaign, IL 61820
|
- sq. feet
|
- baths - beds |
show details | |

|
#30
Westwood Dr
Catlin, IL 61817
|
- sq. feet
|
- baths - beds |
show details |
| Photo | Address | Area | Beds / Baths | Price | Details |
|---|---|---|---|---|---|

|
#31
E Main St Apt C
Tolono, IL 61880
|
- sq. feet
|
- baths - beds |
show details | |

|
#32
E Marshall St
Tolono, IL 61880
|
- sq. feet
|
- baths 3 beds |
show details | |

|
#33
Melrose Dr Apt C
Champaign, IL 61820
|
- sq. feet
|
- baths - beds |
show details | |

|
#34
E Main St Ste 200
Champaign, IL 61820
|
- sq. feet
|
- baths - beds |
show details | |

|
#35
W Washington St
Champaign, IL 61820
|
- sq. feet
|
- baths - beds |
show details | |

|
#36
N Champaign St
Champaign, IL 61820
|
- sq. feet
|
- baths - beds |
show details | |

|
#37
W Columbia Ave
Champaign, IL 61820
|
- sq. feet
|
- baths - beds |
show details | |

|
#38
David Dr
Champaign, IL 61821
|
- sq. feet
|
- baths - beds |
show details | |

|
#39
W Austin St
Tolono, IL 61880
|
- sq. feet
|
- baths - beds |
show details | |

|
#40
Meadowlane Dr
Catlin, IL 61817
|
- sq. feet
|
- baths - beds |
show details |
| Photo | Address | Area | Beds / Baths | Price | Details |
|---|---|---|---|---|---|

|
#41
S Orchard St Apt 102
Urbana, IL 61801
|
- sq. feet
|
- baths - beds |
show details | |

|
#42
W Church St
Champaign, IL 61821
|
- sq. feet
|
- baths - beds |
show details | |

|
#43
E Florida Ave Apt 104
Urbana, IL 61802
|
- sq. feet
|
- baths - beds |
show details | |

|
#44
E High St
Urbana, IL 61802
|
- sq. feet
|
- baths - beds |
show details | |

|
#45
County Road 1900 N
Saint Joseph, IL 61873
|
- sq. feet
|
- baths - beds |
show details | |

|
#46
County Road 2200 E
Saint Joseph, IL 61873
|
- sq. feet
|
- baths - beds |
show details | |

|
#47
E Woodland Dr
Saint Joseph, IL 61873
|
- sq. feet
|
- baths - beds |
show details | |

|
#48
Eagle Ridge Ct Apt D
Urbana, IL 61802
|
- sq. feet
|
- baths - beds |
show details | |

|
#49
Shemauger Trl
Urbana, IL 61802
|
- sq. feet
|
- baths - beds |
show details | |

|
Check over 1 million property listings on Foreclosure.com!
|
browse all offers | |||

Latest news about housing in Homer, IL collected exclusively by city-data.com from local newspapers, TV, and radio stations

 | "Married with Children": The Bundy Household...where SHOULD they have lived? (83 replies) |
| Oak Park homes under $300K? (75 replies) |
| Overrated and underrated suburbs Chicago (119 replies) |
| Moving to Chicago suburbs 2021 (64 replies) |
| Orland Park, Orland Township, Homer Glen (5 replies) |
| Orland Park vs Homer Glen (6 replies) |

Median year apartment built: 1949
Household type by relationship:
Households: 1,060- Male householders: 247 (97 living alone), Female householders: 211 (66 living alone)
163 spouses (161 opposite-sex spouses), 15 unmarried partners, (15 opposite-sex unmarried partners), 358 children (306 natural, 22 adopted, 30 stepchildren), 18 grandchildren, 7 brothers or sisters, 0 parents, 0 foster children, 19 other relatives, 22 non-relatives
Size of family households: 169 2-persons, 52 3-persons, 24 4-persons, 23 5-persons, 11 6-persons, 1 7-or-more-persons.
Size of nonfamily households: 172 1-person, 15 2-persons.
82 married couples with children.
108 single-parent households (26 men, 82 women).
98.6% of residents of Homer speak English at home.
0.3% of residents speak Spanish at home (100% speak English very well).
| Here: | 6.2 |
| State: | 6.4 |
| Here: | 4.5 |
| State: | 4.1 |

- Bedrooms in owner-occupied houses and condos in Homer, Illinois
- 0no bedroom
- 51 bedroom
- 1062 bedrooms
- 1653 bedrooms
- 894 bedrooms
- 185+ bedrooms

- Bedrooms in renter-occupied apartments in Homer, Illinois
- 0no bedroom
- 51 bedroom
- 472 bedrooms
- 323 bedrooms
- 24 bedrooms
- 05+ bedrooms

- Cars and other vehicles available in Homer in owner-occupied houses/condos
- 0no vehicle
- 1551 vehicle
- 1372 vehicles
- 643 vehicles
- 174 vehicles
- 115+ vehicles

- Cars and other vehicles available in Homer in renter-occupied apartments
- 3no vehicle
- 401 vehicle
- 372 vehicles
- 43 vehicles
- 04 vehicles
- 25+ vehicles

- Rooms in owner-occupied houses in Homer, Illinois
- 01 room
- 02 rooms
- 53 rooms
- 264 rooms
- 835 rooms
- 1296 rooms
- 487 rooms
- 498 rooms
- 439+ rooms

- Rooms in renter-occupied apartments in Homer, Illinois
- 01 room
- 02 rooms
- 63 rooms
- 374 rooms
- 85 rooms
- 326 rooms
- 17 rooms
- 28 rooms
- 09+ rooms


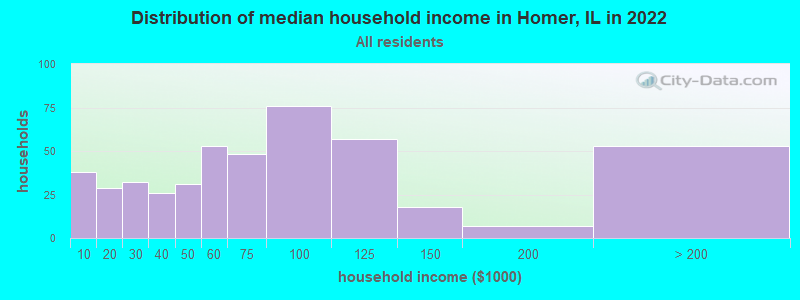
Homer, IL household income distribution

- 38Less than $10,000
- 29$10,000 to $19,999
- 32$20,000 to $29,999
- 26$30,000 to $39,999
- 31$40,000 to $49,999
- 53$50,000 to $59,999
- 48$60,000 to $74,999
- 76$75,000 to $99,999
- 57$100,000 to $124,999
- 18$125,000 to $149,999
- 7$150,000 to $199,999
- 53$200,000 or more
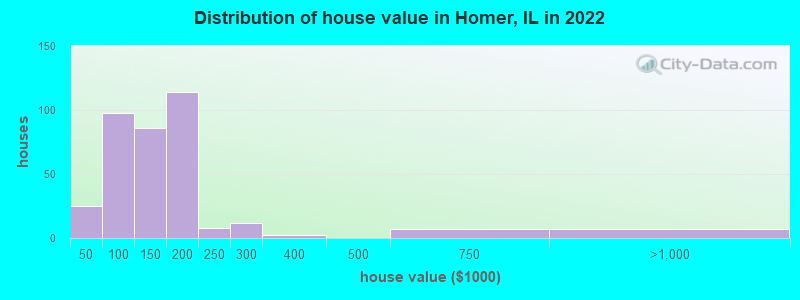
Home value of owner - occupied houses in 2022 in Homer, IL
-
- 9Less than $10,000
- 2$25,000 to $29,999
- 6$30,000 to $34,999
- 3$35,000 to $39,999
- 3$40,000 to $49,999
- 5$50,000 to $59,999
- 26$60,000 to $69,999
- 6$70,000 to $79,999
- 27$80,000 to $89,999
- 28$90,000 to $99,999
- 58$100,000 to $124,999
- 26$125,000 to $149,999
- 82$150,000 to $174,999
- 31$175,000 to $199,999
- 8$200,000 to $249,999
- 12$250,000 to $299,999
- 2$300,000 to $399,999
- 7$500,000 to $749,999
- 6$750,000 to $999,999
Rent paid by renters in 2022 in Homer, IL
-
- 6$300 to $349
- 4$350 to $399
- 16$550 to $599
- 4$600 to $649
- 24$650 to $699
- 2$750 to $799
- 5$800 to $899
- 20$900 to $999
- 0$1,000 to $1,249


Percentage of workers working in this county: 91.2%
Number of people working at home: 52 (9.0% of all workers)
Travel time to work (commute)
- Less than 5 minutes: 26
- 5 to 9 minutes: 21
- 10 to 14 minutes: 22
- 15 to 19 minutes: 11
- 20 to 24 minutes: 60
- 25 to 29 minutes: 43
- 30 to 34 minutes: 185
- 35 to 39 minutes: 23
- 40 to 44 minutes: 17
- 45 to 59 minutes: 26
- 60 to 89 minutes: 2
- 90 or more minutes: 2
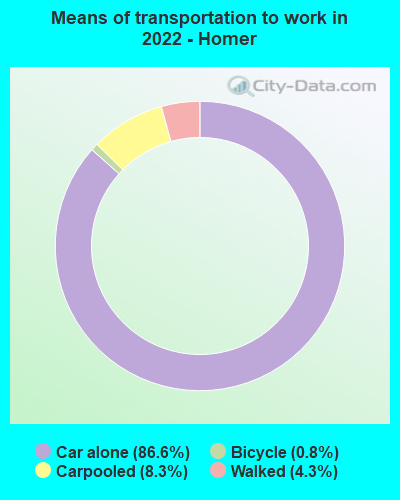
Means of transportation to work:
- Drove a car alone: 216 (76.6%)
- Carpooled: 18 (6.4%)
- Bicycle: 1 (0.4%)
- Walked: 9 (3.2%)
- Worked at home: 44 (15.6%)

- Unemployment by race in 2022
- Unemployment rate for White non-Hispanic residents
- 5.8%Males
- 0.5%Females

- Year of entry for the foreign-born population in Homer, Illinois
- 01995 to March 2000
- 01990 to 1994
- 01985 to 1989
- 01980 to 1984
- 01975 to 1979
- 01970 to 1974
- 01965 to 1969
- 3Before 1965

First ancestries reported:
- German: 181 (31.0%)
- American: 122 (20.9%)
- English: 79 (13.5%)
- Irish: 24 (4.1%)
- French: 15 (2.6%)
- European: 8 (1.4%)
- Scotch-Irish: 5 (0.9%)
- British: 3 (0.5%)
- Hungarian: 3 (0.5%)
- Polish: 3 (0.5%)
- Russian: 3 (0.5%)
- Egyptian: 2 (0.3%)
- Swedish: 2 (0.3%)
- Scottish: 1 (0.2%)
Most common places of birth for foreign-born residents (%):
| Homer: | 100.0% (3) |
| Illinois: | 2.1% (32,764) |
Place of birth for U.S.-born residents:
- This state: 881
- Other state: 150
- Northeast: 9
- Midwest: 55
- South: 59
- West: 27
92.3% of Homer residents lived in the same house 1 years ago.
Out of people who lived in different houses, 42.1% lived in this county.
Out of people who lived in different counties, 66.7% lived in Illinois.
| Homer: | 92.3% |
| State average: | 88.3% |
Education attainment for males 25 years and older:
- No schooling: 4
- Nursery to 4th grade: 0
- 5th and 6th grade: 0
- 7th and 8th grade: 0
- 9th grade: 2
- 10th grade: 6
- 11th grade: 1
- 12th grade, no diploma: 1
- High school graduate (or equivalency): 148
- Less than 1 year of college: 25
- Some college more than 1 year, no degree: 50
- Associate degree: 13
- Bachelor's degree: 42
- Master's degree: 9
- Professional school degree: 0
- Doctorate degree: 0

Education attainment for females 25 years and older:
- No schooling: 4
- Nursery to 4th grade: 0
- 5th and 6th grade: 0
- 7th and 8th grade: 2
- 9th grade: 0
- 10th grade: 4
- 11th grade: 2
- 12th grade, no diploma: 0
- High school graduate (or equivalency): 111
- Less than 1 year of college: 18
- Some college more than 1 year, no degree: 59
- Associate degree: 84
- Bachelor's degree: 49
- Master's degree: 5
- Professional school degree: 0
- Doctorate degree: 0


Housing units in structures:
- One, detached: 444
- One, attached: 3
- Two: 35
- 3 or 4: 6
- Mobile homes: 25
Median worth of mobile homes: $12,126
Housing units lacking complete kitchen facilities in 2022: 2.6%
House/condo owner moved in on average 9 years ago
Renter moved in on average 0 years ago

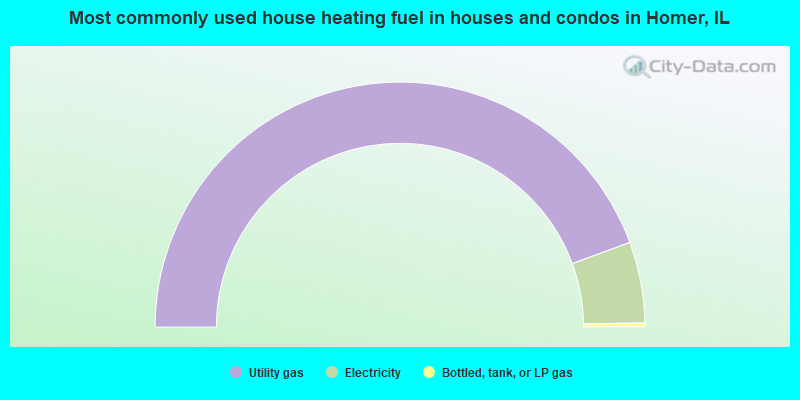
- 88.8%Utility gas
- 10.7%Electricity
- 0.5%Bottled, tank, or LP gas
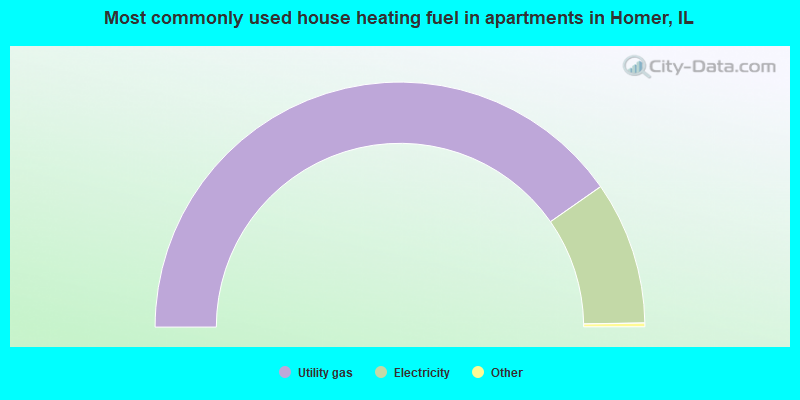
- 81.0%Utility gas
- 19.0%Electricity
Private vs. public school enrollment:
| Here: | 0.0% |
| Illinois: | 13.3% |
| Here: | 41.7% |
| Illinois: | 9.9% |
| Here: | 18.5% |
| Illinois: | 27.4% |


