Hopewell, IL (Illinois) Houses and Residents
| Hopewell: | $188,674 |
| Illinois: | $251,600 |
Mean price in 2022:
Detached houses: $239,949
Here: $239,949 State: $310,164
Total population: 405 (Urban population: 0, Rural population: 364 (all nonfarm))
Houses: 203 (198 occupied: 201 owner occupied, 0 renter occupied)
| % of renters here: | 0% |
| State: | 33% |
Housing density: 180 houses/condos per square mile
Median price asked for vacant for-sale houses and condos in 2022 in this county: $74,950.
Median gross rent in Hopewell, IL in 2022: $-661,577,607
Housing units in Hopewell with a mortgage: 118 (20 second mortgage, 0 home equity loan, 7 both second mortgage and home equity loan)
Houses without a mortgage: 3
Median household income for houses/condos with a mortgage: $108,562
Median household income for apartments without a mortgage: $78,993
Median monthly housing costs: $1,151
Compare current foreclosures near Hopewell, IL:
| Photo | Address | Area | Beds / Baths | Price | Details |
|---|---|---|---|---|---|

|
#1
Hickory Point Rd
Metamora, IL 61548
|
- sq. feet
|
1 baths 2 beds |
$114,900
|
show details |

|
#2
N 3rd St
Chillicothe, IL 61523
|
- sq. feet
|
- baths - beds |
$34,500
|
show details |

|
#3
W Santa Fe Ave
Toluca, IL 61369
|
2 sq. feet
|
2 baths 4 beds |
show details | |

|
#4
S Willow St
Toluca, IL 61369
|
1,175 sq. feet
|
1 baths 4 beds |
show details | |

|
#5
N Oxford Pl
Peoria, IL 61614
|
1,844 sq. feet
|
2 baths 3 beds |
show details | |

|
#6
N Safford Dr
Peoria, IL 61615
|
912 sq. feet
|
1 baths 2 beds |
show details | |

|
#7
W Detweiller Dr
Peoria, IL 61615
|
2,379 sq. feet
|
3 baths 3 beds |
show details | |

|
#8
N Brooklyn Pl
Dunlap, IL 61525
|
1,756 sq. feet
|
2 baths 2 beds |
show details | |

|
#9
Robert St
Henry, IL 61537
|
- sq. feet
|
- baths - beds |
$29,900
|
show details |

|
#10
N Mccabe Dr
Chillicothe, IL 61523
|
1,104 sq. feet
|
1 baths 3 beds |
show details |
| Photo | Address | Area | Beds / Baths | Price | Details |
|---|---|---|---|---|---|

|
#11
Illini Dr
Sparland, IL 61565
|
1,840 sq. feet
|
2 baths 3 beds |
show details | |

|
#12
N High St
Lacon, IL 61540
|
1,698 sq. feet
|
1 baths 3 beds |
show details | |

|
#13
N Waterton
Dunlap, IL 61525
|
2,174 sq. feet
|
2 baths 4 beds |
show details | |

|
#14
N Wilson St
Chillicothe, IL 61523
|
1,228 sq. feet
|
2 baths 3 beds |
show details | |

|
#15
W Wonderview Dr
Dunlap, IL 61525
|
1,288 sq. feet
|
1 baths 3 beds |
show details | |

|
#16
N Timber Ln
Peoria, IL 61615
|
2,350 sq. feet
|
2 baths 4 beds |
show details | |

|
#17
W Gail St
Chillicothe, IL 61523
|
1,724 sq. feet
|
1 baths 3 beds |
show details | |

|
#18
W Illinois St
East Peoria, IL 61611
|
- sq. feet
|
2 baths 3 beds |
show details | |

|
#19
W Detweiller Dr
Peoria, IL 61615
|
2,379 sq. feet
|
2 baths 3 beds |
show details | |

|
#20
W Coventry Ln
Peoria, IL 61614
|
2,100 sq. feet
|
2 baths 3 beds |
show details |
| Photo | Address | Area | Beds / Baths | Price | Details |
|---|---|---|---|---|---|

|
#21
N Finney St
Chillicothe, IL 61523
|
924 sq. feet
|
1 baths 2 beds |
show details | |

|
#22
W North St
Princeville, IL 61559
|
1,169 sq. feet
|
1 baths 3 beds |
show details | |

|
#23
Ashton Pkwy
Chillicothe, IL 61523
|
2,328 sq. feet
|
3 baths 3 beds |
show details | |

|
#24
Ashton Pkwy
Chillicothe, IL 61523
|
2,132 sq. feet
|
2 baths 3 beds |
show details | |

|
#25
S East Ln
Peoria, IL 61605
|
925 sq. feet
|
1 baths 2 beds |
show details | |

|
#26
W Buckingham Dr
Peoria, IL 61614
|
1,676 sq. feet
|
2 baths 4 beds |
show details | |

|
#27
E Richland Ave
Chillicothe, IL 61523
|
1,288 sq. feet
|
1 baths 3 beds |
show details | |

|
#28
N Princeville Jubilee Rd
Princeville, IL 61559
|
2,050 sq. feet
|
1 baths 4 beds |
show details | |

|
#29
W Pine St
Chillicothe, IL 61523
|
1,075 sq. feet
|
1 baths 2 beds |
show details | |

|
#30
W Elm St
Chillicothe, IL 61523
|
1,269 sq. feet
|
1 baths 3 beds |
show details |
| Photo | Address | Area | Beds / Baths | Price | Details |
|---|---|---|---|---|---|

|
#31
W Beech St
Chillicothe, IL 61523
|
2,824 sq. feet
|
1 baths 3 beds |
show details | |

|
#32
N Stanley Dr
Chillicothe, IL 61523
|
1,144 sq. feet
|
2 baths 3 beds |
show details | |

|
#33
E Lawrence Ave
Chillicothe, IL 61523
|
1,512 sq. feet
|
1 baths 3 beds |
show details | |

|
#34
Columbia Rd
Washburn, IL 61570
|
1,549 sq. feet
|
- baths - beds |
show details | |

|
#35
N Hunters Trce
Peoria, IL 61614
|
4,230 sq. feet
|
5 baths - beds |
show details | |

|
#36
Lawndale Ave
Lacon, IL 61540
|
1,308 sq. feet
|
- baths - beds |
show details | |

|
#37
W Aberdeen Rd
Peoria, IL 61615
|
- sq. feet
|
- baths - beds |
show details | |

|
#38
Lakepoint Dr
Metamora, IL 61548
|
- sq. feet
|
- baths - beds |
show details | |

|
#39
E Partridge St
Metamora, IL 61548
|
- sq. feet
|
- baths - beds |
show details | |

|
#40
Holland Rd Apt 1
Metamora, IL 61548
|
- sq. feet
|
- baths - beds |
show details |
| Photo | Address | Area | Beds / Baths | Price | Details |
|---|---|---|---|---|---|

|
#41
E Gardner Ln Apt 602
Peoria Heights, IL 61616
|
- sq. feet
|
- baths - beds |
show details | |

|
#42
W Alta Rd Apt 1806
Peoria, IL 61615
|
- sq. feet
|
- baths - beds |
show details | |

|
#43
E Gardner Ln Apt 620
Peoria Heights, IL 61616
|
- sq. feet
|
- baths - beds |
show details | |

|
#44
Roberts Rd
Magnolia, IL 61336
|
- sq. feet
|
- baths - beds |
show details | |

|
#45
E Gardner Ln Apt 417
Peoria Heights, IL 61616
|
- sq. feet
|
- baths - beds |
show details | |

|
#46
E Robin Ct
Peoria Heights, IL 61616
|
- sq. feet
|
- baths - beds |
show details | |

|
#47
E Robin Ct
Peoria Heights, IL 61616
|
- sq. feet
|
- baths - beds |
show details | |

|
#48
S Prairie St
Lacon, IL 61540
|
1,232 sq. feet
|
- baths - beds |
show details | |

|
#49
Schmitt Ln
Metamora, IL 61548
|
- sq. feet
|
- baths - beds |
show details | |

|
Check over 1 million property listings on Foreclosure.com!
|
browse all offers | |||

Latest news about housing in Hopewell, IL collected exclusively by city-data.com from local newspapers, TV, and radio stations

 | Wanting to move to Lacon, IL but work in Peoria (17 replies) |

Household type by relationship:
Households: 470- Male householders: 118 (28 living alone), Female householders: 76 (15 living alone)
143 spouses (142 opposite-sex spouses), 7 unmarried partners, (6 opposite-sex unmarried partners), 116 children (108 natural, 0 adopted, 7 stepchildren), 1 grandchildren, 0 brothers or sisters, 3 parents, 0 foster children, 0 other relatives, 0 non-relatives
Size of family households: 90 2-persons, 19 3-persons, 26 4-persons, 7 5-persons, 4 6-persons.
Size of nonfamily households: 46 1-person, 4 2-persons, 2 3-persons.
61 married couples with children.
20 single-parent households (17 men, 3 women).
97.6% of residents of Hopewell speak English at home.
0.9% of residents speak Spanish at home (75% speak English very well, 25% speak English well).
1.1% of residents speak other Indo-European language at home (100% speak English very well).
Foreign born population: 2 (0.4%)
(100.0% of them are naturalized citizens)
| Here: | 6.9 |
| State: | 6.4 |
| Here: | -650793650.1 |
| State: | 4.1 |

- Bedrooms in owner-occupied houses and condos in Hopewell, Illinois
- 2no bedroom
- 01 bedroom
- 302 bedrooms
- 1103 bedrooms
- 494 bedrooms
- 115+ bedrooms

- Cars and other vehicles available in Hopewell in owner-occupied houses/condos
- 7no vehicle
- 441 vehicle
- 802 vehicles
- 483 vehicles
- 144 vehicles
- 85+ vehicles

- Rooms in owner-occupied houses in Hopewell, Illinois
- 21 room
- 02 rooms
- 153 rooms
- 104 rooms
- 225 rooms
- 416 rooms
- 277 rooms
- 348 rooms
- 509+ rooms


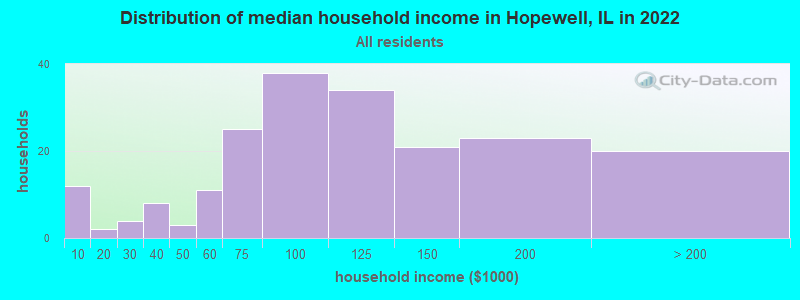
Hopewell, IL household income distribution

- 12Less than $10,000
- 2$10,000 to $19,999
- 4$20,000 to $29,999
- 8$30,000 to $39,999
- 3$40,000 to $49,999
- 11$50,000 to $59,999
- 25$60,000 to $74,999
- 38$75,000 to $99,999
- 34$100,000 to $124,999
- 21$125,000 to $149,999
- 23$150,000 to $199,999
- 20$200,000 or more
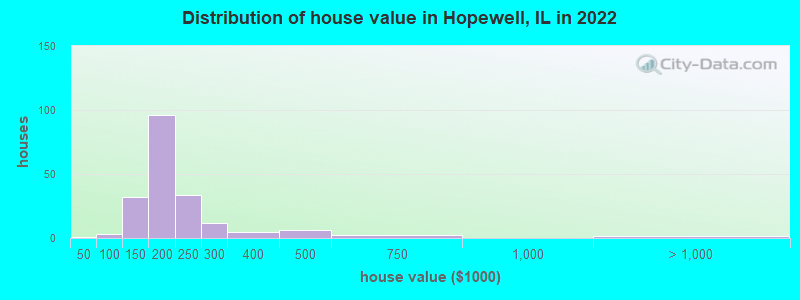
Home value of owner - occupied houses in 2022 in Hopewell, IL
-
- 0$15,000 to $19,999
- 0$50,000 to $59,999
- 2$80,000 to $89,999
- 10$100,000 to $124,999
- 21$125,000 to $149,999
- 54$150,000 to $174,999
- 41$175,000 to $199,999
- 33$200,000 to $249,999
- 11$250,000 to $299,999
- 4$300,000 to $399,999
- 6$400,000 to $499,999
- 2$500,000 to $749,999
- 1$1,000,000 to $1,499,999

Percentage of workers working in this county: 22.1%
Number of people working at home: 35 (14.6% of all workers)
Travel time to work (commute)
- Less than 5 minutes: 2
- 5 to 9 minutes: 19
- 10 to 14 minutes: 20
- 15 to 19 minutes: 20
- 20 to 24 minutes: 11
- 25 to 29 minutes: 22
- 30 to 34 minutes: 23
- 35 to 39 minutes: 20
- 40 to 44 minutes: 7
- 45 to 59 minutes: 44
- 60 to 89 minutes: 4
- 90 or more minutes: 6
Means of transportation to work:
- Drove a car alone: 192 (88.5%)
- Carpooled: 25 (11.5%)

- Unemployment by race in 2022
- Unemployment rate for White non-Hispanic residents
- 1.1%Males
- 2.0%Females

- Year of entry for the foreign-born population in Hopewell, Illinois
- 02010 or later
- 02000 to 2009
- 01990 to 1999
- 01980 to 1989
- 01970 to 1979
- 4Before 1970

First ancestries reported:
- German: 81 (40.2%)
- American: 23 (11.4%)
- Irish: 20 (9.9%)
- English: 16 (7.9%)
- European: 12 (6.0%)
- Italian: 12 (6.0%)
- Scottish: 7 (3.5%)
- Slovak: 4 (2.0%)
- Czech: 2 (1.0%)
- Scotch-Irish: 2 (1.0%)
- Swedish: 2 (1.0%)
- Norwegian: 1 (0.5%)
- Polish: 1 (0.5%)
- South African: 1 (0.5%)
Most common places of birth for foreign-born residents (%):
| Hopewell: | 100.0% (2) |
| Illinois: | 0.2% (2,988) |
Place of birth for U.S.-born residents:
- This state: 390
- Other state: 76
- Northeast: 7
- Midwest: 42
- South: 21
- West: 6
94.5% of Hopewell residents lived in the same house 1 years ago.
Out of people who lived in different houses, 28.6% lived in this county.
Out of people who lived in different counties, 75.0% lived in Illinois.
| Hopewell: | 94.5% |
| State average: | 88.3% |
Education attainment for males 25 years and older:
- No schooling: 0
- Nursery to 4th grade: 0
- 5th and 6th grade: 0
- 7th and 8th grade: 0
- 9th grade: 0
- 10th grade: 0
- 11th grade: 1
- 12th grade, no diploma: 3
- High school graduate (or equivalency): 54
- Less than 1 year of college: 35
- Some college more than 1 year, no degree: 19
- Associate degree: 21
- Bachelor's degree: 57
- Master's degree: 8
- Professional school degree: 4
- Doctorate degree: 0

Education attainment for females 25 years and older:
- No schooling: 2
- Nursery to 4th grade: 0
- 5th and 6th grade: 0
- 7th and 8th grade: 0
- 9th grade: 0
- 10th grade: 1
- 11th grade: 0
- 12th grade, no diploma: 1
- High school graduate (or equivalency): 45
- Less than 1 year of college: 4
- Some college more than 1 year, no degree: 17
- Associate degree: 36
- Bachelor's degree: 29
- Master's degree: 31
- Professional school degree: 0
- Doctorate degree: 0


Housing units in structures:
- One, detached: 198
- One, attached: 3
- Mobile homes: 2

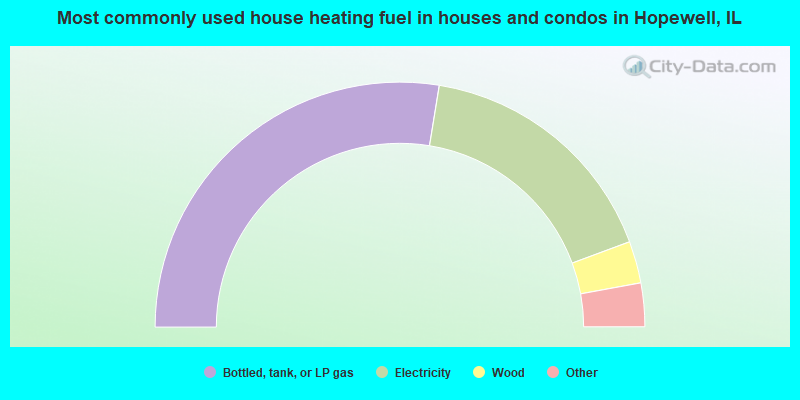
- 55.6%Bottled, tank, or LP gas
- 33.8%Electricity
- 5.6%Wood
- 2.5%Utility gas
- 2.0%Fuel oil, kerosene, etc.
- 0.5%Other fuel
Private vs. public school enrollment:
| Here: | 16.7% |
| Illinois: | 13.3% |
| Here: | 0.0% |
| Illinois: | 9.9% |
| Here: | 33.3% |
| Illinois: | 27.4% |


