Hoquiam, WA (Washington) Houses and Residents
| Hoquiam: | $195,709 |
| Washington: | $569,500 |
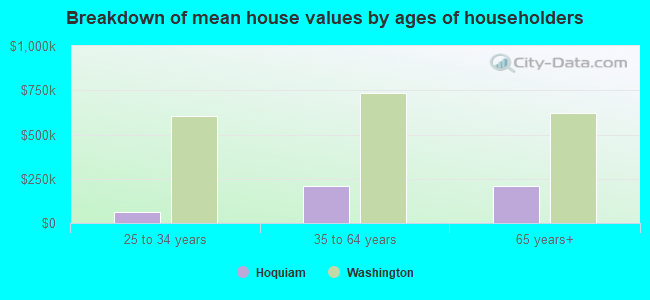
Mean price in 2022:
Detached houses: $239,712
Here: $239,712 State: $734,307 Townhouses or other attached units: $333,253
Here: $333,253 State: $657,697 Mobile homes: $64,508
Here: $64,508 State: $218,362
Total population: 8,389 (All urban)
Houses: 4,168 (3,820 occupied: 2,246 owner occupied, 1,684 renter occupied)
| % of renters here: | 43% |
| State: | 36% |
Housing density: 454 houses/condos per square mile
Median price asked for vacant for-sale houses and condos in 2022: $344,776.
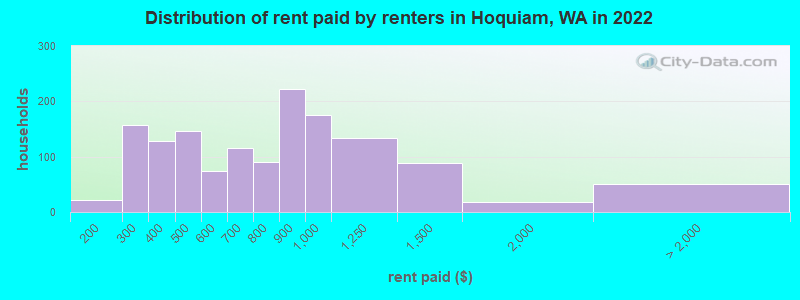
Median contract rent in 2022: $806 (lower quartile is $448, upper quartile is $1,006)
Median rent asked for vacant for-rent units in 2022: $1,585
Median gross rent in Hoquiam, WA in 2022: $942
Housing units in Hoquiam with a mortgage: 1,168 (43 second mortgage, 24 home equity loan, 6 both second mortgage and home equity loan)
Houses without a mortgage: 33
Median household income for houses/condos with a mortgage: $67,908
Median household income for apartments without a mortgage: $47,737
Median monthly housing costs: $869
Compare current foreclosures near Hoquiam, WA:
| Photo | Address | Area | Beds / Baths | Price | Details |
|---|---|---|---|---|---|

|
#1
Chenault Ave
Hoquiam, WA 98550
|
- sq. feet
|
1 baths 3 beds |
show details | |

|
#2
Pacific Ave
Hoquiam, WA 98550
|
1,300 sq. feet
|
1 baths 3 beds |
show details | |

|
#3
Cherry St
Hoquiam, WA 98550
|
- sq. feet
|
1 baths 2 beds |
show details | |

|
#4
Chenault Ave
Hoquiam, WA 98550
|
- sq. feet
|
1 baths 3 beds |
show details | |

|
#5
Monroe St
Hoquiam, WA 98550
|
- sq. feet
|
2 baths 3 beds |
show details | |

|
#6
Pacific Ave
Hoquiam, WA 98550
|
- sq. feet
|
1 baths 2 beds |
show details | |

|
#7
Emerson Ave
Hoquiam, WA 98550
|
- sq. feet
|
1 baths 2 beds |
show details | |

|
#8
Maple St
Hoquiam, WA 98550
|
1,646 sq. feet
|
- baths - beds |
show details | |

|
#9
30th St
Hoquiam, WA 98550
|
- sq. feet
|
1 baths 2 beds |
show details | |

|
#10
Aberdeen Ave
Hoquiam, WA 98550
|
- sq. feet
|
1 baths 2 beds |
show details |
| Photo | Address | Area | Beds / Baths | Price | Details |
|---|---|---|---|---|---|

|
#11
Beacon Hill Dr
Hoquiam, WA 98550
|
- sq. feet
|
- baths - beds |
show details | |

|
#12
Walker Rd
Hoquiam, WA 98550
|
- sq. feet
|
- baths - beds |
show details | |

|
#13
Perry Ave
Hoquiam, WA 98550
|
- sq. feet
|
- baths - beds |
show details | |

|
#14
E Hoquiam Rd
Hoquiam, WA 98550
|
- sq. feet
|
- baths - beds |
show details | |

|
#15
Bayview Ln
Hoquiam, WA 98550
|
- sq. feet
|
- baths - beds |
show details | |

|
#16
W 5th St
Aberdeen, WA 98520
|
2,010 sq. feet
|
2 baths 3 beds |
show details | |

|
#17
Pioneer Blvd
Aberdeen, WA 98520
|
1,732 sq. feet
|
1 baths 3 beds |
show details | |

|
#18
E Scott St
Aberdeen, WA 98520
|
1,356 sq. feet
|
2 baths 3 beds |
show details | |

|
#19
Bear Gulch Rd
Aberdeen, WA 98520
|
- sq. feet
|
1 baths 3 beds |
show details | |

|
#20
Frigate St NW
Ocean Shores, WA 98569
|
800 sq. feet
|
- baths 2 beds |
show details |
| Photo | Address | Area | Beds / Baths | Price | Details |
|---|---|---|---|---|---|

|
#21
N Michigan St
Aberdeen, WA 98520
|
1,416 sq. feet
|
- baths - beds |
show details | |

|
#22
W 2nd St
Aberdeen, WA 98520
|
- sq. feet
|
1 baths 2 beds |
show details | |

|
#23
N I St
Aberdeen, WA 98520
|
- sq. feet
|
2 baths 3 beds |
show details | |

|
#24
Miller Ct NE
Ocean Shores, WA 98569
|
- sq. feet
|
- baths - beds |
show details | |

|
#25
Ocosta Myrtle St
Aberdeen, WA 98520
|
- sq. feet
|
- baths - beds |
show details | |

|
#26
Camp Creek Rd
Montesano, WA 98563
|
- sq. feet
|
- baths - beds |
show details | |

|
#27
E Beacon Ave Apt 7
Montesano, WA 98563
|
- sq. feet
|
- baths - beds |
show details | |

|
#28
2nd St N
Westport, WA 98595
|
- sq. feet
|
- baths - beds |
show details | |

|
#29
N Bel Air Loop SW
Ocean Shores, WA 98569
|
- sq. feet
|
- baths - beds |
show details | |

|
#30
Fisher Ave NE
Ocean Shores, WA 98569
|
- sq. feet
|
- baths - beds |
show details |
| Photo | Address | Area | Beds / Baths | Price | Details |
|---|---|---|---|---|---|

|
#31
E Chance A La Mer NE
Ocean Shores, WA 98569
|
- sq. feet
|
- baths - beds |
show details | |

|
#32
E Pioneer Ave
Montesano, WA 98563
|
- sq. feet
|
- baths - beds |
show details | |

|
#33
Cygnus St SW
Ocean Shores, WA 98569
|
- sq. feet
|
- baths - beds |
show details | |

|
#34
Pacific Blvd NW
Ocean Shores, WA 98569
|
- sq. feet
|
- baths - beds |
show details | |

|
#35
Pt Brown Ave NE
Ocean Shores, WA 98569
|
- sq. feet
|
- baths - beds |
show details | |

|
#36
Mcclellan St
Aberdeen, WA 98520
|
- sq. feet
|
- baths - beds |
show details | |

|
#37
Rustemeyer Rd, Trlr 4
Aberdeen, WA 98520
|
- sq. feet
|
- baths - beds |
show details | |

|
#38
N C St
Aberdeen, WA 98520
|
- sq. feet
|
- baths - beds |
show details | |

|
#39
Basich Blvd
Aberdeen, WA 98520
|
- sq. feet
|
- baths - beds |
show details | |

|
#40
W Wishkah St
Aberdeen, WA 98520
|
- sq. feet
|
- baths - beds |
show details |
| Photo | Address | Area | Beds / Baths | Price | Details |
|---|---|---|---|---|---|

|
#41
E 4th St # 3
Aberdeen, WA 98520
|
- sq. feet
|
- baths - beds |
show details | |

|
#42
W 2nd St
Aberdeen, WA 98520
|
- sq. feet
|
- baths - beds |
show details | |

|
#43
E 1st St Apt 201
Aberdeen, WA 98520
|
- sq. feet
|
- baths - beds |
show details | |

|
#44
Tingstrom Ln, # 531
Grayland, WA 98547
|
- sq. feet
|
- baths - beds |
show details | |

|
#45
Constantine Way
Aberdeen, WA 98520
|
- sq. feet
|
- baths - beds |
show details | |

|
#46
S Mill St
Aberdeen, WA 98520
|
- sq. feet
|
- baths - beds |
show details | |

|
#47
W Broadway Ave
Montesano, WA 98563
|
- sq. feet
|
- baths - beds |
show details | |

|
#48
Wooding St
Aberdeen, WA 98520
|
- sq. feet
|
- baths - beds |
show details | |

|
#49
River Rd
Aberdeen, WA 98520
|
- sq. feet
|
- baths - beds |
show details | |

|
Check over 1 million property listings on Foreclosure.com!
|
browse all offers | |||

Latest news about housing in Hoquiam, WA collected exclusively by city-data.com from local newspapers, TV, and radio stations

 | What is the deal with the insane Bellingham housing market?? (141 replies) |
| Trying to find a home to rent (6 replies) |
| Are We In a Real Estate Bubble In Washington/Puget Sound Region? (27 replies) |
| Ocean Shores, WA Real Estate (66 replies) |
| Affordable housing in Western WA? (54 replies) |
| Any Home Rentals in Western Washington? (11 replies) |
Median year apartment built: 1933
Household type by relationship:
Households: 8,899- Male householders: 1,813 (768 living alone), Female householders: 2,001 (833 living alone)
1,305 spouses (1,303 opposite-sex spouses), 268 unmarried partners, (253 opposite-sex unmarried partners), 2,337 children (2,126 natural, 131 adopted, 79 stepchildren), 129 grandchildren, 29 brothers or sisters, 176 parents, 12 foster children, 235 other relatives, 490 non-relatives
- In group quarters: 100
Size of family households: 946 2-persons, 215 3-persons, 327 4-persons, 294 5-persons, 100 6-persons, 56 7-or-more-persons.
Size of nonfamily households: 1,796 1-person, 116 2-persons, 7 3-persons.
878 married couples with children.
553 single-parent households (143 men, 410 women).
94.0% of residents of Hoquiam speak English at home.
3.6% of residents speak Spanish at home (81% speak English very well, 8% speak English not well, 11% don't speak English at all).
0.5% of residents speak other Indo-European language at home (100% speak English very well).
1.3% of residents speak Asian or Pacific Island language at home (5% speak English very well, 47% speak English well, 11% speak English not well, 37% don't speak English at all).
0.1% of residents speak other language at home (100% speak English well).
Foreign born population: 326 (3.7%)
(16.0% of them are naturalized citizens)
| Here: | 6.5 |
| State: | 6.5 |
| Here: | 4.5 |
| State: | 3.9 |
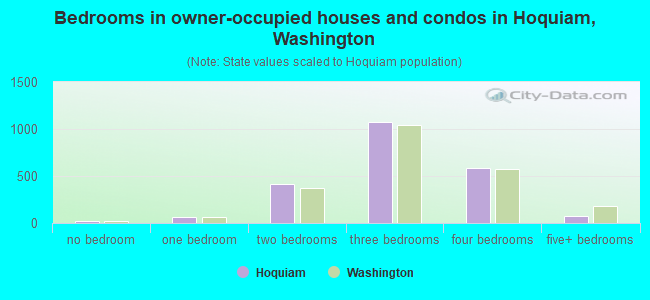
- Bedrooms in owner-occupied houses and condos in Hoquiam, Washington
- 23no bedroom
- 661 bedroom
- 4132 bedrooms
- 1,0763 bedrooms
- 5894 bedrooms
- 795+ bedrooms
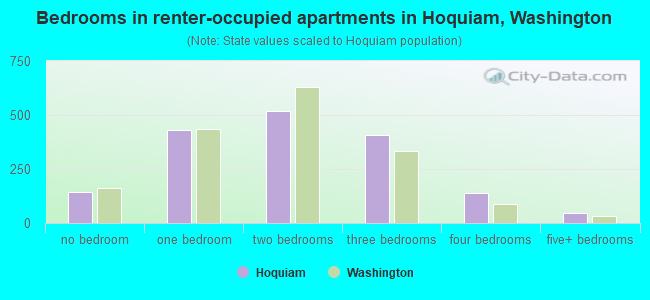
- Bedrooms in renter-occupied apartments in Hoquiam, Washington
- 142no bedroom
- 4321 bedroom
- 5172 bedrooms
- 4093 bedrooms
- 1374 bedrooms
- 475+ bedrooms
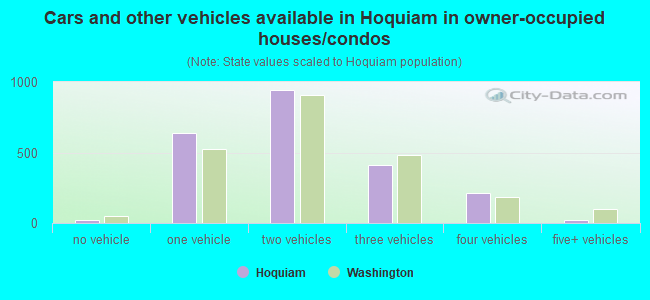
- Cars and other vehicles available in Hoquiam in owner-occupied houses/condos
- 22no vehicle
- 6361 vehicle
- 9452 vehicles
- 4093 vehicles
- 2134 vehicles
- 215+ vehicles
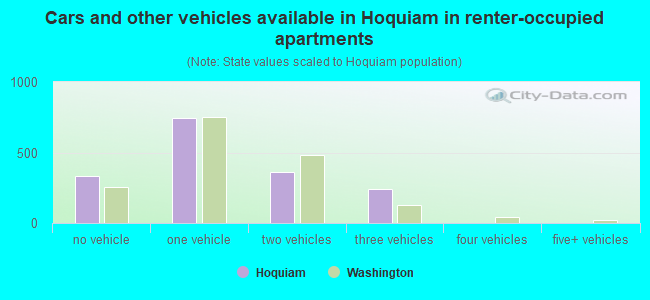
- Cars and other vehicles available in Hoquiam in renter-occupied apartments
- 334no vehicle
- 7461 vehicle
- 3612 vehicles
- 2443 vehicles
- 04 vehicles
- 05+ vehicles
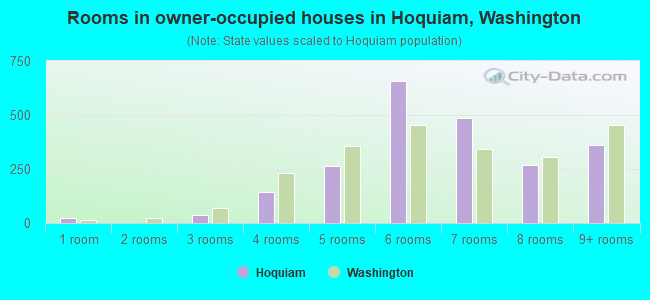
- Rooms in owner-occupied houses in Hoquiam, Washington
- 231 room
- 02 rooms
- 383 rooms
- 1434 rooms
- 2665 rooms
- 6596 rooms
- 4887 rooms
- 2698 rooms
- 3619+ rooms
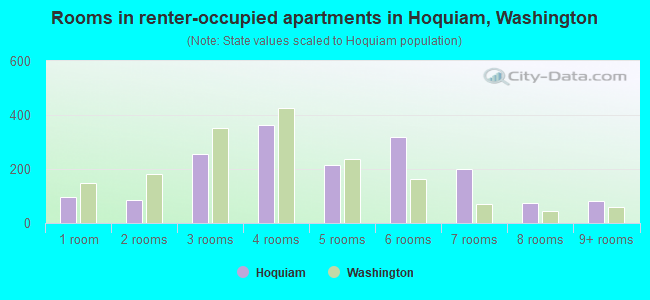
- Rooms in renter-occupied apartments in Hoquiam, Washington
- 971 room
- 842 rooms
- 2553 rooms
- 3624 rooms
- 2155 rooms
- 3176 rooms
- 2017 rooms
- 738 rooms
- 819+ rooms
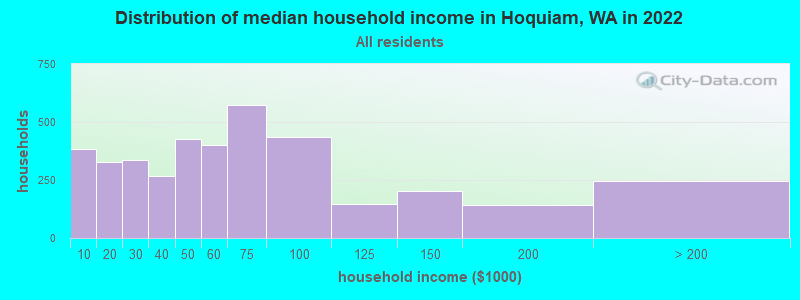
Hoquiam, WA household income distribution

- 385Less than $10,000
- 328$10,000 to $19,999
- 335$20,000 to $29,999
- 267$30,000 to $39,999
- 426$40,000 to $49,999
- 399$50,000 to $59,999
- 575$60,000 to $74,999
- 434$75,000 to $99,999
- 147$100,000 to $124,999
- 202$125,000 to $149,999
- 143$150,000 to $199,999
- 244$200,000 or more
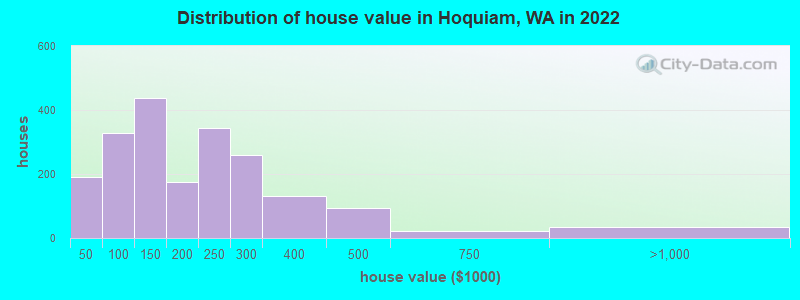
Home value of owner - occupied houses in 2022 in Hoquiam, WA
-
- 41Less than $10,000
- 25$10,000 to $14,999
- 11$15,000 to $19,999
- 26$20,000 to $24,999
- 39$25,000 to $29,999
- 20$35,000 to $39,999
- 26$40,000 to $49,999
- 31$50,000 to $59,999
- 40$60,000 to $69,999
- 85$70,000 to $79,999
- 94$80,000 to $89,999
- 49$90,000 to $99,999
- 141$100,000 to $124,999
- 295$125,000 to $149,999
- 98$150,000 to $174,999
- 76$175,000 to $199,999
- 342$200,000 to $249,999
- 260$250,000 to $299,999
- 131$300,000 to $399,999
- 95$400,000 to $499,999
- 21$500,000 to $749,999
- 35$750,000 to $999,999
Rent paid by renters in 2022 in Hoquiam, WA
-
- 21$150 to $199
- 72$200 to $249
- 84$250 to $299
- 102$300 to $349
- 26$350 to $399
- 132$400 to $449
- 13$450 to $499
- 11$500 to $549
- 63$550 to $599
- 50$600 to $649
- 64$650 to $699
- 54$700 to $749
- 35$750 to $799
- 221$800 to $899
- 175$900 to $999
- 133$1,000 to $1,249
- 88$1,250 to $1,499
- 17$1,500 to $1,999
- 21$2,500 to $2,999
- 29No cash rent
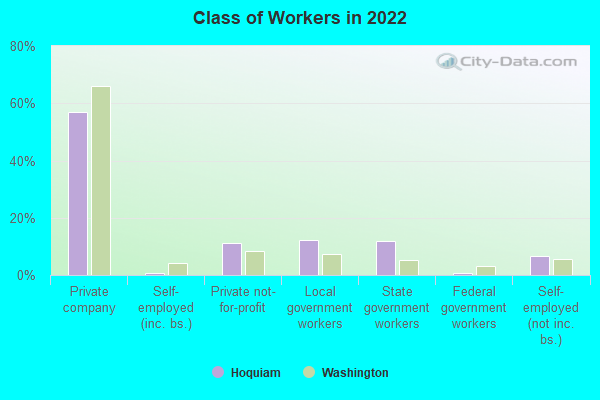
Percentage of workers working in this county: 90.1%
Number of people working at home: 127 (3.6% of all workers)
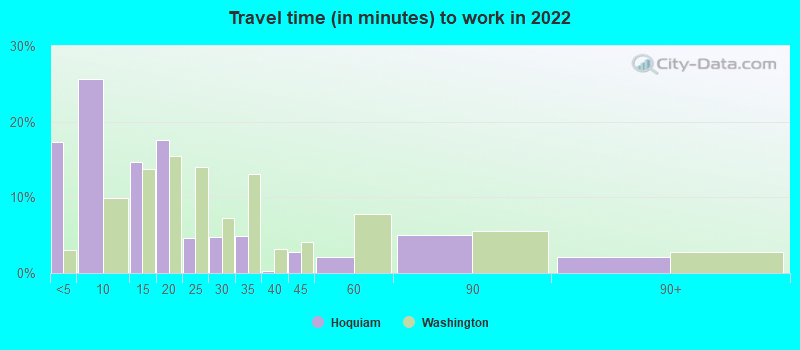
Travel time to work (commute)
- Less than 5 minutes: 518
- 5 to 9 minutes: 857
- 10 to 14 minutes: 459
- 15 to 19 minutes: 523
- 20 to 24 minutes: 187
- 25 to 29 minutes: 83
- 30 to 34 minutes: 180
- 35 to 39 minutes: 69
- 40 to 44 minutes: 69
- 45 to 59 minutes: 103
- 60 to 89 minutes: 302
- 90 or more minutes: 73
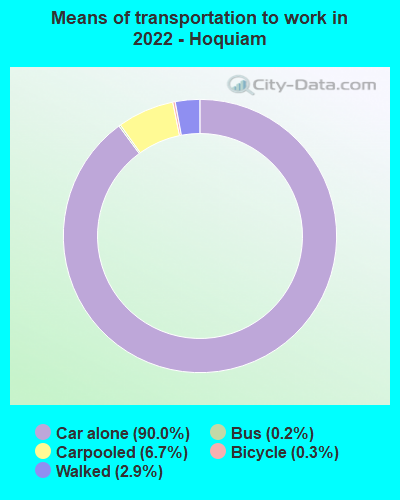
Means of transportation to work:
- Drove a car alone: 2,931 (83.3%)
- Carpooled: 224 (6.4%)
- Bus: 4 (0.1%)
- Bicycle: 8 (0.2%)
- Walked: 95 (2.7%)
- Worked at home: 127 (3.6%)
- Unemployment by race in 2022
- Unemployment rate for White non-Hispanic residents
- 8.1%Males
- 4.7%Females
- Unemployment rate for American Indian and Alaska Native residents
- 11.5%Males
- Unemployment rate for two or more race residents
- 26.5%Males
- 3.0%Females
- Unemployment rate for Hispanic or Latino residents
- 12.0%Males
- 83.0%Females
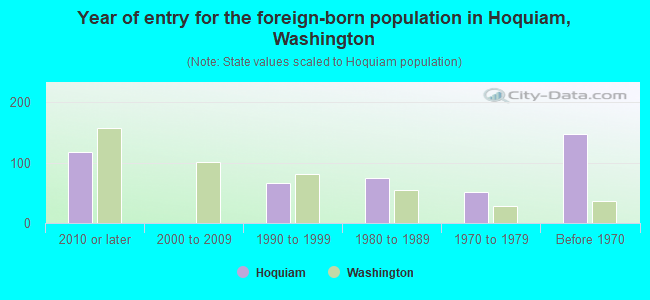
- Year of entry for the foreign-born population in Hoquiam, Washington
- 1182010 or later
- 02000 to 2009
- 661990 to 1999
- 751980 to 1989
- 521970 to 1979
- 147Before 1970
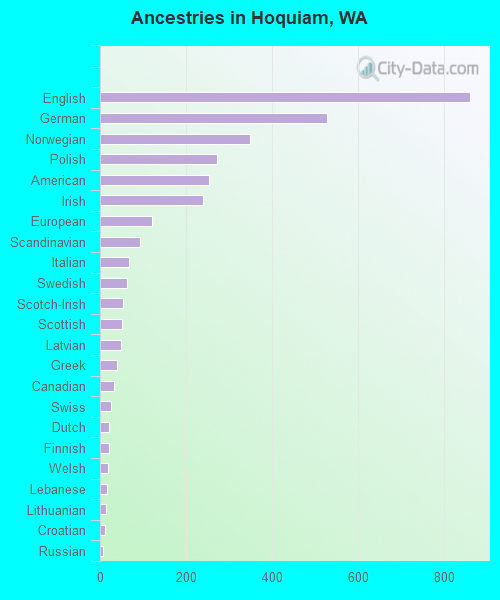
First ancestries reported:
- English: 862 (18.8%)
- German: 529 (11.6%)
- Norwegian: 349 (7.6%)
- Polish: 272 (5.9%)
- American: 254 (5.6%)
- Irish: 240 (5.2%)
- European: 120 (2.6%)
- Scandinavian: 93 (2.0%)
- Italian: 68 (1.5%)
- Swedish: 62 (1.4%)
- Scotch-Irish: 53 (1.2%)
- Scottish: 52 (1.1%)
- Latvian: 50 (1.1%)
- Greek: 40 (0.9%)
- Canadian: 33 (0.7%)
- Swiss: 26 (0.6%)
- Dutch: 21 (0.5%)
- Finnish: 21 (0.5%)
- Welsh: 19 (0.4%)
- Lebanese: 16 (0.3%)
- Lithuanian: 15 (0.3%)
- Croatian: 11 (0.2%)
- Russian: 8 (0.2%)
- French Canadian: 6 (0.1%)
- Eastern European: 5 (0.1%)
- British: 3 (0.07%)
Most common places of birth for foreign-born residents (%):
| Hoquiam: | 47.1% (130) |
| Washington: | 21.1% (241,655) |
| Hoquiam: | 43.8% (121) |
| Washington: | 7.4% (84,470) |
| Hoquiam: | 4.3% (12) |
| Washington: | 1.9% (21,540) |
| Hoquiam: | 2.2% (6) |
| Washington: | 6.3% (71,661) |
| Hoquiam: | 1.8% (5) |
| Washington: | 1.2% (13,855) |
Place of birth for U.S.-born residents:
- This state: 5,522
- Other state: 2,919
- Northeast: 376
- Midwest: 524
- South: 570
- West: 1,434
83.9% of Hoquiam residents lived in the same house 1 years ago.
Out of people who lived in different houses, 36.1% lived in this county.
Out of people who lived in different counties, 40.9% lived in Washington.
| Hoquiam: | 83.9% |
| State average: | 85.2% |
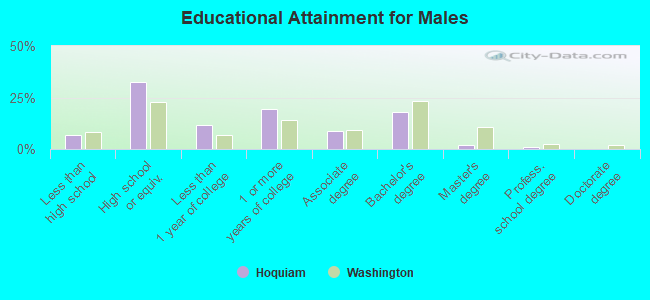
Education attainment for males 25 years and older:
- No schooling: 19
- Nursery to 4th grade: 0
- 5th and 6th grade: 0
- 7th and 8th grade: 22
- 9th grade: 23
- 10th grade: 51
- 11th grade: 42
- 12th grade, no diploma: 62
- High school graduate (or equivalency): 1,029
- Less than 1 year of college: 370
- Some college more than 1 year, no degree: 614
- Associate degree: 282
- Bachelor's degree: 573
- Master's degree: 63
- Professional school degree: 32
- Doctorate degree: 3
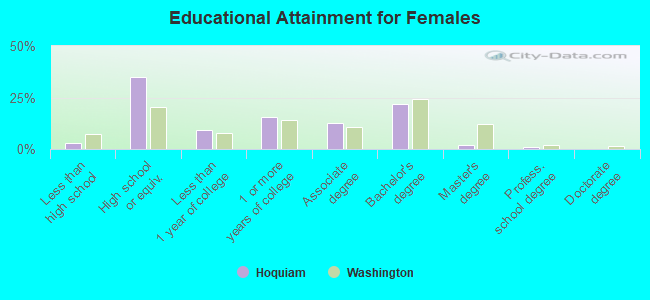
Education attainment for females 25 years and older:
- No schooling: 18
- Nursery to 4th grade: 0
- 5th and 6th grade: 10
- 7th and 8th grade: 10
- 9th grade: 0
- 10th grade: 28
- 11th grade: 11
- 12th grade, no diploma: 24
- High school graduate (or equivalency): 1,137
- Less than 1 year of college: 298
- Some college more than 1 year, no degree: 500
- Associate degree: 411
- Bachelor's degree: 708
- Master's degree: 68
- Professional school degree: 26
- Doctorate degree: 0
Housing units in structures:
- One, detached: 3,122
- One, attached: 97
- Two: 130
- 3 or 4: 148
- 5 to 9: 184
- 10 to 19: 48
- 20 to 49: 109
- 50 or more: 148
- Mobile homes: 177
Housing units lacking complete kitchen facilities in 2022: 5.4%
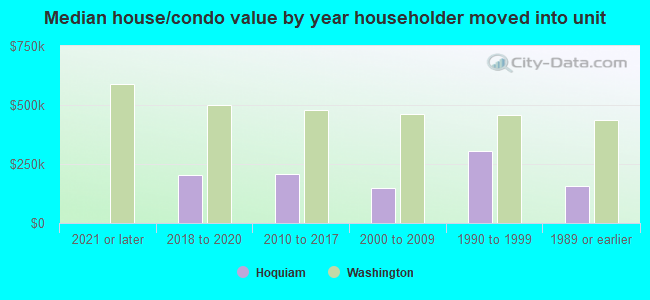
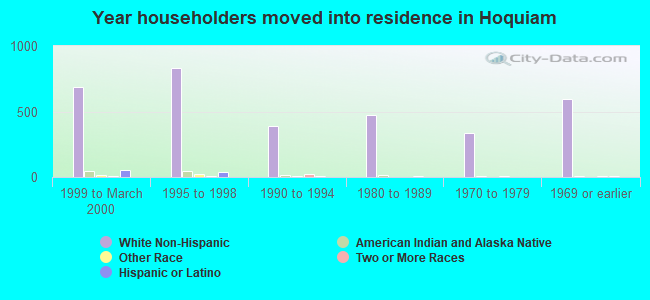
House/condo owner moved in on average 11 years ago
Renter moved in on average 3 years ago
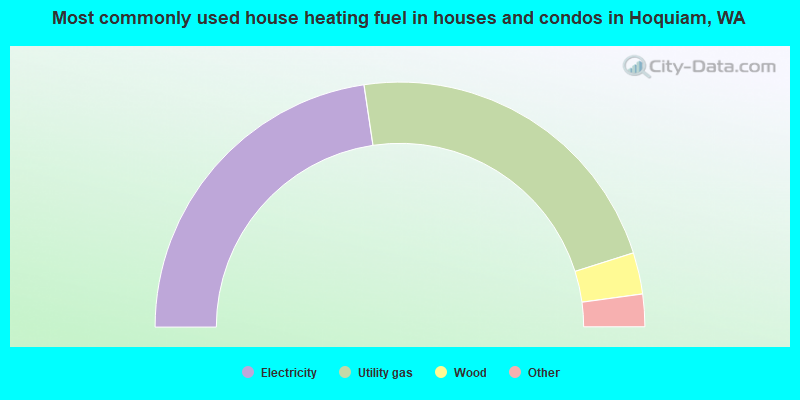
- 45.4%Electricity
- 45.0%Utility gas
- 5.5%Wood
- 2.3%Fuel oil, kerosene, etc.
- 0.8%Other fuel
- 0.7%No fuel used
- 0.3%Solar energy
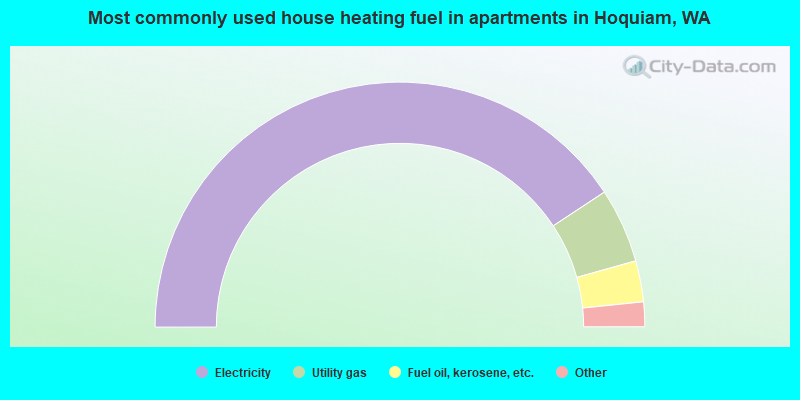
- 81.6%Electricity
- 9.9%Utility gas
- 5.4%Fuel oil, kerosene, etc.
- 1.9%Wood
- 1.2%No fuel used
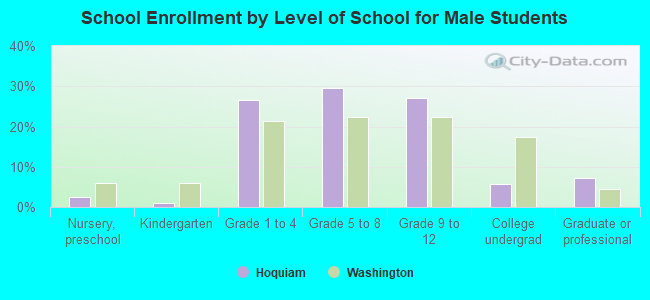
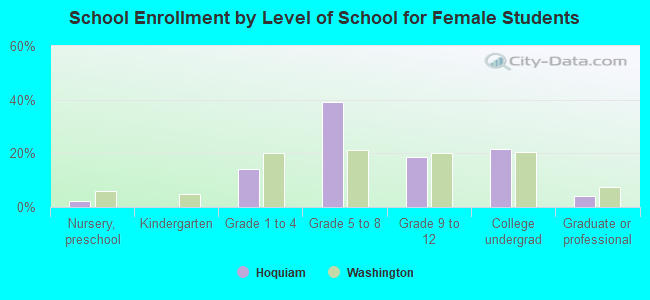
Private vs. public school enrollment:
| Here: | 5.3% |
| Washington: | 12.4% |
| Here: | 7.9% |
| Washington: | 9.2% |
| Here: | 16.2% |
| Washington: | 16.5% |