Houserville, PA (Pennsylvania) Houses and Residents
| Houserville: | $329,045 |
| Pennsylvania: | $245,500 |
Mean price in 2022:
Detached houses: $504,983
Here: $504,983 State: $317,202
Total population: 1,814 (Urban population: 1,715, Rural population: 0)
Houses: 881 (870 occupied: 715 owner occupied, 176 renter occupied)
| % of renters here: | 20% |
| State: | 31% |
Housing density: 806 houses/condos per square mile
Median price asked for vacant for-sale houses and condos in 2022 in this county: $312,647.
Median contract rent in 2022: $1,450 (lower quartile is $1,141, upper quartile is $1,808)
Median rent asked for vacant for-rent units in 2022: $2,926
Median gross rent in Houserville, PA in 2022: $1,686
Housing units in Houserville with a mortgage: 539 (75 second mortgage, 0 home equity loan, 72 both second mortgage and home equity loan)
Houses without a mortgage: 141
Median household income for houses/condos with a mortgage: $118,251
Median household income for apartments without a mortgage: $118,359
Median monthly housing costs: $1,581
Compare current foreclosures near Houserville, PA:
| Photo | Address | Area | Beds / Baths | Price | Details |
|---|---|---|---|---|---|

|
#1
Walters Haven Ln
Spring Mills, PA 16875
|
5,030 sq. feet
|
1 baths 4 beds |
$435,000
|
show details |

|
#2
Walker Xing
Bellefonte, PA 16823
|
1,232 sq. feet
|
2 baths 3 beds |
show details | |

|
#3
E Olive St
Snow Shoe, PA 16874
|
1,068 sq. feet
|
1 baths 3 beds |
show details | |

|
#4
W Whitehall Rd
Pennsylvania Furnace, PA 16865
|
950 sq. feet
|
2 baths 3 beds |
show details | |

|
#5
Woodpecker
Port Matilda, PA 16870
|
2,544 sq. feet
|
2 baths 4 beds |
show details | |

|
#6
Anthony Dr
Pennsylvania Furnace, PA 16865
|
1,816 sq. feet
|
2 baths 3 beds |
show details | |

|
#7
Cedar Ln
State College, PA 16801
|
2,456 sq. feet
|
2 baths 3 beds |
show details | |

|
#8
Skytop Mountain Rd
Port Matilda, PA 16870
|
2,880 sq. feet
|
3 baths 5 beds |
show details | |

|
#9
Stover Rd
Bellefonte, PA 16823
|
1,436 sq. feet
|
1 baths 3 beds |
show details | |

|
#10
Sawmill Rd
Port Matilda, PA 16870
|
1,392 sq. feet
|
1 baths 3 beds |
show details |
| Photo | Address | Area | Beds / Baths | Price | Details |
|---|---|---|---|---|---|

|
#11
Buchenhorst Rd
State College, PA 16801
|
1,492 sq. feet
|
1 baths 3 beds |
show details | |

|
#12
W Whitehall Rd
Pennsylvania Furnace, PA 16865
|
950 sq. feet
|
2 baths 3 beds |
show details | |

|
#13
Fairview St
Bellefonte, PA 16823
|
1,327 sq. feet
|
1 baths 4 beds |
show details | |

|
#14
Donna Cir
Port Matilda, PA 16870
|
1,828 sq. feet
|
2 baths 3 beds |
show details | |

|
#15
Nittany Valley Dr
Bellefonte, PA 16823
|
988 sq. feet
|
1 baths 2 beds |
show details | |

|
#16
Yarnell Rd
Bellefonte, PA 16823
|
1,064 sq. feet
|
1 baths 3 beds |
show details | |

|
#17
Old 220 Rd
Howard, PA 16841
|
4,999 sq. feet
|
3 baths 6 beds |
show details | |

|
#18
Hogan Ln
Howard, PA 16841
|
1,382 sq. feet
|
1 baths 3 beds |
show details | |

|
#19
Scenic St
Bellefonte, PA 16823
|
1,232 sq. feet
|
1 baths 2 beds |
show details | |

|
#20
Cottontail Ln
Centre Hall, PA 16828
|
960 sq. feet
|
1 baths 3 beds |
show details |
| Photo | Address | Area | Beds / Baths | Price | Details |
|---|---|---|---|---|---|

|
#21
Gorton Rd
Moshannon, PA 16859
|
1,632 sq. feet
|
1 baths 2 beds |
show details | |

|
#22
West Dr
Boalsburg, PA 16827
|
1,416 sq. feet
|
1 baths 3 beds |
show details | |

|
#23
Raymonds Ln
Bellefonte, PA 16823
|
2,943 sq. feet
|
3 baths 4 beds |
show details | |

|
#24
Bayberry Dr
State College, PA 16801
|
1,723 sq. feet
|
2 baths 4 beds |
show details | |

|
#25
N Allen St
State College, PA 16803
|
1,406 sq. feet
|
1 baths 2 beds |
show details | |

|
#26
Devonshire Dr
State College, PA 16803
|
3,108 sq. feet
|
3 baths 5 beds |
show details | |

|
#27
N Allen St
State College, PA 16803
|
1,484 sq. feet
|
1 baths 2 beds |
show details | |

|
#28
Chaumont Ave
State College, PA 16801
|
2,795 sq. feet
|
2 baths 4 beds |
show details | |

|
#29
Brittany Dr
State College, PA 16803
|
2,122 sq. feet
|
3 baths 6 beds |
show details | |

|
#30
Brittany Dr
State College, PA 16803
|
2,122 sq. feet
|
3 baths 6 beds |
show details |
| Photo | Address | Area | Beds / Baths | Price | Details |
|---|---|---|---|---|---|

|
#31
Valley View Rd
Bellefonte, PA 16823
|
2,700 sq. feet
|
1 baths 3 beds |
show details | |

|
#32
Danielle Dr
Bellefonte, PA 16823
|
1,028 sq. feet
|
1 baths 3 beds |
show details | |

|
#33
E Main St
Belleville, PA 17004
|
- sq. feet
|
- baths - beds |
show details | |

|
#34
E Logan Street Ext
Reedsville, PA 17084
|
1,008 sq. feet
|
- baths - beds |
show details | |

|
#35
Maclay St
Milroy, PA 17063
|
1,448 sq. feet
|
- baths - beds |
show details | |

|
#36
Colonel Ln
Milroy, PA 17063
|
- sq. feet
|
- baths - beds |
show details | |

|
#37
E Back Mountain Rd
Milroy, PA 17063
|
- sq. feet
|
- baths - beds |
show details | |

|
#38
Upper Stone Mountain Rd
Belleville, PA 17004
|
1,528 sq. feet
|
- baths - beds |
show details | |

|
#39
Amblewood Way
State College, PA 16803
|
- sq. feet
|
- baths - beds |
show details | |

|
#40
Ferne Ridge Ln
Spring Mills, PA 16875
|
- sq. feet
|
- baths - beds |
show details |
| Photo | Address | Area | Beds / Baths | Price | Details |
|---|---|---|---|---|---|

|
#41
S High St # 2
Port Matilda, PA 16870
|
- sq. feet
|
- baths - beds |
show details | |

|
#42
Ash St
Bellefonte, PA 16823
|
980 sq. feet
|
- baths - beds |
show details | |

|
#43
Old Gatesburg Rd
State College, PA 16803
|
- sq. feet
|
- baths - beds |
show details | |

|
#44
S Buckhout St
State College, PA 16801
|
- sq. feet
|
- baths - beds |
show details | |

|
#45
Stratford Ct
State College, PA 16801
|
- sq. feet
|
- baths - beds |
show details | |

|
#46
Jacks Mill Dr # 8
Boalsburg, PA 16827
|
- sq. feet
|
- baths - beds |
show details | |

|
#47
S Eagle Valley Rd
Julian, PA 16844
|
- sq. feet
|
- baths - beds |
show details | |

|
#48
Jacksonville Rd
Bellefonte, PA 16823
|
- sq. feet
|
- baths - beds |
show details | |

|
#49
E Main St
Boalsburg, PA 16827
|
- sq. feet
|
- baths - beds |
show details | |

|
Check over 1 million property listings on Foreclosure.com!
|
browse all offers | |||

Latest news about housing in Houserville, PA collected exclusively by city-data.com from local newspapers, TV, and radio stations

 | Looking for House (not apartment!) near Princeton and/or Penn State (6 replies) |
| State College and surrounding towns (16 replies) |
| State College: Looking for Family Housing (1 reply) |
| state college vs pittsburgh (33 replies) |
| Best Places to Live Near Penn State, State College (27 replies) |
| Crime increase in State College? (23 replies) |

Median year apartment built: 1967
Household type by relationship:
Households: 2,092- Male householders: 557 (42 living alone), Female householders: 301 (61 living alone)
580 spouses (580 opposite-sex spouses), 64 unmarried partners, (64 opposite-sex unmarried partners), 561 children (509 natural, 8 adopted, 42 stepchildren), 10 grandchildren, 0 brothers or sisters, 0 parents, 0 foster children, 0 other relatives, 16 non-relatives
Size of family households: 366 2-persons, 251 3-persons, 79 4-persons, 16 5-persons, 5 6-persons, 3 7-or-more-persons.
Size of nonfamily households: 102 1-person, 76 2-persons.
277 married couples with children.
108 single-parent households (55 men, 53 women).
95.3% of residents of Houserville speak English at home.
1.9% of residents speak other Indo-European language at home (100% speak English very well).
2.3% of residents speak Asian or Pacific Island language at home (100% speak English well).
Foreign born population: 73 (3.5%)
(78.1% of them are naturalized citizens)
| Here: | 7.8 |
| State: | 6.8 |
| Here: | 5.8 |
| State: | 4.3 |

- Bedrooms in owner-occupied houses and condos in Houserville, Pennsylvania
- 0no bedroom
- 01 bedroom
- 712 bedrooms
- 3023 bedrooms
- 2144 bedrooms
- 1305+ bedrooms

- Bedrooms in renter-occupied apartments in Houserville, Pennsylvania
- 8no bedroom
- 01 bedroom
- 542 bedrooms
- 1013 bedrooms
- 134 bedrooms
- 05+ bedrooms

- Cars and other vehicles available in Houserville in owner-occupied houses/condos
- 0no vehicle
- 1561 vehicle
- 4572 vehicles
- 1033 vehicles
- 04 vehicles
- 05+ vehicles

- Cars and other vehicles available in Houserville in renter-occupied apartments
- 0no vehicle
- 531 vehicle
- 872 vehicles
- 363 vehicles
- 04 vehicles
- 05+ vehicles

- Rooms in owner-occupied houses in Houserville, Pennsylvania
- 01 room
- 02 rooms
- 03 rooms
- 54 rooms
- 445 rooms
- 1046 rooms
- 1457 rooms
- 1918 rooms
- 2279+ rooms

- Rooms in renter-occupied apartments in Houserville, Pennsylvania
- 01 room
- 82 rooms
- 03 rooms
- 454 rooms
- 95 rooms
- 736 rooms
- 67 rooms
- 228 rooms
- 139+ rooms


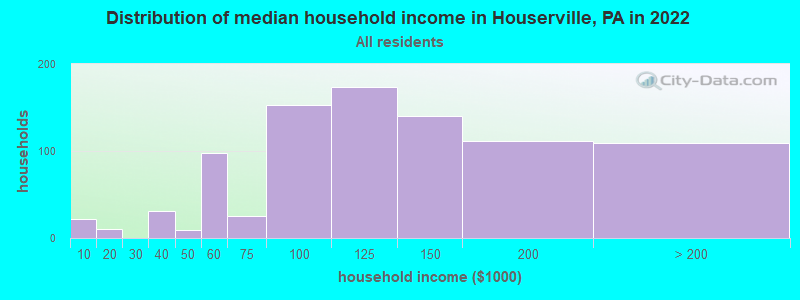
Houserville, PA household income distribution

- 22Less than $10,000
- 10$10,000 to $19,999
- 31$30,000 to $39,999
- 9$40,000 to $49,999
- 98$50,000 to $59,999
- 25$60,000 to $74,999
- 153$75,000 to $99,999
- 173$100,000 to $124,999
- 140$125,000 to $149,999
- 112$150,000 to $199,999
- 109$200,000 or more
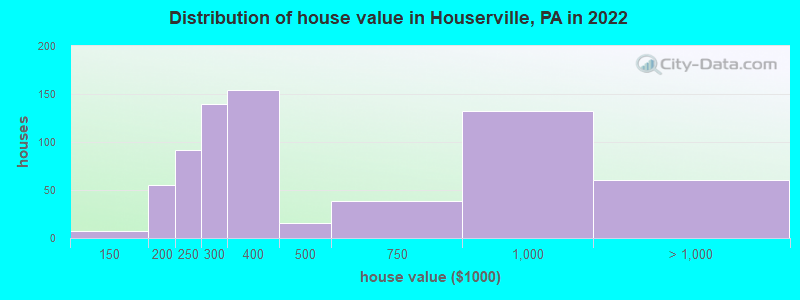
Home value of owner - occupied houses in 2022 in Houserville, PA
-
- 3$100,000 to $124,999
- 3$125,000 to $149,999
- 20$150,000 to $174,999
- 33$175,000 to $199,999
- 92$200,000 to $249,999
- 139$250,000 to $299,999
- 154$300,000 to $399,999
- 16$400,000 to $499,999
- 39$500,000 to $749,999
- 132$750,000 to $999,999
- 52$1,000,000 to $1,499,999
- 7$2,000,000 or more
Rent paid by renters in 2022 in Houserville, PA
-
- 6$400 to $449
- 11$700 to $749
- 14$900 to $999
- 10$1,000 to $1,249
- 43$1,250 to $1,499
- 108$1,500 to $1,999
- 6No cash rent


Percentage of workers working in this county: 99.5%
Number of people working at home: 145 (12.0% of all workers)
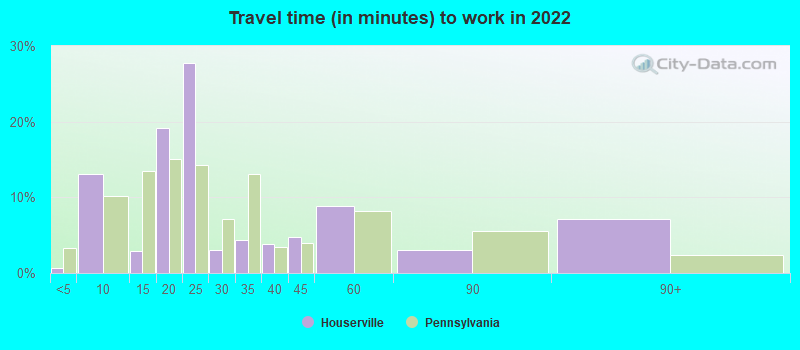
Travel time to work (commute)
- Less than 5 minutes: 7
- 5 to 9 minutes: 215
- 10 to 14 minutes: 377
- 15 to 19 minutes: 219
- 20 to 24 minutes: 157
- 25 to 29 minutes: 20
- 30 to 34 minutes: 11
- 35 to 39 minutes: 3
- 40 to 44 minutes: 17
- 45 to 59 minutes: 12
- 60 to 89 minutes: 5
- 90 or more minutes: 35
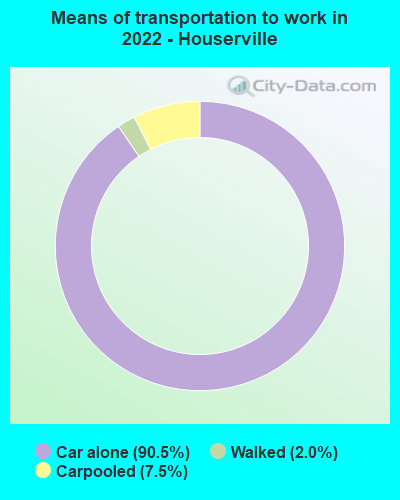
Means of transportation to work:
- Drove a car alone: 324 (67.1%)
- Carpooled: 24 (5.0%)
- Walked: 7 (1.4%)
- Worked at home: 145 (30.0%)

- Unemployment by race in 2022
- Unemployment rate for White non-Hispanic residents
- 5.2%Females

- Year of entry for the foreign-born population in Houserville, Pennsylvania
- 162010 or later
- 252000 to 2009
- 21990 to 1999
- 01980 to 1989
- 51970 to 1979
- 20Before 1970
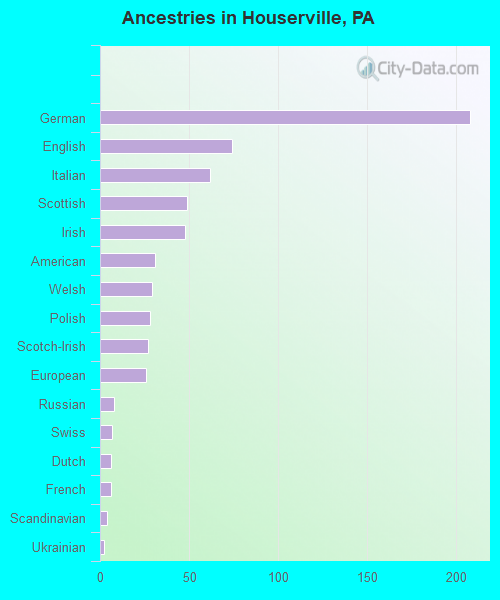
First ancestries reported:
- German: 208 (29.0%)
- English: 74 (10.3%)
- Italian: 62 (8.7%)
- Scottish: 49 (6.8%)
- Irish: 48 (6.7%)
- American: 31 (4.3%)
- Welsh: 29 (4.0%)
- Polish: 28 (3.9%)
- Scotch-Irish: 27 (3.8%)
- European: 26 (3.6%)
- Russian: 8 (1.1%)
- Swiss: 7 (1.0%)
- Dutch: 6 (0.8%)
- French: 6 (0.8%)
- Scandinavian: 4 (0.6%)
- Ukrainian: 2 (0.3%)
Most common places of birth for foreign-born residents (%):
| Houserville: | 41.7% (30) |
| Pennsylvania: | 0.9% (8,772) |
| Houserville: | 30.6% (22) |
| Pennsylvania: | 2.2% (21,039) |
| Houserville: | 18.1% (13) |
| Pennsylvania: | 7.2% (67,704) |
| Houserville: | 9.7% (7) |
| Pennsylvania: | 1.8% (17,032) |
| Houserville: | 6.9% (5) |
| Pennsylvania: | 0.2% (2,004) |
Place of birth for U.S.-born residents:
- This state: 1,305
- Other state: 712
- Northeast: 238
- Midwest: 120
- South: 209
- West: 142
80.1% of Houserville residents lived in the same house 1 years ago.
Out of people who lived in different houses, 33.8% lived in this county.
Out of people who lived in different counties, 23.6% lived in Pennsylvania.
| Houserville: | 80.1% |
| State average: | 89.3% |
Education attainment for males 25 years and older:
- No schooling: 0
- Nursery to 4th grade: 0
- 5th and 6th grade: 0
- 7th and 8th grade: 0
- 9th grade: 0
- 10th grade: 0
- 11th grade: 0
- 12th grade, no diploma: 0
- High school graduate (or equivalency): 91
- Less than 1 year of college: 27
- Some college more than 1 year, no degree: 76
- Associate degree: 7
- Bachelor's degree: 243
- Master's degree: 132
- Professional school degree: 22
- Doctorate degree: 173

Education attainment for females 25 years and older:
- No schooling: 0
- Nursery to 4th grade: 0
- 5th and 6th grade: 0
- 7th and 8th grade: 0
- 9th grade: 0
- 10th grade: 0
- 11th grade: 5
- 12th grade, no diploma: 35
- High school graduate (or equivalency): 97
- Less than 1 year of college: 21
- Some college more than 1 year, no degree: 51
- Associate degree: 30
- Bachelor's degree: 167
- Master's degree: 224
- Professional school degree: 22
- Doctorate degree: 110


Housing units in structures:
- One, detached: 852
- 3 or 4: 28
House/condo owner moved in on average 9 years ago
Renter moved in on average 2 years ago

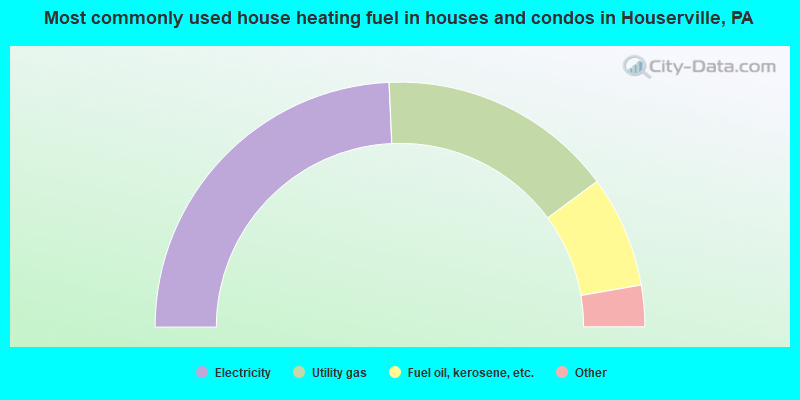
- 48.7%Electricity
- 31.2%Utility gas
- 14.8%Fuel oil, kerosene, etc.
- 2.8%Bottled, tank, or LP gas
- 1.3%Wood
- 1.3%Other fuel
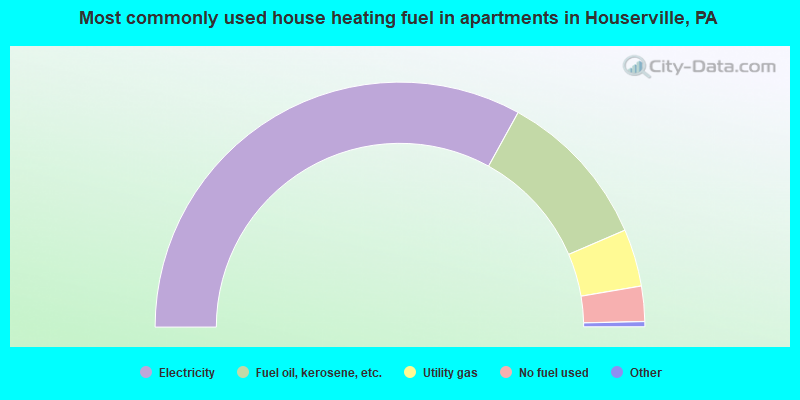
- 66.5%Electricity
- 21.2%Fuel oil, kerosene, etc.
- 7.6%Utility gas
- 4.7%No fuel used
Private vs. public school enrollment:
| Here: | 3.0% |
| Pennsylvania: | 15.7% |
| Here: | 4.2% |
| Pennsylvania: | 13.4% |
| Here: | 31.3% |
| Pennsylvania: | 39.8% |


