Hudson, CO (Colorado) Houses and Residents
| Hudson: | $335,934 |
| Colorado: | $531,100 |
Mean price in 2022:
Detached houses: $419,914
Here: $419,914 State: $676,667 Mobile homes: $67,183
Here: $67,183 State: $115,510
Total population: 2,569 (Urban population: 0, Rural population: 1,569 (all nonfarm))
Houses: 778 (754 occupied: 547 owner occupied, 206 renter occupied)
| % of renters here: | 27% |
| State: | 34% |
Housing density: 335 houses/condos per square mile
Median price asked for vacant for-sale houses and condos in 2022 in this county: $385,671.
Median contract rent in 2022: $931 (lower quartile is $695, upper quartile is $1,218)
Median gross rent in Hudson, CO in 2022: $1,315
Housing units in Hudson with a mortgage: 339 (11 second mortgage, 0 home equity loan, 7 both second mortgage and home equity loan)
Houses without a mortgage: 0
Median household income for houses/condos with a mortgage: $82,080
Median monthly housing costs: $1,194
Compare current foreclosures near Hudson, CO:
| Photo | Address | Area | Beds / Baths | Price | Details |
|---|---|---|---|---|---|

|
#1
Timber Cove St
Hudson, CO 80642
|
2,491 sq. feet
|
2 baths 4 beds |
show details | |

|
#2
County Road 8
Hudson, CO 80642
|
1,344 sq. feet
|
1 baths 3 beds |
show details | |

|
#3
Rayburn St
Hudson, CO 80642
|
2,113 sq. feet
|
2 baths 4 beds |
show details | |

|
#4
Birch St
Hudson, CO 80642
|
- sq. feet
|
- baths - beds |
show details | |

|
#5
Ash St
Hudson, CO 80642
|
- sq. feet
|
- baths - beds |
show details | |

|
#6
Ash Ct
Fort Lupton, CO 80621
|
996 sq. feet
|
1 baths 3 beds |
show details | |

|
#7
Leroux Street
Fort Lupton, CO 80621
|
1,911 sq. feet
|
2 baths 4 beds |
show details | |

|
#8
Reynolds St Unit 11a
Fort Lupton, CO 80621
|
1,419 sq. feet
|
3 baths 3 beds |
show details | |

|
#9
Hayloft Way
Brighton, CO 80601
|
1,620 sq. feet
|
2 baths 3 beds |
show details | |

|
#10
Pintail Ave
Brighton, CO 80601
|
1,400 sq. feet
|
2 baths 3 beds |
show details |
| Photo | Address | Area | Beds / Baths | Price | Details |
|---|---|---|---|---|---|

|
#11
Straw Ct
Brighton, CO 80601
|
1,325 sq. feet
|
2 baths 2 beds |
show details | |

|
#12
Farmhouse Way
Brighton, CO 80601
|
3,015 sq. feet
|
3 baths 3 beds |
show details | |

|
#13
Mckinley Ave
Fort Lupton, CO 80621
|
672 sq. feet
|
1 baths 2 beds |
show details | |

|
#14
Mesa St
Brighton, CO 80601
|
2,373 sq. feet
|
3 baths 4 beds |
show details | |

|
#15
Mather St
Brighton, CO 80601
|
910 sq. feet
|
1 baths 2 beds |
show details | |

|
#16
Comanche Creek Dr
Brighton, CO 80601
|
1,879 sq. feet
|
3 baths 4 beds |
show details | |

|
#17
S 3rd Ave
Brighton, CO 80601
|
1,306 sq. feet
|
2 baths 3 beds |
show details | |

|
#18
S 2nd Ave
Brighton, CO 80601
|
783 sq. feet
|
1 baths 2 beds |
show details | |

|
#19
Mt Bierstadt St
Brighton, CO 80601
|
2,095 sq. feet
|
2 baths 2 beds |
show details | |

|
#20
Richfield Cir
Commerce City, CO 80022
|
1,841 sq. feet
|
2 baths 3 beds |
show details |
| Photo | Address | Area | Beds / Baths | Price | Details |
|---|---|---|---|---|---|

|
#21
Grand Ave
Platteville, CO 80651
|
916 sq. feet
|
1 baths 2 beds |
show details | |

|
#22
Hematite Ln
Brighton, CO 80603
|
1,316 sq. feet
|
2 baths 3 beds |
show details | |

|
#23
E 113th Ave
Commerce City, CO 80022
|
1,820 sq. feet
|
2 baths 2 beds |
show details | |

|
#24
Sedalia St
Commerce City, CO 80022
|
2,138 sq. feet
|
2 baths 3 beds |
show details | |

|
#25
Morning Glory Rd
Henderson, CO 80640
|
1,987 sq. feet
|
2 baths 3 beds |
show details | |

|
#26
Sunflower Grn
Frederick, CO 80530
|
1,200 sq. feet
|
2 baths 3 beds |
show details | |

|
#27
Quintero St
Commerce City, CO 80022
|
2,633 sq. feet
|
2 baths 3 beds |
show details | |

|
#28
Front St
Roggen, CO 80652
|
1,215 sq. feet
|
1 baths 3 beds |
show details | |

|
#29
Tipple Pkwy
Frederick, CO 80530
|
1,095 sq. feet
|
1 baths 2 beds |
show details | |

|
#30
Chambers Dr
Commerce City, CO 80022
|
2,026 sq. feet
|
2 baths 4 beds |
show details |
| Photo | Address | Area | Beds / Baths | Price | Details |
|---|---|---|---|---|---|

|
#31
E 108th Way
Commerce City, CO 80022
|
2,282 sq. feet
|
2 baths 3 beds |
show details | |

|
#32
E 98th Pl
Commerce City, CO 80022
|
2,771 sq. feet
|
2 baths 4 beds |
show details | |

|
#33
Oak Hill Way Unit C
Henderson, CO 80640
|
1,382 sq. feet
|
2 baths 3 beds |
show details | |

|
#34
E 96th Way Unit 30b
Commerce City, CO 80022
|
1,216 sq. feet
|
2 baths 2 beds |
show details | |

|
#35
Jamaica St
Henderson, CO 80640
|
1,533 sq. feet
|
3 baths 3 beds |
show details | |

|
#36
Apache Plume St
Brighton, CO 80601
|
2,058 sq. feet
|
2 baths 4 beds |
show details | |

|
#37
Cedar Ave
Brighton, CO 80601
|
1,608 sq. feet
|
2 baths 3 beds |
show details | |

|
#38
Jasmine St
Brighton, CO 80602
|
2,422 sq. feet
|
3 baths 3 beds |
show details | |

|
#39
Shenandoah Way
Brighton, CO 80603
|
1,540 sq. feet
|
2 baths 4 beds |
show details | |

|
#40
Hunter Ave
Brighton, CO 80603
|
2,863 sq. feet
|
3 baths 5 beds |
show details |
| Photo | Address | Area | Beds / Baths | Price | Details |
|---|---|---|---|---|---|

|
#41
Whimsical Avenue
Brighton, CO 80603
|
2,265 sq. feet
|
2 baths 4 beds |
show details | |

|
#42
Ute Way
Brighton, CO 80603
|
1,747 sq. feet
|
2 baths 3 beds |
show details | |

|
#43
Valdai St
Brighton, CO 80603
|
1,352 sq. feet
|
2 baths 4 beds |
show details | |

|
#44
Willow Ct
Brighton, CO 80603
|
1,040 sq. feet
|
2 baths 3 beds |
show details | |

|
#45
Draw St
Brighton, CO 80603
|
1,607 sq. feet
|
3 baths 3 beds |
show details | |

|
#46
County Road 10
Keenesburg, CO 80643
|
1,705 sq. feet
|
1 baths 2 beds |
show details | |

|
#47
Xanadu St
Commerce City, CO 80022
|
2,116 sq. feet
|
2 baths 3 beds |
show details | |

|
#48
E 97th Way
Commerce City, CO 80022
|
1,718 sq. feet
|
3 baths 3 beds |
show details | |

|
#49
Fraser St
Commerce City, CO 80022
|
3,455 sq. feet
|
3 baths 4 beds |
show details | |

|
Check over 1 million property listings on Foreclosure.com!
|
browse all offers | |||

Latest news about housing in Hudson, CO collected exclusively by city-data.com from local newspapers, TV, and radio stations


Median year apartment built: 1981
Household type by relationship:
Households: 2,289- Male householders: 348 (58 living alone), Female householders: 395 (100 living alone)
386 spouses (369 opposite-sex spouses), 48 unmarried partners, (48 opposite-sex unmarried partners), 704 children (645 natural, 0 adopted, 59 stepchildren), 144 grandchildren, 35 brothers or sisters, 29 parents, 0 foster children, 60 other relatives, 52 non-relatives
- In group quarters: 82
Size of family households: 181 2-persons, 142 3-persons, 61 4-persons, 131 5-persons, 4 6-persons, 31 7-or-more-persons.
Size of nonfamily households: 169 1-person, 13 2-persons.
289 married couples with children.
91 single-parent households (61 men, 30 women).
59.3% of residents of Hudson speak English at home.
39.4% of residents speak Spanish at home (60% speak English very well, 17% speak English well, 9% speak English not well, 13% don't speak English at all).
0.4% of residents speak other Indo-European language at home (100% speak English very well).
0.4% of residents speak other language at home (100% speak English very well).
Foreign born population: 426 (18.6%)
(19.0% of them are naturalized citizens)
| Here: | 5.7 |
| State: | 6.8 |
| Here: | 4.6 |
| State: | 4.0 |

- Bedrooms in owner-occupied houses and condos in Hudson, Colorado
- 8no bedroom
- 241 bedroom
- 1032 bedrooms
- 2473 bedrooms
- 1324 bedrooms
- 355+ bedrooms

- Bedrooms in renter-occupied apartments in Hudson, Colorado
- 9no bedroom
- 391 bedroom
- 572 bedrooms
- 863 bedrooms
- 174 bedrooms
- 05+ bedrooms

- Cars and other vehicles available in Hudson in owner-occupied houses/condos
- 23no vehicle
- 751 vehicle
- 2422 vehicles
- 1253 vehicles
- 594 vehicles
- 245+ vehicles

- Cars and other vehicles available in Hudson in renter-occupied apartments
- 12no vehicle
- 881 vehicle
- 582 vehicles
- 423 vehicles
- 04 vehicles
- 85+ vehicles

- Rooms in owner-occupied houses in Hudson, Colorado
- 81 room
- 02 rooms
- 153 rooms
- 1604 rooms
- 875 rooms
- 966 rooms
- 697 rooms
- 238 rooms
- 919+ rooms

- Rooms in renter-occupied apartments in Hudson, Colorado
- 91 room
- 42 rooms
- 433 rooms
- 414 rooms
- 475 rooms
- 186 rooms
- 337 rooms
- 08 rooms
- 129+ rooms


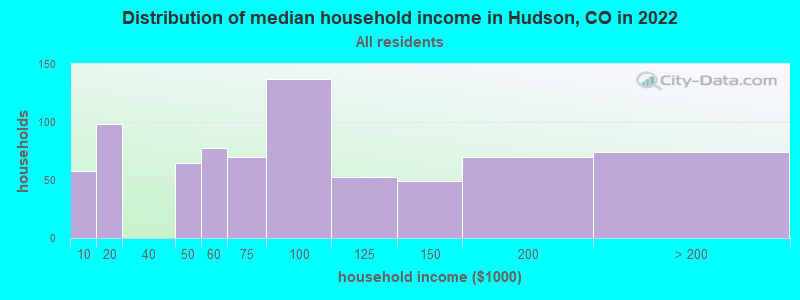
Hudson, CO household income distribution

- 58Less than $10,000
- 98$10,000 to $19,999
- 65$40,000 to $49,999
- 78$50,000 to $59,999
- 70$60,000 to $74,999
- 137$75,000 to $99,999
- 53$100,000 to $124,999
- 49$125,000 to $149,999
- 70$150,000 to $199,999
- 74$200,000 or more
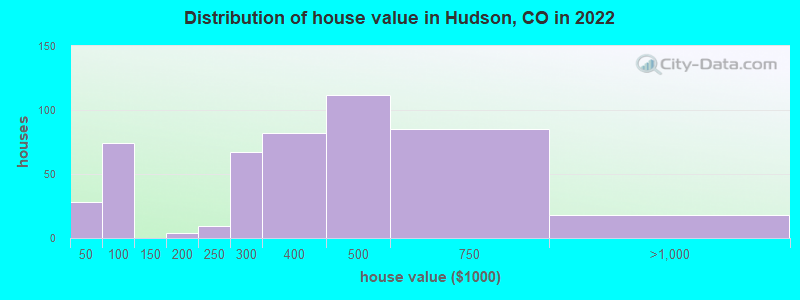
Home value of owner - occupied houses in 2022 in Hudson, CO
-
- 1$15,000 to $19,999
- 6$20,000 to $24,999
- 15$30,000 to $34,999
- 4$40,000 to $49,999
- 9$50,000 to $59,999
- 6$60,000 to $69,999
- 53$90,000 to $99,999
- 3$175,000 to $199,999
- 8$200,000 to $249,999
- 67$250,000 to $299,999
- 82$300,000 to $399,999
- 112$400,000 to $499,999
- 85$500,000 to $749,999
- 18$750,000 to $999,999
Rent paid by renters in 2022 in Hudson, CO
-
- 11$150 to $199
- 5$250 to $299
- 3$300 to $349
- 9$400 to $449
- 17$450 to $499
- 8$650 to $699
- 9$700 to $749
- 9$800 to $899
- 5$900 to $999
- 77$1,000 to $1,249
- 23$1,500 to $1,999
- 9No cash rent


Percentage of workers working in this county: 52.9%
Number of people working at home: 26 (2.3% of all workers)
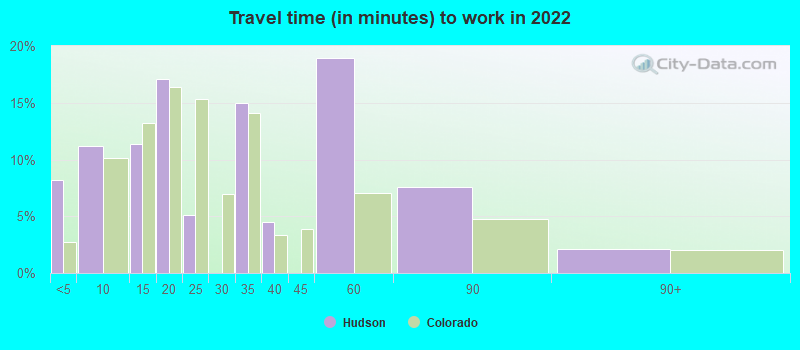
Travel time to work (commute)
- Less than 5 minutes: 10
- 5 to 9 minutes: 28
- 10 to 14 minutes: 88
- 15 to 19 minutes: 134
- 20 to 24 minutes: 82
- 25 to 29 minutes: 101
- 30 to 34 minutes: 228
- 35 to 39 minutes: 63
- 40 to 44 minutes: 151
- 45 to 59 minutes: 131
- 60 to 89 minutes: 61
- 90 or more minutes: 0
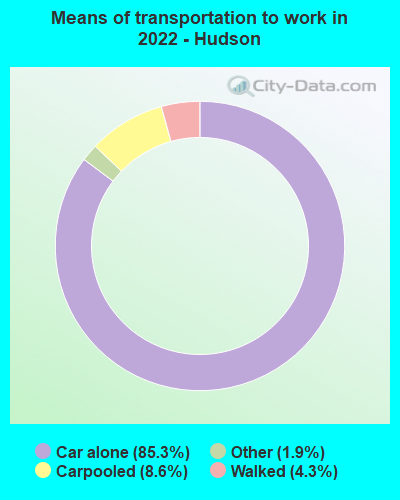
Means of transportation to work:
- Drove a car alone: 436 (72.3%)
- Carpooled: 44 (7.3%)
- Taxi: 11 (1.8%)
- Walked: 22 (3.6%)
- Worked at home: 85 (14.1%)

- Unemployment by race in 2022
- Unemployment rate for White non-Hispanic residents
- 3.4%Males
- 2.8%Females
- Unemployment rate for other race residents
- 23.9%Males
- Unemployment rate for two or more race residents
- 1.9%Females
- Unemployment rate for Hispanic or Latino residents
- 3.8%Males
- 1.1%Females

- Year of entry for the foreign-born population in Hudson, Colorado
- 152010 or later
- 2782000 to 2009
- 121990 to 1999
- 501980 to 1989
- 411970 to 1979
- 4Before 1970

First ancestries reported:
- Irish: 173 (11.9%)
- German: 99 (6.8%)
- American: 67 (4.6%)
- English: 45 (3.1%)
- Turkish: 31 (2.1%)
- European: 24 (1.7%)
- Norwegian: 19 (1.3%)
- African: 10 (0.7%)
- Scandinavian: 8 (0.6%)
- Dutch: 7 (0.5%)
- Canadian: 5 (0.3%)
- Eastern European: 5 (0.3%)
Most common places of birth for foreign-born residents (%):
| Hudson: | 92.8% (363) |
| Colorado: | 38.3% (209,491) |
| Hudson: | 2.0% (8) |
| Colorado: | 2.5% (13,706) |
| Hudson: | 1.8% (7) |
| Colorado: | 0.9% (4,772) |
| Hudson: | 1.8% (7) |
| Colorado: | 0.2% (894) |
Place of birth for U.S.-born residents:
- This state: 1,339
- Other state: 545
- Northeast: 42
- Midwest: 162
- South: 159
- West: 168
90.4% of Hudson residents lived in the same house 1 years ago.
Out of people who lived in different houses, 19.4% lived in this county.
Out of people who lived in different counties, 89.5% lived in Colorado.
| Hudson: | 90.4% |
| State average: | 83.6% |
Education attainment for males 25 years and older:
- No schooling: 30
- Nursery to 4th grade: 6
- 5th and 6th grade: 29
- 7th and 8th grade: 8
- 9th grade: 12
- 10th grade: 19
- 11th grade: 21
- 12th grade, no diploma: 6
- High school graduate (or equivalency): 330
- Less than 1 year of college: 33
- Some college more than 1 year, no degree: 74
- Associate degree: 112
- Bachelor's degree: 95
- Master's degree: 10
- Professional school degree: 0
- Doctorate degree: 3

Education attainment for females 25 years and older:
- No schooling: 154
- Nursery to 4th grade: 0
- 5th and 6th grade: 28
- 7th and 8th grade: 9
- 9th grade: 8
- 10th grade: 0
- 11th grade: 0
- 12th grade, no diploma: 17
- High school graduate (or equivalency): 248
- Less than 1 year of college: 22
- Some college more than 1 year, no degree: 117
- Associate degree: 84
- Bachelor's degree: 74
- Master's degree: 4
- Professional school degree: 0
- Doctorate degree: 5


Housing units in structures:
- One, detached: 502
- One, attached: 19
- Two: 17
- 5 to 9: 51
- 10 to 19: 24
- 20 to 49: 4
- Mobile homes: 151
- Boats, RVs, vans, etc.: 7
Median worth of mobile homes: $118,907
House/condo owner moved in on average 9 years ago
Renter moved in on average 0 years ago

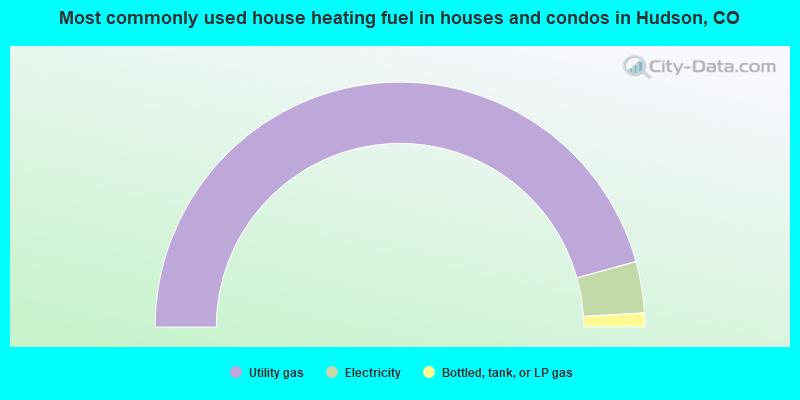
- 91.4%Utility gas
- 6.8%Electricity
- 1.8%Bottled, tank, or LP gas
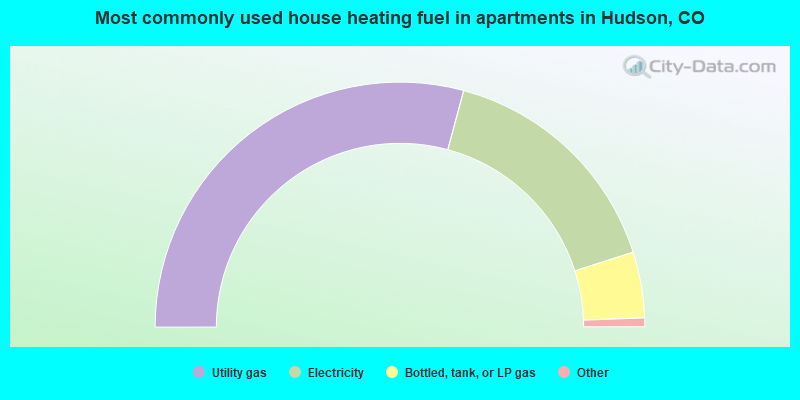
- 59.1%Utility gas
- 32.1%Electricity
- 8.8%Bottled, tank, or LP gas
Private vs. public school enrollment:
| Here: | 14.7% |
| Colorado: | 11.4% |
| Here: | 0.0% |
| Colorado: | 8.5% |
| Here: | 12.5% |
| Colorado: | 14.0% |


