Huntington, MA (Massachusetts) Houses and Residents
| Huntington: | $311,605 |
| Massachusetts: | $534,700 |
Total population: 2,180 (Urban population: 0, Rural population: 2,192 (5 farm, 2,187 nonfarm))
Houses: 911 (807 occupied: 617 owner occupied, 190 renter occupied)
| % of renters here: | 24% |
| State: | 38% |
Housing density: 34 houses/condos per square mile
Median price asked for vacant for-sale houses and condos in 2022 in this county: $222,792.
Median contract rent in 2022: $1,088 (lower quartile is $780, upper quartile is $1,495)
Median rent asked for vacant for-rent units in 2022: $1,426
Median gross rent in Huntington, MA in 2022: $1,300
Housing units in Huntington with a mortgage: 360 (29 second mortgage, 60 home equity loan, 0 both second mortgage and home equity loan)
Houses without a mortgage: 107
Compare current foreclosures near Huntington, MA:
| Photo | Address | Area | Beds / Baths | Price | Details |
|---|---|---|---|---|---|

|
#1
W Franklin St
Holyoke, MA 01040
|
1,558 sq. feet
|
1 baths 2 beds |
$234,900
|
show details |

|
#2
Cold Spring Rd
Southampton, MA 01073
|
2,736 sq. feet
|
1 baths 3 beds |
$284,900
|
show details |

|
#3
Butler Ave
Chicopee, MA 01020
|
1,445 sq. feet
|
1 baths 3 beds |
show details | |

|
#4
Pleasant St
Holyoke, MA 01040
|
4,057 sq. feet
|
3 baths 6 beds |
show details | |

|
#5
Wilfred St
Chicopee, MA 01020
|
1,360 sq. feet
|
1 baths 4 beds |
show details | |

|
#6
Russell Stage Rd
Blandford, MA 01008
|
1,650 sq. feet
|
2 baths 3 beds |
show details | |

|
#7
Worthy Ave
West Springfield, MA 01089
|
1,501 sq. feet
|
1 baths 3 beds |
show details | |

|
#8
Artisan St
Chicopee, MA 01013
|
1,125 sq. feet
|
1 baths 3 beds |
show details | |

|
#9
Central Park Dr
Holyoke, MA 01040
|
2,844 sq. feet
|
2 baths 4 beds |
show details | |

|
#10
Brown Ave
Holyoke, MA 01040
|
2,388 sq. feet
|
2 baths 6 beds |
show details |
| Photo | Address | Area | Beds / Baths | Price | Details |
|---|---|---|---|---|---|

|
#11
Hancock St
Westfield, MA 01085
|
1,448 sq. feet
|
1 baths 2 beds |
show details | |

|
#12
Royal St
Chicopee, MA 01020
|
3,296 sq. feet
|
4 baths 7 beds |
show details | |

|
#13
Ontario St
Springfield, MA 01104
|
1,405 sq. feet
|
1 baths 3 beds |
show details | |

|
#14
Montgomery St
Westfield, MA 01085
|
1,714 sq. feet
|
2 baths 4 beds |
show details | |

|
#15
Hillcrest Ave
West Springfield, MA 01089
|
1,007 sq. feet
|
1 baths 3 beds |
show details | |

|
#16
Old Pendleton Ave
Chicopee, MA 01020
|
1,340 sq. feet
|
1 baths 3 beds |
show details | |

|
#17
Carew St
Springfield, MA 01104
|
2,968 sq. feet
|
2 baths 6 beds |
show details | |

|
#18
Hillcrest Ave
South Hadley, MA 01075
|
1,646 sq. feet
|
1 baths 3 beds |
show details | |

|
#19
Bridge St # 1
Hatfield, MA 01038
|
3,300 sq. feet
|
3 baths 4 beds |
show details | |

|
#20
Kosior Dr
Hadley, MA 01035
|
1,040 sq. feet
|
1 baths 2 beds |
show details |
| Photo | Address | Area | Beds / Baths | Price | Details |
|---|---|---|---|---|---|

|
#21
Irene St
Chicopee, MA 01020
|
1,088 sq. feet
|
1 baths 3 beds |
show details | |

|
#22
Albert St
West Springfield, MA 01089
|
1,266 sq. feet
|
1 baths 3 beds |
show details | |

|
#23
Stebbins St
Chicopee, MA 01020
|
864 sq. feet
|
1 baths 2 beds |
show details | |

|
#24
Bowers St
West Springfield, MA 01089
|
1,080 sq. feet
|
1 baths 3 beds |
show details | |

|
#25
Beeler Ave
Chicopee, MA 01020
|
1,056 sq. feet
|
1 baths 3 beds |
show details | |

|
#26
Telegraph Ave
Chicopee, MA 01020
|
3,072 sq. feet
|
5 baths 6 beds |
show details | |

|
#27
Pondview Dr
Chicopee, MA 01020
|
1,200 sq. feet
|
1 baths 3 beds |
show details | |

|
#28
Birchwood Rd
Southwick, MA 01077
|
1,080 sq. feet
|
1 baths 3 beds |
show details | |

|
#29
Ridgeview Dr
Feeding Hills, MA 01030
|
1,356 sq. feet
|
1 baths 3 beds |
show details | |

|
#30
Irene St
Chicopee, MA 01020
|
1,088 sq. feet
|
2 baths 3 beds |
show details |
| Photo | Address | Area | Beds / Baths | Price | Details |
|---|---|---|---|---|---|

|
#31
Dale St
Chicopee, MA 01013
|
2,344 sq. feet
|
2 baths 3 beds |
show details | |

|
#32
Rolf Ave
Chicopee, MA 01020
|
2,354 sq. feet
|
2 baths 4 beds |
show details | |

|
#33
W Parkview Dr
South Hadley, MA 01075
|
1,608 sq. feet
|
2 baths 3 beds |
show details | |

|
#34
Perrault St
Chicopee, MA 01013
|
1,156 sq. feet
|
1 baths 2 beds |
show details | |

|
#35
Dewey St
West Springfield, MA 01089
|
1,193 sq. feet
|
1 baths 3 beds |
show details | |

|
#36
Chicopee St Apt 42
Chicopee, MA 01013
|
774 sq. feet
|
1 baths 2 beds |
show details | |

|
#37
Chicopee St Apt 21
Chicopee, MA 01013
|
774 sq. feet
|
1 baths 2 beds |
show details | |

|
#38
State St
Chicopee, MA 01013
|
1,632 sq. feet
|
1 baths 4 beds |
show details | |

|
#39
Pine St
South Hadley, MA 01075
|
2,357 sq. feet
|
2 baths 4 beds |
show details | |

|
#40
Morgan Rd
West Springfield, MA 01089
|
1,906 sq. feet
|
2 baths 3 beds |
show details |
| Photo | Address | Area | Beds / Baths | Price | Details |
|---|---|---|---|---|---|

|
#41
Pershing Ave
South Hadley, MA 01075
|
1,228 sq. feet
|
1 baths 3 beds |
show details | |

|
#42
Woodbrook Ter
West Springfield, MA 01089
|
2,974 sq. feet
|
2 baths 4 beds |
show details | |

|
#43
Chicopee St # 2
Chicopee, MA 01013
|
2,402 sq. feet
|
2 baths 4 beds |
show details | |

|
#44
Boulay Cir
Chicopee, MA 01020
|
1,048 sq. feet
|
1 baths 2 beds |
show details | |

|
#45
Mountain Ave
South Hadley, MA 01075
|
1,884 sq. feet
|
2 baths 3 beds |
show details | |

|
#46
Ohio Ave
Chicopee, MA 01013
|
1,411 sq. feet
|
1 baths 4 beds |
show details | |

|
#47
David Dr
Hinsdale, MA 01235
|
1,664 sq. feet
|
2 baths 3 beds |
show details | |

|
#48
Calvin St
Chicopee, MA 01013
|
966 sq. feet
|
2 baths 3 beds |
show details | |

|
#49
Brush Hill Ave Apt 56
West Springfield, MA 01089
|
724 sq. feet
|
1 baths 1 beds |
show details | |

|
Check over 1 million property listings on Foreclosure.com!
|
browse all offers | |||

Latest news about housing in Huntington, MA collected exclusively by city-data.com from local newspapers, TV, and radio stations

 | How Much Massachusetts Households Make Per Year: Census Data (37 replies) |
| How safe is the area around the mission main apartments (26 replies) |
| Is waiting for home prices to come down pointless? (148 replies) |
| Should I move to Boston from NYC? Apartments, racism & arts scene??? (50 replies) |
| Where to live (rental): Working in Lexington (18 replies) |
| Can someone describe Burlington? (214 replies) |

Household type by relationship:
Households: 137,248- In family households: 102,805 (23,141 male householders, 11,339 female householders)
26,289 spouses, 34,225 children (31,880 natural, 1,196 adopted, 1,149 stepchildren), 1,465 grandchildren, 834 brothers or sisters, 944 parents, foster children, 834 other relatives, 3,097 non-relatives
- In nonfamily households: 34,443 (10,544 male householders (7,207 living alone)), 13,678 female householders (10,221 living alone)), 10,221 nonrelatives
- In group quarters: 20,832 (1,268 institutionalized population)
21,116 married couples with children.
6,740 single-parent households (1,315 men, 5,425 women).
96.2% of residents of Huntington speak English at home.
1.1% of residents speak Spanish at home (50% speak English very well, 27% speak English well, 23% speak English not well).
2.7% of residents speak other Indo-European language at home (54% speak English very well, 32% speak English well, 14% speak English not well).
Foreign born population: 46 (2.0%)
(95.7% of them are naturalized citizens)
| Here: | 6.5 |
| State: | 6.5 |
| Here: | 6.0 |
| State: | 4.0 |

- Bedrooms in owner-occupied houses and condos in Huntington, Massachusetts
- 0no bedroom
- 201 bedroom
- 1302 bedrooms
- 3153 bedrooms
- 1224 bedrooms
- 305+ bedrooms

- Bedrooms in renter-occupied apartments in Huntington, Massachusetts
- 0no bedroom
- 551 bedroom
- 782 bedrooms
- 503 bedrooms
- 44 bedrooms
- 35+ bedrooms

- Cars and other vehicles available in Huntington in owner-occupied houses/condos
- 20no vehicle
- 1631 vehicle
- 3012 vehicles
- 1043 vehicles
- 244 vehicles
- 55+ vehicles

- Cars and other vehicles available in Huntington in renter-occupied apartments
- 28no vehicle
- 951 vehicle
- 632 vehicles
- 43 vehicles
- 04 vehicles
- 05+ vehicles

- Rooms in owner-occupied houses in Huntington, Massachusetts
- 01 room
- 02 rooms
- 283 rooms
- 434 rooms
- 1485 rooms
- 1276 rooms
- 1477 rooms
- 758 rooms
- 499+ rooms

- Rooms in renter-occupied apartments in Huntington, Massachusetts
- 01 room
- 42 rooms
- 483 rooms
- 554 rooms
- 355 rooms
- 326 rooms
- 97 rooms
- 48 rooms
- 39+ rooms


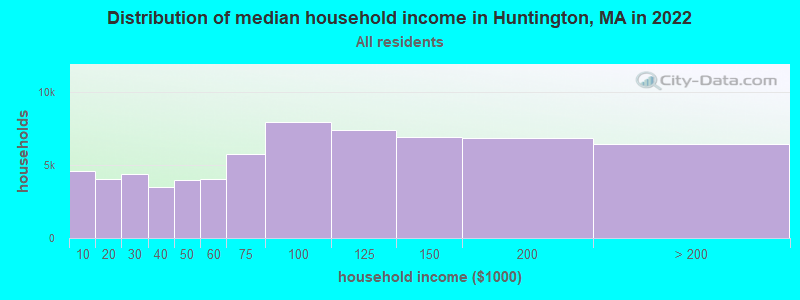
Huntington, MA household income distribution

- 4,614Less than $10,000
- 4,051$10,000 to $19,999
- 4,375$20,000 to $29,999
- 3,513$30,000 to $39,999
- 3,954$40,000 to $49,999
- 4,077$50,000 to $59,999
- 5,747$60,000 to $74,999
- 7,967$75,000 to $99,999
- 7,427$100,000 to $124,999
- 6,936$125,000 to $149,999
- 6,897$150,000 to $199,999
- 6,478$200,000 or more
Percentage of workers working in this county: 44.7%
Number of people working at home: 245 (18.4% of all workers)
Travel time to work (commute)
- Less than 5 minutes: 46
- 5 to 9 minutes: 104
- 10 to 14 minutes: 36
- 15 to 19 minutes: 27
- 20 to 24 minutes: 144
- 25 to 29 minutes: 107
- 30 to 34 minutes: 189
- 35 to 39 minutes: 59
- 40 to 44 minutes: 103
- 45 to 59 minutes: 193
- 60 to 89 minutes: 89
- 90 or more minutes: 52
Means of transportation to work:
- Drove a car alone: 1,002 (84.8%)
- Carpooled: 105 (8.9%)
- Bus or trolley bus: 10 (0.8%)
- Motorcycle: 2 (0.2%)
- Bicycle: 1 (0.1%)
- Walked: 24 (2.0%)
- Other means: 5 (0.4%)
- Worked at home: 32 (2.7%)


- Year of entry for the foreign-born population in Huntington, Massachusetts
- 61995 to March 2000
- 01990 to 1994
- 01985 to 1989
- 01980 to 1984
- 01975 to 1979
- 31970 to 1974
- 21965 to 1969
- 20Before 1965

First ancestries reported:
- English: 393 (15.3%)
- French: 381 (14.8%)
- Irish: 381 (14.8%)
- French Canadian: 279 (10.8%)
- German: 207 (8.0%)
- Polish: 203 (7.9%)
- Other: 178 (6.9%)
- Italian: 145 (5.6%)
- United States: 114 (4.4%)
- Scottish: 79 (3.1%)
- Scotch-Irish: 37 (1.4%)
- Norwegian: 29 (1.1%)
- Swedish: 29 (1.1%)
- Portuguese: 24 (0.9%)
- Lithuanian: 20 (0.8%)
- Dutch: 15 (0.6%)
- Danish: 13 (0.5%)
- Russian: 12 (0.5%)
- Greek: 8 (0.3%)
- Ukrainian: 6 (0.2%)
- Hungarian: 5 (0.2%)
- Czech: 4 (0.2%)
- Slovak: 3 (0.1%)
- West Indian: 3 (0.1%)
- Swiss: 2 (0.08%)
- Welsh: 2 (0.08%)
Most common places of birth for foreign-born residents (%):
| Huntington: | 25.8% (8) |
| Massachusetts: | 1.9% (14,883) |
| Huntington: | 19.4% (6) |
| Massachusetts: | 8.6% (66,627) |
| Huntington: | 12.9% (4) |
| Massachusetts: | 3.3% (25,403) |
| Huntington: | 12.9% (4) |
| Massachusetts: | 1.8% (13,543) |
| Huntington: | 12.9% (4) |
| Massachusetts: | 5.2% (40,247) |
| Huntington: | 9.7% (3) |
| Massachusetts: | 2.3% (17,449) |
| Huntington: | 6.5% (2) |
| Massachusetts: | 2.3% (17,987) |
Place of birth for U.S.-born residents:
- This state: 1,705
- Other state: 436
- Northeast: 313
- Midwest: 51
- South: 50
- West: 22
68% of Huntington residents lived in the same house 5 years ago.
Out of people who lived in different houses, 37% lived in this county.
Out of people who lived in different counties, 74% lived in Massachusetts.
Education attainment for males 25 years and older:
- No schooling: 2
- Nursery to 4th grade: 0
- 5th and 6th grade: 2
- 7th and 8th grade: 19
- 9th grade: 14
- 10th grade: 29
- 11th grade: 15
- 12th grade, no diploma: 17
- High school graduate (or equivalency): 288
- Less than 1 year of college: 52
- Some college more than 1 year, no degree: 81
- Associate degree: 70
- Bachelor's degree: 51
- Master's degree: 46
- Professional school degree: 8
- Doctorate degree: 5

Education attainment for females 25 years and older:
- No schooling: 3
- Nursery to 4th grade: 0
- 5th and 6th grade: 2
- 7th and 8th grade: 11
- 9th grade: 8
- 10th grade: 11
- 11th grade: 6
- 12th grade, no diploma: 9
- High school graduate (or equivalency): 269
- Less than 1 year of college: 68
- Some college more than 1 year, no degree: 109
- Associate degree: 60
- Bachelor's degree: 102
- Master's degree: 43
- Professional school degree: 23
- Doctorate degree: 11


Housing units in structures:
- One, detached: 730
- One, attached: 6
- Two: 75
- 3 or 4: 43
- 5 to 9: 18
- 10 to 19: 3
- 20 to 49: 6
- Mobile homes: 30
Median worth of mobile homes: $165,637

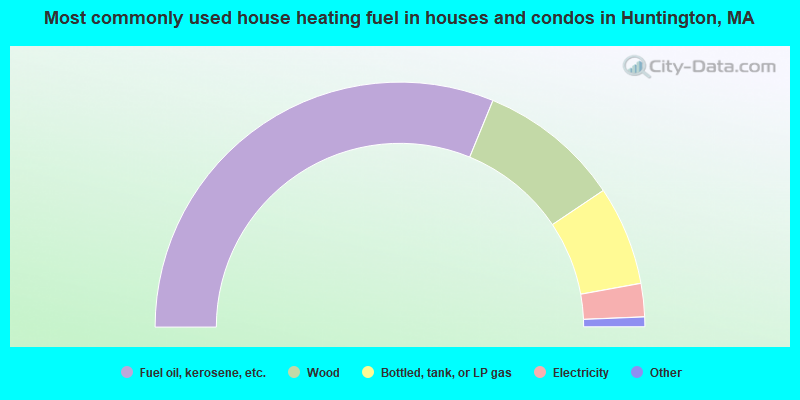
- 62.4%Fuel oil, kerosene, etc.
- 18.8%Wood
- 13.1%Bottled, tank, or LP gas
- 4.4%Electricity
- 0.6%Utility gas
- 0.3%Coal or coke
- 0.3%Other fuel
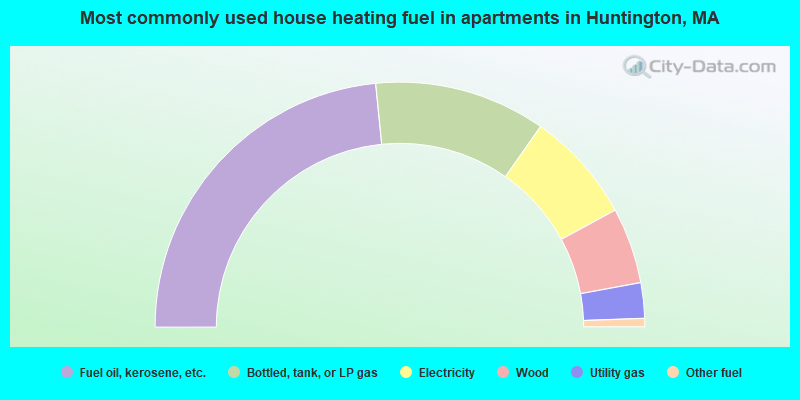
- 46.8%Fuel oil, kerosene, etc.
- 22.6%Bottled, tank, or LP gas
- 14.7%Electricity
- 10.0%Wood
- 4.7%Utility gas
- 1.1%Other fuel
Private vs. public school enrollment:
| Here: | 4.3% |
| Massachusetts: | 10.8% |
| Here: | 6.0% |
| Massachusetts: | 12.2% |
| Here: | 21.6% |
| Massachusetts: | 48.2% |


