Huntington, TX (Texas) Houses and Residents
| Huntington: | $115,984 |
| Texas: | $275,400 |
Mean price in 2022:
Detached houses: $153,950
Here: $153,950 State: $369,058 Mobile homes: $22,052
Here: $22,052 State: $124,413
Total population: 2,106 (Urban population: 0, Rural population: 2,083 (13 farm, 2,070 nonfarm))
Houses: 1,421 (1,298 occupied: 591 owner occupied, 800 renter occupied)
| % of renters here: | 58% |
| State: | 38% |
Housing density: 521 houses/condos per square mile
Median price asked for vacant for-sale houses and condos in 2022: $455,748.
Median contract rent in 2022: $570 (lower quartile is $347, upper quartile is $943)
Median rent asked for vacant for-rent units in 2022: $1,094
Median gross rent in Huntington, TX in 2022: $846
Housing units in Huntington with a mortgage: 211 (0 second mortgage, 0 home equity loan, 0 both second mortgage and home equity loan)
Houses without a mortgage: 5
Median household income for houses/condos with a mortgage: $80,954
Median household income for apartments without a mortgage: $69,644
Median monthly housing costs: $716
Compare current foreclosures near Huntington, TX:
| Photo | Address | Area | Beds / Baths | Price | Details |
|---|---|---|---|---|---|

|
#1
Kay Currie Rd
Huntington, TX 75949
|
- sq. feet
|
- baths - beds |
show details | |

|
#2
Pahal Rd
Huntington, TX 75949
|
1,616 sq. feet
|
- baths - beds |
show details | |

|
#3
Hudnall Rd
Huntington, TX 75949
|
1,440 sq. feet
|
- baths - beds |
show details | |

|
#4
Luce Rd
Huntington, TX 75949
|
1,620 sq. feet
|
- baths - beds |
show details | |

|
#5
Charlie Porter Rd
Huntington, TX 75949
|
- sq. feet
|
- baths - beds |
show details | |

|
#6
Rhodes St
Huntington, TX 75949
|
- sq. feet
|
- baths - beds |
show details | |

|
#7
E Pine St
Huntington, TX 75949
|
- sq. feet
|
- baths - beds |
show details | |

|
#8
W Walnut St
Huntington, TX 75949
|
1,381 sq. feet
|
- baths - beds |
show details | |

|
#9
Jackson St
Diboll, TX 75941
|
2,329 sq. feet
|
- baths - beds |
show details | |

|
#10
Fm 2021
Lufkin, TX 75904
|
1,120 sq. feet
|
- baths - beds |
show details |
| Photo | Address | Area | Beds / Baths | Price | Details |
|---|---|---|---|---|---|

|
#11
Fm 2680
Lufkin, TX 75904
|
- sq. feet
|
- baths - beds |
show details | |

|
#12
Dc Lawson Rd
Lufkin, TX 75904
|
1,200 sq. feet
|
- baths - beds |
show details | |

|
#13
Phil Jackson Road
Lufkin, TX 75904
|
- sq. feet
|
- baths - beds |
show details | |

|
#14
Rainwood Dr
Lufkin, TX 75901
|
1,242 sq. feet
|
- baths - beds |
show details | |

|
#15
Harris St
Lufkin, TX 75904
|
- sq. feet
|
- baths - beds |
show details | |

|
#16
Smallwood Rd
Lufkin, TX 75904
|
- sq. feet
|
- baths - beds |
show details | |

|
#17
Cumming St
Lufkin, TX 75904
|
1,064 sq. feet
|
- baths - beds |
show details | |

|
#18
Crosswood St
Lufkin, TX 75904
|
1,514 sq. feet
|
- baths - beds |
show details | |

|
#19
Delmas Dr
Lufkin, TX 75901
|
1,391 sq. feet
|
- baths - beds |
show details | |

|
#20
Berry Rd
Lufkin, TX 75904
|
- sq. feet
|
- baths - beds |
show details |
| Photo | Address | Area | Beds / Baths | Price | Details |
|---|---|---|---|---|---|

|
#21
Us Highway 69 N
Lufkin, TX 75904
|
- sq. feet
|
- baths - beds |
show details | |

|
#22
Fm 2108
Diboll, TX 75941
|
- sq. feet
|
- baths - beds |
show details | |

|
#23
Mcdonald Ln
Zavalla, TX 75980
|
- sq. feet
|
- baths - beds |
show details | |

|
#24
W Frank Ave Apt 305
Lufkin, TX 75904
|
- sq. feet
|
- baths - beds |
show details | |

|
#25
W Frank Ave Apt 403
Lufkin, TX 75904
|
- sq. feet
|
- baths - beds |
show details | |

|
#26
Ridgewood St
Lufkin, TX 75904
|
1,428 sq. feet
|
- baths - beds |
show details | |

|
#27
Holubec St
Diboll, TX 75941
|
- sq. feet
|
- baths - beds |
show details | |

|
#28
Sawmill Ln
Lufkin, TX 75904
|
- sq. feet
|
- baths - beds |
show details | |

|
#29
Us Highway 69 N
Lufkin, TX 75904
|
2,092 sq. feet
|
- baths - beds |
show details | |

|
#30
Mccarty Rd
Lufkin, TX 75904
|
1,657 sq. feet
|
- baths - beds |
show details |
| Photo | Address | Area | Beds / Baths | Price | Details |
|---|---|---|---|---|---|

|
#31
Lancewood Cir
Lufkin, TX 75904
|
1,752 sq. feet
|
- baths - beds |
show details | |

|
#32
Shady Grove Loop
Lufkin, TX 75904
|
1,254 sq. feet
|
- baths - beds |
show details | |

|
#33
Shady Grove Loop
Lufkin, TX 75904
|
1,402 sq. feet
|
- baths - beds |
show details | |

|
#34
Fm 2021
Lufkin, TX 75904
|
860 sq. feet
|
- baths - beds |
show details | |

|
#35
State Highway 103 W
Lufkin, TX 75904
|
1,311 sq. feet
|
- baths - beds |
show details | |

|
#36
E.o. Woods Rd
Zavalla, TX 75980
|
- sq. feet
|
- baths - beds |
show details | |

|
#37
S Temple Dr
Diboll, TX 75941
|
1,434 sq. feet
|
- baths - beds |
show details | |

|
#38
Rutland St
Diboll, TX 75941
|
- sq. feet
|
- baths - beds |
show details | |

|
#39
N Hines St
Diboll, TX 75941
|
1,961 sq. feet
|
- baths - beds |
show details | |

|
#40
Cross Timbers St
Lufkin, TX 75904
|
- sq. feet
|
- baths - beds |
show details |
| Photo | Address | Area | Beds / Baths | Price | Details |
|---|---|---|---|---|---|

|
#41
Cross Timbers St
Lufkin, TX 75904
|
1,705 sq. feet
|
- baths - beds |
show details | |

|
#42
Sun Meadow St
Lufkin, TX 75904
|
1,120 sq. feet
|
- baths - beds |
show details | |

|
#43
Sprucewood Dr
Lufkin, TX 75904
|
- sq. feet
|
- baths - beds |
show details | |

|
#44
Trailwood Ct
Lufkin, TX 75904
|
2,834 sq. feet
|
- baths - beds |
show details | |

|
#45
Fm 2497
Diboll, TX 75941
|
- sq. feet
|
- baths - beds |
show details | |

|
#46
Columbine Dr
Lufkin, TX 75904
|
3,234 sq. feet
|
- baths - beds |
show details | |

|
#47
Jefferson Ave
Lufkin, TX 75904
|
- sq. feet
|
- baths - beds |
show details | |

|
#48
Trailwood Cir
Lufkin, TX 75904
|
1,628 sq. feet
|
- baths - beds |
show details | |

|
#49
Stonewood Dr
Lufkin, TX 75901
|
868 sq. feet
|
- baths - beds |
show details | |

|
Check over 1 million property listings on Foreclosure.com!
|
browse all offers | |||

Latest news about housing in Huntington, TX collected exclusively by city-data.com from local newspapers, TV, and radio stations

 | Report: DFW homes now less affordable than Chicago (11 replies) |
| Highland homes and Coventry, good builders? (14 replies) |
| Frisco Springs community (Trophy Homes) (21 replies) |
| Best & Worst Home Builders in Dallas Texas (29 replies) |
| Section 8 Apartments off FM 1560?? (99 replies) |
| Custom Home Builders? - DFW Ft Worth area (10 replies) |

Median year apartment built: 1986
Household type by relationship:
Households: 3,508- Male householders: 402 (128 living alone), Female householders: 888 (178 living alone)
467 spouses (467 opposite-sex spouses), 139 unmarried partners, (139 opposite-sex unmarried partners), 1,217 children (1,112 natural, 22 adopted, 83 stepchildren), 148 grandchildren, 22 brothers or sisters, 38 parents, 0 foster children, 51 other relatives, 53 non-relatives
- In group quarters: 79
Size of family households: 425 2-persons, 92 3-persons, 367 4-persons, 66 5-persons, 19 6-persons, 12 7-or-more-persons.
Size of nonfamily households: 347 1-person, 43 2-persons.
741 married couples with children.
174 single-parent households (118 men, 56 women).
99.3% of residents of Huntington speak English at home.
0.6% of residents speak Spanish at home (100% speak English very well).
0.2% of residents speak Asian or Pacific Island language at home (100% speak English well).
| Here: | 5.3 |
| State: | 6.3 |
| Here: | 4.5 |
| State: | 4.0 |

- Bedrooms in owner-occupied houses and condos in Huntington, Texas
- 0no bedroom
- 181 bedroom
- 1882 bedrooms
- 3053 bedrooms
- 804 bedrooms
- 05+ bedrooms

- Bedrooms in renter-occupied apartments in Huntington, Texas
- 13no bedroom
- 1391 bedroom
- 2312 bedrooms
- 4103 bedrooms
- 84 bedrooms
- 05+ bedrooms

- Cars and other vehicles available in Huntington in owner-occupied houses/condos
- 7no vehicle
- 1941 vehicle
- 3082 vehicles
- 613 vehicles
- 04 vehicles
- 225+ vehicles

- Cars and other vehicles available in Huntington in renter-occupied apartments
- 103no vehicle
- 2671 vehicle
- 4122 vehicles
- 183 vehicles
- 04 vehicles
- 05+ vehicles

- Rooms in owner-occupied houses in Huntington, Texas
- 01 room
- 02 rooms
- 1253 rooms
- 1044 rooms
- 1325 rooms
- 1136 rooms
- 907 rooms
- 208 rooms
- 89+ rooms

- Rooms in renter-occupied apartments in Huntington, Texas
- 01 room
- 232 rooms
- 1903 rooms
- 1744 rooms
- 1095 rooms
- 776 rooms
- 187 rooms
- 2018 rooms
- 109+ rooms


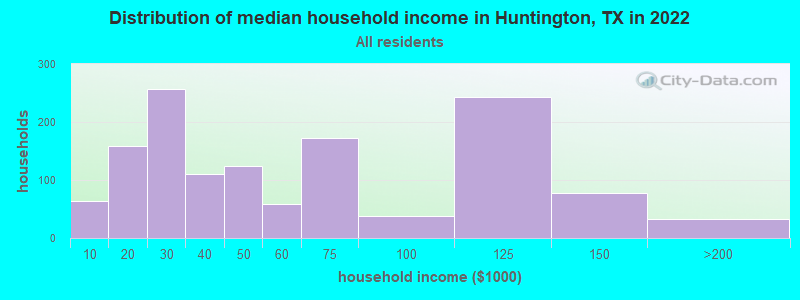
Huntington, TX household income distribution

- 64Less than $10,000
- 158$10,000 to $19,999
- 257$20,000 to $29,999
- 111$30,000 to $39,999
- 124$40,000 to $49,999
- 59$50,000 to $59,999
- 173$60,000 to $74,999
- 38$75,000 to $99,999
- 243$100,000 to $124,999
- 78$125,000 to $149,999
- 33$150,000 to $199,999
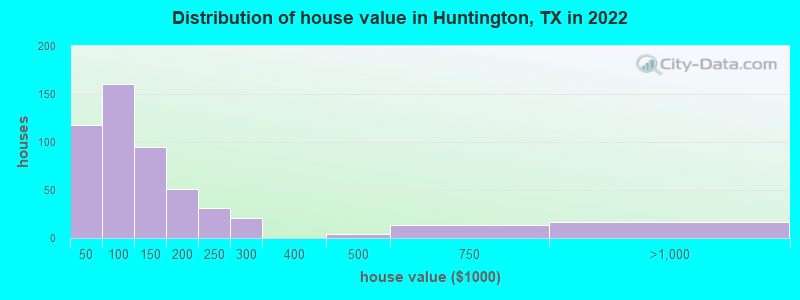
Home value of owner - occupied houses in 2022 in Huntington, TX
-
- 15Less than $10,000
- 18$10,000 to $14,999
- 32$20,000 to $24,999
- 10$25,000 to $29,999
- 36$35,000 to $39,999
- 4$40,000 to $49,999
- 83$50,000 to $59,999
- 30$80,000 to $89,999
- 40$90,000 to $99,999
- 55$100,000 to $124,999
- 39$125,000 to $149,999
- 35$150,000 to $174,999
- 15$175,000 to $199,999
- 31$200,000 to $249,999
- 21$250,000 to $299,999
- 3$400,000 to $499,999
- 14$500,000 to $749,999
- 16$750,000 to $999,999
Rent paid by renters in 2022 in Huntington, TX
-
- 2Less than $100
- 16$100 to $149
- 18$150 to $199
- 29$200 to $249
- 44$250 to $299
- 64$300 to $349
- 35$350 to $399
- 66$450 to $499
- 6$500 to $549
- 20$550 to $599
- 6$600 to $649
- 57$650 to $699
- 25$800 to $899
- 319$900 to $999
- 37$1,000 to $1,249
- 5$1,250 to $1,499
- 72No cash rent


Percentage of workers working in this county: 81.3%
Number of people working at home: 36 (2.4% of all workers)
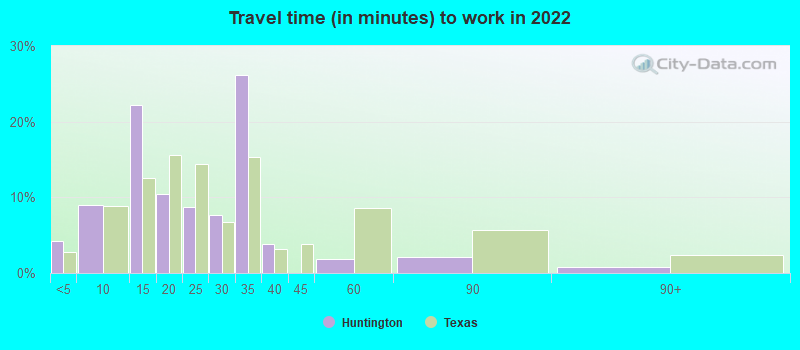
Travel time to work (commute)
- Less than 5 minutes: 65
- 5 to 9 minutes: 83
- 10 to 14 minutes: 127
- 15 to 19 minutes: 399
- 20 to 24 minutes: 233
- 25 to 29 minutes: 69
- 30 to 34 minutes: 90
- 35 to 39 minutes: 21
- 40 to 44 minutes: 82
- 45 to 59 minutes: 17
- 60 to 89 minutes: 166
- 90 or more minutes: 12
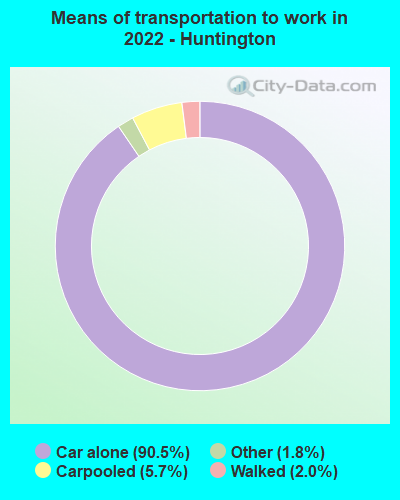
Means of transportation to work:
- Drove a car alone: 857 (83.6%)
- Carpooled: 58 (5.7%)
- Taxi: 20 (2.0%)
- Walked: 20 (2.0%)
- Worked at home: 36 (3.5%)

- Unemployment by race in 2022
- Unemployment rate for White non-Hispanic residents
- 4.6%Males
- Unemployment rate for Black residents
- 21.9%Males

- Year of entry for the foreign-born population in Huntington, Texas
- 281995 to March 2000
- 61990 to 1994
- 01985 to 1989
- 51980 to 1984
- 61975 to 1979
- 01970 to 1974
- 01965 to 1969
- 0Before 1965

First ancestries reported:
- American: 178 (23.3%)
- English: 106 (13.8%)
- Italian: 101 (13.2%)
- European: 90 (11.8%)
- Irish: 53 (6.9%)
- German: 38 (5.0%)
- Swedish: 14 (1.8%)
- Norwegian: 11 (1.4%)
- French Canadian: 6 (0.8%)
- Scotch-Irish: 4 (0.5%)
Most common places of birth for foreign-born residents (%):
| Huntington: | 84.4% (38) |
| Texas: | 64.8% (1,879,369) |
| Huntington: | 8.9% (4) |
| Texas: | 0.2% (5,497) |
| Huntington: | 4.4% (2) |
| Texas: | 0.2% (6,915) |
Place of birth for U.S.-born residents:
- This state: 2,972
- Other state: 526
- Northeast: 39
- Midwest: 31
- South: 352
- West: 125
62.5% of Huntington residents lived in the same house 1 years ago.
Out of people who lived in different houses, 26.0% lived in this county.
Out of people who lived in different counties, 19.5% lived in Texas.
| Huntington: | 62.5% |
| State average: | 85.7% |
Education attainment for males 25 years and older:
- No schooling: 0
- Nursery to 4th grade: 0
- 5th and 6th grade: 0
- 7th and 8th grade: 53
- 9th grade: 16
- 10th grade: 0
- 11th grade: 7
- 12th grade, no diploma: 6
- High school graduate (or equivalency): 452
- Less than 1 year of college: 51
- Some college more than 1 year, no degree: 179
- Associate degree: 115
- Bachelor's degree: 15
- Master's degree: 4
- Professional school degree: 4
- Doctorate degree: 0

Education attainment for females 25 years and older:
- No schooling: 39
- Nursery to 4th grade: 0
- 5th and 6th grade: 0
- 7th and 8th grade: 54
- 9th grade: 24
- 10th grade: 102
- 11th grade: 30
- 12th grade, no diploma: 33
- High school graduate (or equivalency): 609
- Less than 1 year of college: 83
- Some college more than 1 year, no degree: 62
- Associate degree: 49
- Bachelor's degree: 214
- Master's degree: 49
- Professional school degree: 0
- Doctorate degree: 10


Housing units in structures:
- One, detached: 991
- Two: 206
- 3 or 4: 21
- 5 to 9: 43
- 20 to 49: 5
- Mobile homes: 153
Median worth of mobile homes: $27,419
Housing units lacking complete kitchen facilities in 2022: 4.3%
House/condo owner moved in on average 7 years ago
Renter moved in on average 3 years ago

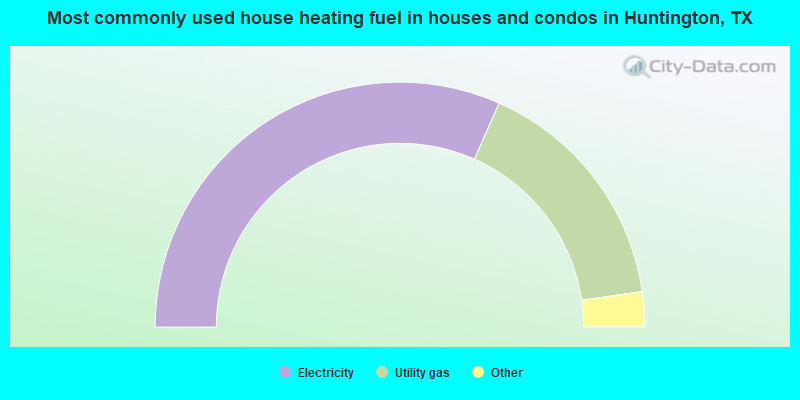
- 63.3%Electricity
- 32.1%Utility gas
- 3.5%Bottled, tank, or LP gas
- 1.1%No fuel used
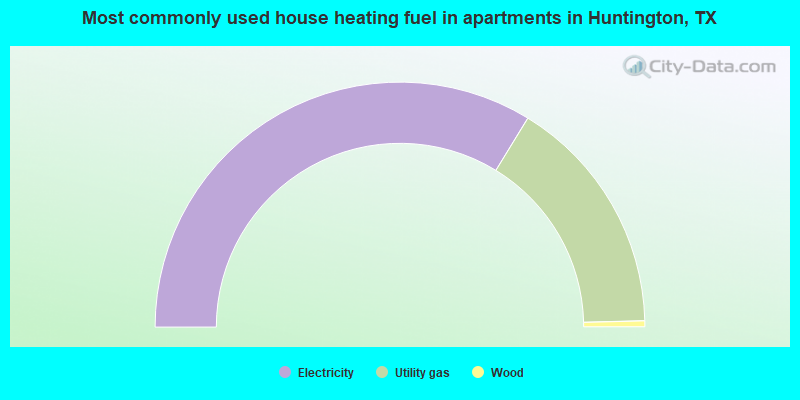
- 67.5%Electricity
- 31.7%Utility gas
- 0.8%Wood
Private vs. public school enrollment:
| Here: | 0.0% |
| Texas: | 8.8% |
| Here: | 0.0% |
| Texas: | 8.0% |
| Here: | 7.7% |
| Texas: | 16.2% |


