Huntington, VT (Vermont) Houses and Residents
| Huntington: | $363,019 |
| Vermont: | $304,700 |
Total population: 1,938 (Urban population: 0, Rural population: 1,867 (76 farm, 1,791 nonfarm))
Houses: 746 (694 occupied: 615 owner occupied, 79 renter occupied)
| % of renters here: | 11% |
| State: | 26% |
Housing density: 20 houses/condos per square mile
Median price asked for vacant for-sale houses and condos in 2022 in this county: $706,355.
Median contract rent in 2022: $1,171 (lower quartile is $907, upper quartile is $1,455)
Median rent asked for vacant for-rent units in 2022: $1,341
Median gross rent in Huntington, VT in 2022: $1,267
Housing units in Huntington with a mortgage: 245 (10 second mortgage, 26 home equity loan, 0 both second mortgage and home equity loan)
Houses without a mortgage: 66
Compare current foreclosures near Huntington, VT:
| Photo | Address | Area | Beds / Baths | Price | Details |
|---|---|---|---|---|---|

|
#1
Barrett St
South Burlington, VT 05403
|
1,407 sq. feet
|
2 baths 3 beds |
show details | |

|
#2
Maple Tree Pl
Williston, VT 05495
|
- sq. feet
|
- baths - beds |
show details | |

|
#3
Williston Rd
South Burlington, VT 05403
|
- sq. feet
|
- baths - beds |
show details | |

|
#4
Shelburne Rd # 309
South Burlington, VT 05403
|
- sq. feet
|
- baths - beds |
show details | |

|
#5
Jourdan St
Hinesburg, VT 05461
|
- sq. feet
|
- baths - beds |
show details | |

|
#6
Eastwood Dr Apt 206
South Burlington, VT 05403
|
- sq. feet
|
- baths - beds |
show details | |

|
#7
Avenue D Ste 10
Williston, VT 05495
|
- sq. feet
|
- baths - beds |
show details | |

|
#8
Pine St # 4
Bristol, VT 05443
|
- sq. feet
|
- baths - beds |
show details | |

|
#9
N Meadow Dr
Bristol, VT 05443
|
- sq. feet
|
- baths - beds |
show details | |

|
#10
Vt Route 116
Starksboro, VT 05487
|
- sq. feet
|
- baths - beds |
show details |
| Photo | Address | Area | Beds / Baths | Price | Details |
|---|---|---|---|---|---|

|
#11
Crossett Hl Unit 3
Waterbury, VT 05676
|
- sq. feet
|
- baths - beds |
show details | |

|
#12
Us Route 2
Waterbury, VT 05676
|
- sq. feet
|
- baths - beds |
show details | |

|
#13
Armory Ln Apt 201
Vergennes, VT 05491
|
- sq. feet
|
- baths - beds |
show details | |

|
#14
Winterbury Lane, Unit 202
Burlington, VT 05401
|
- sq. feet
|
- baths - beds |
show details | |

|
#15
Sunset Dr
Essex Junction, VT 05452
|
- sq. feet
|
- baths - beds |
show details | |

|
#16
Plank Rd
Vergennes, VT 05491
|
- sq. feet
|
- baths - beds |
show details | |

|
#17
Vt Route 15
Jericho, VT 05465
|
- sq. feet
|
- baths - beds |
show details | |

|
#18
Bayview St
Burlington, VT 05401
|
- sq. feet
|
- baths - beds |
show details | |

|
#19
S Maple St
Vergennes, VT 05491
|
- sq. feet
|
- baths - beds |
show details | |

|
#20
Lafountain St
Winooski, VT 05404
|
- sq. feet
|
- baths - beds |
show details |
| Photo | Address | Area | Beds / Baths | Price | Details |
|---|---|---|---|---|---|

|
#21
Ring Rd
Waterbury Center, VT 05677
|
- sq. feet
|
- baths - beds |
show details | |

|
#22
Briar Ln
Essex Junction, VT 05452
|
- sq. feet
|
- baths - beds |
show details | |

|
#23
Mountain View Blvd
South Burlington, VT 05403
|
- sq. feet
|
- baths - beds |
show details | |

|
#24
Henrys Way
Ferrisburg, VT 05456
|
- sq. feet
|
- baths - beds |
show details | |

|
#25
Elm St
Essex Junction, VT 05452
|
- sq. feet
|
- baths - beds |
show details | |

|
#26
Ridge Rd
Essex Junction, VT 05452
|
- sq. feet
|
- baths - beds |
show details | |

|
#27
Stonybrook Dr
Williston, VT 05495
|
- sq. feet
|
- baths - beds |
show details | |

|
#28
Eagles Rd
Waitsfield, VT 05673
|
- sq. feet
|
- baths - beds |
show details | |

|
#29
Duxfarm Ests
Waterbury, VT 05676
|
- sq. feet
|
- baths - beds |
show details | |

|
#30
Village Grv
Williston, VT 05495
|
- sq. feet
|
- baths - beds |
show details |
| Photo | Address | Area | Beds / Baths | Price | Details |
|---|---|---|---|---|---|

|
#31
Hardscrabble Rd
Bristol, VT 05443
|
- sq. feet
|
- baths - beds |
show details | |

|
#32
Stage Rd
Jericho, VT 05465
|
- sq. feet
|
- baths - beds |
show details | |

|
#33
Willowbrook Ln
Williston, VT 05495
|
- sq. feet
|
- baths - beds |
show details | |

|
#34
Esplanade
Richmond, VT 05477
|
- sq. feet
|
- baths - beds |
show details | |

|
#35
Colchester Rd
Essex Junction, VT 05452
|
- sq. feet
|
- baths - beds |
show details | |

|
Check over 1 million property listings on Foreclosure.com!
|
browse all offers | |||
Latest news about housing in Huntington, VT collected exclusively by city-data.com from local newspapers, TV, and radio stations

 | Builders, Real estate agents (3 replies) |
| Need Advice. May move to Burlington for a Job (9 replies) |
| Huntington? (2 replies) |
| Rethinking Vermont- Cost of Living? (46 replies) |
| Rural and affordable near Burlington? (5 replies) |
| Goat boarding - preferably near Huntington (6 replies) |

Household type by relationship:
Households: 146,750- In family households: 109,943 (24,793 male householders, 11,789 female householders)
28,660 spouses, 37,454 children (34,847 natural, 1,395 adopted, 1,212 stepchildren), 1,289 grandchildren, 800 brothers or sisters, 735 parents, foster children, 675 other relatives, 3,212 non-relatives
- In nonfamily households: 36,807 (11,423 male householders (7,248 living alone)), 13,822 female householders (9,861 living alone)), 11,562 nonrelatives
- In group quarters: 9,795 (1,163 institutionalized population)
25,754 married couples with children.
6,932 single-parent households (1,683 men, 5,249 women).
97.0% of residents of Huntington speak English at home.
0.7% of residents speak Spanish at home (46% speak English very well, 38% speak English well, 15% speak English not well).
1.8% of residents speak other Indo-European language at home (94% speak English very well, 6% speak English well).
0.5% of residents speak Asian or Pacific Island language at home (62% speak English very well, 38% speak English well).
Foreign born population: 32 (1.5%)
(62.5% of them are naturalized citizens)
| Here: | 5.2 |
| State: | 6.4 |
| Here: | 4.9 |
| State: | 3.9 |

- Bedrooms in owner-occupied houses and condos in Huntington, Vermont
- 2no bedroom
- 381 bedroom
- 1482 bedrooms
- 2993 bedrooms
- 964 bedrooms
- 325+ bedrooms

- Bedrooms in renter-occupied apartments in Huntington, Vermont
- 3no bedroom
- 271 bedroom
- 192 bedrooms
- 253 bedrooms
- 54 bedrooms
- 05+ bedrooms

- Cars and other vehicles available in Huntington in owner-occupied houses/condos
- 9no vehicle
- 1331 vehicle
- 3402 vehicles
- 1023 vehicles
- 294 vehicles
- 25+ vehicles

- Cars and other vehicles available in Huntington in renter-occupied apartments
- 0no vehicle
- 331 vehicle
- 412 vehicles
- 53 vehicles
- 04 vehicles
- 05+ vehicles

- Rooms in owner-occupied houses in Huntington, Vermont
- 21 room
- 62 rooms
- 183 rooms
- 904 rooms
- 1525 rooms
- 1246 rooms
- 1067 rooms
- 508 rooms
- 679+ rooms

- Rooms in renter-occupied apartments in Huntington, Vermont
- 31 room
- 62 rooms
- 193 rooms
- 144 rooms
- 135 rooms
- 116 rooms
- 77 rooms
- 38 rooms
- 39+ rooms


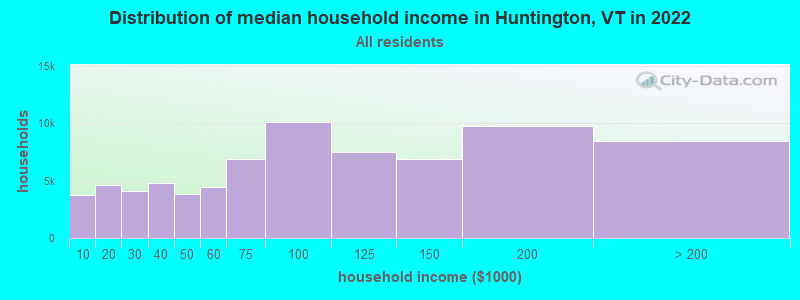
Huntington, VT household income distribution

- 3,714Less than $10,000
- 4,598$10,000 to $19,999
- 4,125$20,000 to $29,999
- 4,761$30,000 to $39,999
- 3,855$40,000 to $49,999
- 4,460$50,000 to $59,999
- 6,903$60,000 to $74,999
- 10,102$75,000 to $99,999
- 7,461$100,000 to $124,999
- 6,841$125,000 to $149,999
- 9,714$150,000 to $199,999
- 8,425$200,000 or more
Percentage of workers working in this county: 87.9%
Number of people working at home: 218 (16.8% of all workers)
Travel time to work (commute)
- Less than 5 minutes: 19
- 5 to 9 minutes: 38
- 10 to 14 minutes: 37
- 15 to 19 minutes: 27
- 20 to 24 minutes: 120
- 25 to 29 minutes: 101
- 30 to 34 minutes: 293
- 35 to 39 minutes: 75
- 40 to 44 minutes: 103
- 45 to 59 minutes: 115
- 60 to 89 minutes: 38
- 90 or more minutes: 19
Means of transportation to work:
- Drove a car alone: 830 (78.5%)
- Carpooled: 130 (12.3%)
- Bus or trolley bus: 1 (0.1%)
- Bicycle: 7 (0.7%)
- Walked: 17 (1.6%)
- Worked at home: 72 (6.8%)


- Year of entry for the foreign-born population in Huntington, Vermont
- 11995 to March 2000
- 61990 to 1994
- 01985 to 1989
- 21980 to 1984
- 21975 to 1979
- 21970 to 1974
- 51965 to 1969
- 4Before 1965
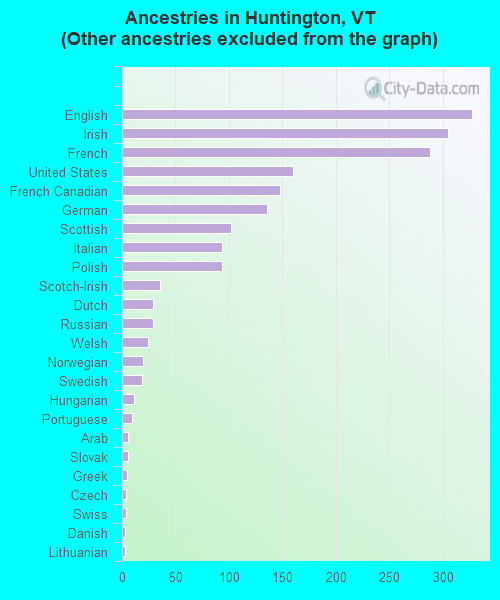
First ancestries reported:
- Other: 335 (15.2%)
- English: 327 (14.9%)
- Irish: 305 (13.9%)
- French: 288 (13.1%)
- United States: 160 (7.3%)
- French Canadian: 148 (6.7%)
- German: 136 (6.2%)
- Scottish: 102 (4.6%)
- Italian: 94 (4.3%)
- Polish: 94 (4.3%)
- Scotch-Irish: 36 (1.6%)
- Dutch: 29 (1.3%)
- Russian: 29 (1.3%)
- Welsh: 24 (1.1%)
- Norwegian: 20 (0.9%)
- Swedish: 19 (0.9%)
- Hungarian: 11 (0.5%)
- Portuguese: 9 (0.4%)
- Arab: 6 (0.3%)
- Slovak: 6 (0.3%)
- Greek: 5 (0.2%)
- Czech: 4 (0.2%)
- Swiss: 4 (0.2%)
- Danish: 3 (0.1%)
- Lithuanian: 3 (0.1%)
- Ukrainian: 2 (0.09%)
Most common places of birth for foreign-born residents (%):
| Huntington: | 27.3% (6) |
| Vermont: | 34.0% (7,912) |
| Huntington: | 18.2% (4) |
| Vermont: | 2.5% (585) |
| Huntington: | 9.1% (2) |
| Vermont: | 7.5% (1,744) |
| Huntington: | 9.1% (2) |
| Vermont: | 1.4% (318) |
| Huntington: | 9.1% (2) |
| Vermont: | 1.4% (335) |
| Huntington: | 9.1% (2) |
| Vermont: | 2.5% (588) |
| Huntington: | 9.1% (2) |
| Vermont: | 3.4% (796) |
Place of birth for U.S.-born residents:
- This state: 1,110
- Other state: 730
- Northeast: 507
- Midwest: 79
- South: 88
- West: 56
65% of Huntington residents lived in the same house 5 years ago.
Out of people who lived in different houses, 67% lived in this county.
Out of people who lived in different counties, 27% lived in Vermont.
Education attainment for males 25 years and older:
- No schooling: 2
- Nursery to 4th grade: 0
- 5th and 6th grade: 5
- 7th and 8th grade: 28
- 9th grade: 10
- 10th grade: 15
- 11th grade: 9
- 12th grade, no diploma: 12
- High school graduate (or equivalency): 183
- Less than 1 year of college: 32
- Some college more than 1 year, no degree: 73
- Associate degree: 45
- Bachelor's degree: 135
- Master's degree: 42
- Professional school degree: 13
- Doctorate degree: 23

Education attainment for females 25 years and older:
- No schooling: 0
- Nursery to 4th grade: 2
- 5th and 6th grade: 0
- 7th and 8th grade: 22
- 9th grade: 8
- 10th grade: 16
- 11th grade: 4
- 12th grade, no diploma: 4
- High school graduate (or equivalency): 176
- Less than 1 year of college: 38
- Some college more than 1 year, no degree: 50
- Associate degree: 66
- Bachelor's degree: 172
- Master's degree: 70
- Professional school degree: 7
- Doctorate degree: 4


Housing units in structures:
- One, detached: 583
- One, attached: 8
- Two: 22
- 3 or 4: 7
- 5 to 9: 2
- 10 to 19: 3
- Mobile homes: 121
Median worth of mobile homes: $104,230
Housing units lacking complete kitchen facilities: 3.4%

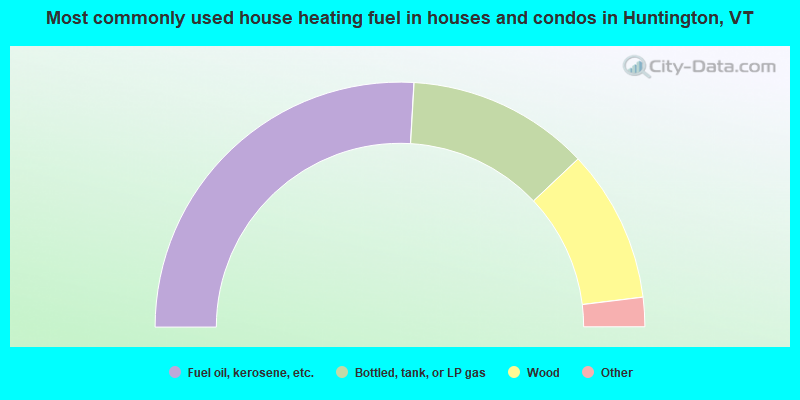
- 51.9%Fuel oil, kerosene, etc.
- 24.1%Bottled, tank, or LP gas
- 20.2%Wood
- 2.1%Utility gas
- 1.8%Electricity
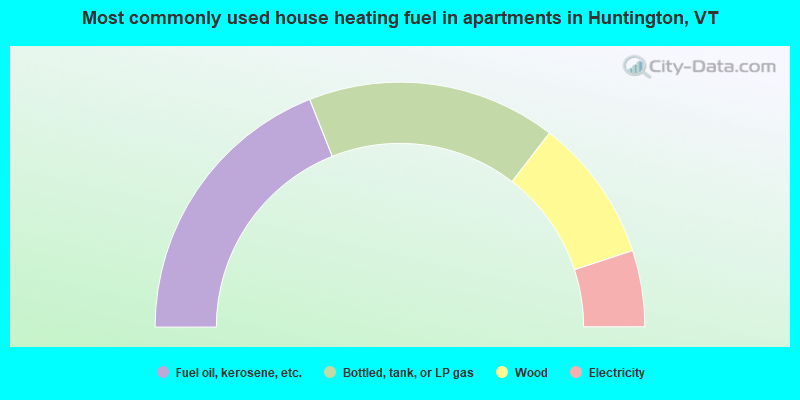
- 38.0%Fuel oil, kerosene, etc.
- 32.9%Bottled, tank, or LP gas
- 19.0%Wood
- 10.1%Electricity
Private vs. public school enrollment:
| Here: | 8.5% |
| Vermont: | 7.2% |
| Here: | 8.5% |
| Vermont: | 10.4% |
| Here: | 32.4% |
| Vermont: | 37.7% |


