Hurt, VA (Virginia) Houses and Residents
| Hurt: | $141,954 |
| Virginia: | $365,700 |
Mean price in 2022:
Detached houses: $185,891
Here: $185,891 State: $472,865 Townhouses or other attached units: $211,861
Here: $211,861 State: $457,437 Mobile homes: $12,975
Here: $12,975 State: $100,736
Total population: 1,281 (Urban population: 1,162 (all inside urban clusters), Rural population: 98 (all nonfarm))
Houses: 701 (639 occupied: 467 owner occupied, 178 renter occupied)
| % of renters here: | 28% |
| State: | 33% |
Housing density: 268 houses/condos per square mile
Median price asked for vacant for-sale houses and condos in 2022 in this county: $146,659.
Median contract rent in 2022: $555 (lower quartile is $439, upper quartile is $757)
Median rent asked for vacant for-rent units in 2022: $530
Median gross rent in Hurt, VA in 2022: $850
Housing units in Hurt with a mortgage: 238 (7 second mortgage, 0 home equity loan, 4 both second mortgage and home equity loan)
Houses without a mortgage: 17
Median household income for houses/condos with a mortgage: $60,591
Median household income for apartments without a mortgage: $41,850
Median monthly housing costs: $721
Compare current foreclosures near Hurt, VA:
| Photo | Address | Area | Beds / Baths | Price | Details |
|---|---|---|---|---|---|

|
#1
Roark Mill Rd
Hurt, VA 24563
|
1,856 sq. feet
|
2 baths 3 beds |
show details | |

|
#2
Shula Dr
Hurt, VA 24563
|
1,624 sq. feet
|
2 baths 3 beds |
show details | |

|
#3
Scott Jacobs Memorial Dr
Hurt, VA 24563
|
1,500 sq. feet
|
1 baths 3 beds |
show details | |

|
#4
Vista View Ln
Hurt, VA 24563
|
1,370 sq. feet
|
2 baths 3 beds |
show details | |

|
#5
Easome Rd
Hurt, VA 24563
|
2,447 sq. feet
|
3 baths 4 beds |
show details | |

|
#6
Picker Cir
Hurt, VA 24563
|
786 sq. feet
|
1 baths 2 beds |
show details | |

|
#7
Level Run Rd
Hurt, VA 24563
|
920 sq. feet
|
1 baths 3 beds |
show details | |

|
#8
Rockford School Rd
Hurt, VA 24563
|
1,008 sq. feet
|
1 baths 3 beds |
show details | |

|
#9
Vista View Ln
Hurt, VA 24563
|
1,800 sq. feet
|
2 baths 3 beds |
show details | |

|
#10
Grove St
Hurt, VA 24563
|
1,575 sq. feet
|
1 baths 3 beds |
show details |
| Photo | Address | Area | Beds / Baths | Price | Details |
|---|---|---|---|---|---|

|
#11
Grit Rd # 8
Hurt, VA 24563
|
- sq. feet
|
- baths - beds |
show details | |

|
#12
Roark Mill Rd
Hurt, VA 24563
|
- sq. feet
|
- baths - beds |
show details | |

|
#13
E Spencer Rd
Hurt, VA 24563
|
- sq. feet
|
- baths - beds |
show details | |

|
#14
Prospect Rd
Hurt, VA 24563
|
- sq. feet
|
- baths - beds |
show details | |

|
#15
Telegraph Rd
Hurt, VA 24563
|
- sq. feet
|
- baths - beds |
show details | |

|
#16
Dove Ln
Hurt, VA 24563
|
- sq. feet
|
- baths - beds |
show details | |

|
#17
Wards Rd
Hurt, VA 24563
|
- sq. feet
|
- baths - beds |
show details | |

|
#18
Wards Rd
Hurt, VA 24563
|
- sq. feet
|
- baths - beds |
show details | |

|
#19
Level Run Rd
Hurt, VA 24563
|
- sq. feet
|
- baths - beds |
show details | |

|
#20
Smith Mountain Lake Pkwy
Huddleston, VA 24104
|
1,672 sq. feet
|
1 baths 4 beds |
show details |
| Photo | Address | Area | Beds / Baths | Price | Details |
|---|---|---|---|---|---|

|
#21
Greenhouse Rd
Rustburg, VA 24588
|
1,377 sq. feet
|
2 baths 4 beds |
show details | |

|
#22
Glenwood Dr
Bedford, VA 24523
|
2,109 sq. feet
|
2 baths 2 beds |
show details | |

|
#23
Churchill Dr
Lynchburg, VA 24502
|
1,890 sq. feet
|
2 baths 3 beds |
show details | |

|
#24
Churchill Dr
Lynchburg, VA 24502
|
1,841 sq. feet
|
2 baths 3 beds |
show details | |

|
#25
Willow Oak Ter
Forest, VA 24551
|
1,558 sq. feet
|
2 baths 3 beds |
show details | |

|
#26
Masons Mill Rd
Evington, VA 24550
|
960 sq. feet
|
1 baths 3 beds |
show details | |

|
#27
Goat Island Rd
Gladys, VA 24554
|
1,680 sq. feet
|
1 baths 3 beds |
show details | |

|
#28
Level Run Rd
Long Island, VA 24569
|
1,256 sq. feet
|
1 baths 3 beds |
show details | |

|
#29
Brights Rd
Pittsville, VA 24139
|
2,128 sq. feet
|
2 baths 3 beds |
show details | |

|
#30
Missionary Mnr
Lynchburg, VA 24501
|
1,566 sq. feet
|
2 baths 3 beds |
show details |
| Photo | Address | Area | Beds / Baths | Price | Details |
|---|---|---|---|---|---|

|
#31
Sunnymeade Rd
Rustburg, VA 24588
|
1,721 sq. feet
|
2 baths 3 beds |
show details | |

|
#32
Crocetti Ln
Lynchburg, VA 24501
|
1,168 sq. feet
|
1 baths 2 beds |
show details | |

|
#33
Wards Rd
Rustburg, VA 24588
|
1,344 sq. feet
|
2 baths 3 beds |
show details | |

|
#34
Shannon Forest Dr
Rustburg, VA 24588
|
3,150 sq. feet
|
2 baths 5 beds |
show details | |

|
#35
Zion Rd
Gretna, VA 24557
|
1,296 sq. feet
|
2 baths 3 beds |
show details | |

|
#36
Collins Ferry Rd
Gladys, VA 24554
|
1,512 sq. feet
|
1 baths 3 beds |
show details | |

|
#37
Greendale Dr
Rustburg, VA 24588
|
1,118 sq. feet
|
1 baths 3 beds |
show details | |

|
#38
Cattle Ln
Evington, VA 24550
|
1,056 sq. feet
|
1 baths 3 beds |
show details | |

|
#39
Foxcrest Dr
Lynchburg, VA 24502
|
2,840 sq. feet
|
3 baths 3 beds |
show details | |

|
#40
Boxwood Rd
Gretna, VA 24557
|
2,052 sq. feet
|
2 baths 3 beds |
show details |
| Photo | Address | Area | Beds / Baths | Price | Details |
|---|---|---|---|---|---|

|
#41
Clarks Rd
Rustburg, VA 24588
|
1,200 sq. feet
|
1 baths 3 beds |
show details | |

|
#42
Greenhouse Rd
Rustburg, VA 24588
|
2,037 sq. feet
|
2 baths 3 beds |
show details | |

|
#43
Peerman School Rd
Altavista, VA 24517
|
816 sq. feet
|
1 baths 3 beds |
show details | |

|
#44
Lynbrook Rd
Rustburg, VA 24588
|
1,576 sq. feet
|
1 baths 3 beds |
show details | |

|
#45
Sunburst Rd
Evington, VA 24550
|
1,128 sq. feet
|
1 baths 2 beds |
show details | |

|
#46
Tanglewood Dr
Lynchburg, VA 24502
|
2,498 sq. feet
|
2 baths 4 beds |
show details | |

|
#47
Crestside Dr
Evington, VA 24550
|
929 sq. feet
|
1 baths 3 beds |
show details | |

|
#48
Cooper Way
Evington, VA 24550
|
2,580 sq. feet
|
2 baths 4 beds |
show details | |

|
#49
Winston Ln
Altavista, VA 24517
|
1,183 sq. feet
|
2 baths 2 beds |
show details | |

|
Check over 1 million property listings on Foreclosure.com!
|
browse all offers | |||

Latest news about housing in Hurt, VA collected exclusively by city-data.com from local newspapers, TV, and radio stations

 | Trying to move out marriage issues: (2 replies) |
| An updated perspective on neighborhoods of Roanoke City (6 replies) |
| Please Dont Move to Roanoke!! War In Innercity! (69 replies) |
| Is Roanoke divided into racial sections? (13 replies) |
| Advice on elementary schools/neighborhoods North Albemarle (4 replies) |
| First chance of snow this Sunday (44 replies) |

Median year apartment built: 1957
Household type by relationship:
Households: 1,387- Male householders: 273 (70 living alone), Female householders: 359 (153 living alone)
274 spouses (274 opposite-sex spouses), 15 unmarried partners, (15 opposite-sex unmarried partners), 288 children (276 natural, 0 adopted, 12 stepchildren), 11 grandchildren, 10 brothers or sisters, 58 parents, 0 foster children, 44 other relatives, 51 non-relatives
Size of family households: 229 2-persons, 72 3-persons, 66 4-persons, 9 5-persons.
Size of nonfamily households: 229 1-person, 26 2-persons, 12 4-persons.
129 married couples with children.
78 single-parent households (5 men, 73 women).
96.6% of residents of Hurt speak English at home.
3.3% of residents speak Spanish at home (7% speak English very well, 70% speak English well, 23% speak English not well).
0.2% of residents speak other language at home (100% speak English well).
Foreign born population: 23 (1.7%)
(52.2% of them are naturalized citizens)
| Here: | 6.0 |
| State: | 7.0 |
| Here: | 5.1 |
| State: | 4.3 |

- Bedrooms in owner-occupied houses and condos in Hurt, Virginia
- 0no bedroom
- 81 bedroom
- 1292 bedrooms
- 2813 bedrooms
- 434 bedrooms
- 65+ bedrooms

- Bedrooms in renter-occupied apartments in Hurt, Virginia
- 5no bedroom
- 111 bedroom
- 452 bedrooms
- 1033 bedrooms
- 144 bedrooms
- 05+ bedrooms

- Cars and other vehicles available in Hurt in owner-occupied houses/condos
- 26no vehicle
- 1411 vehicle
- 1102 vehicles
- 883 vehicles
- 794 vehicles
- 245+ vehicles

- Cars and other vehicles available in Hurt in renter-occupied apartments
- 23no vehicle
- 691 vehicle
- 472 vehicles
- 153 vehicles
- 254 vehicles
- 05+ vehicles

- Rooms in owner-occupied houses in Hurt, Virginia
- 01 room
- 02 rooms
- 313 rooms
- 414 rooms
- 965 rooms
- 1436 rooms
- 697 rooms
- 538 rooms
- 359+ rooms

- Rooms in renter-occupied apartments in Hurt, Virginia
- 31 room
- 02 rooms
- 53 rooms
- 284 rooms
- 785 rooms
- 326 rooms
- 267 rooms
- 48 rooms
- 39+ rooms


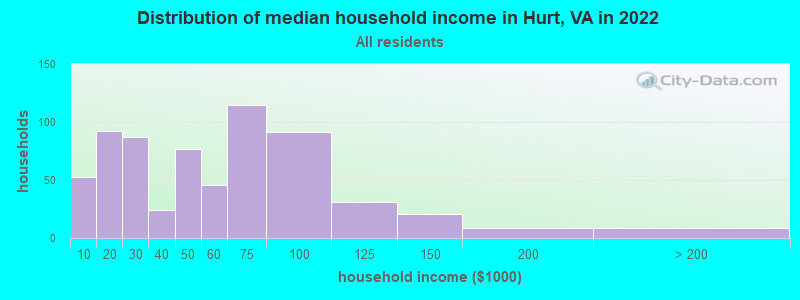
Hurt, VA household income distribution

- 53Less than $10,000
- 92$10,000 to $19,999
- 87$20,000 to $29,999
- 24$30,000 to $39,999
- 77$40,000 to $49,999
- 46$50,000 to $59,999
- 115$60,000 to $74,999
- 91$75,000 to $99,999
- 31$100,000 to $124,999
- 21$125,000 to $149,999
- 9$150,000 to $199,999
- 9$200,000 or more
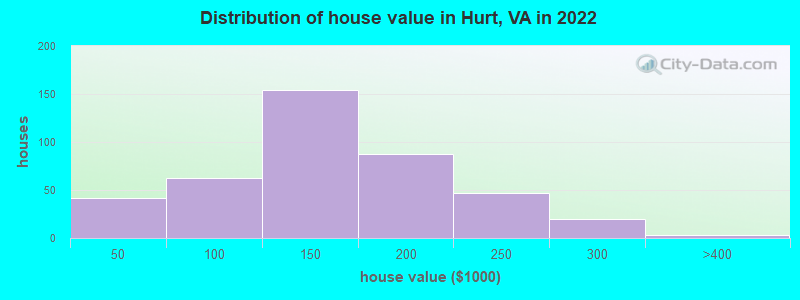
Home value of owner - occupied houses in 2022 in Hurt, VA
-
- 38Less than $10,000
- 3$20,000 to $24,999
- 27$60,000 to $69,999
- 18$80,000 to $89,999
- 16$90,000 to $99,999
- 99$100,000 to $124,999
- 54$125,000 to $149,999
- 73$150,000 to $174,999
- 13$175,000 to $199,999
- 46$200,000 to $249,999
- 20$250,000 to $299,999
- 3$300,000 to $399,999
Rent paid by renters in 2022 in Hurt, VA
-
- 16$150 to $199
- 13$250 to $299
- 1$300 to $349
- 10$400 to $449
- 13$450 to $499
- 32$500 to $549
- 4$550 to $599
- 14$600 to $649
- 19$650 to $699
- 4$750 to $799
- 17$800 to $899
- 10$900 to $999
- 6$1,000 to $1,249
- 3$1,250 to $1,499
- 3No cash rent

Percentage of workers working in this county: 32.2%
Number of people working at home: 39 (7.2% of all workers)
Travel time to work (commute)
- Less than 5 minutes: 13
- 5 to 9 minutes: 74
- 10 to 14 minutes: 90
- 15 to 19 minutes: 54
- 20 to 24 minutes: 35
- 25 to 29 minutes: 22
- 30 to 34 minutes: 27
- 35 to 39 minutes: 15
- 40 to 44 minutes: 16
- 45 to 59 minutes: 111
- 60 to 89 minutes: 13
- 90 or more minutes: 6
Means of transportation to work:
- Drove a car alone: 522 (84.2%)
- Carpooled: 61 (9.8%)
- Bus or trolley bus: 5 (0.8%)
- Walked: 6 (1.0%)
- Other means: 5 (0.8%)
- Worked at home: 21 (3.4%)
- Unemployment by race in 2022
- Unemployment rate for White non-Hispanic residents
- 10.6%Males

- Year of entry for the foreign-born population in Hurt, Virginia
- 02010 or later
- 142000 to 2009
- 91990 to 1999
- 31980 to 1989
- 31970 to 1979
- 4Before 1970

First ancestries reported:
- American: 309 (35.3%)
- English: 139 (15.9%)
- Irish: 91 (10.4%)
- German: 28 (3.2%)
- African: 19 (2.2%)
- Scotch-Irish: 11 (1.3%)
- Italian: 8 (0.9%)
- French: 7 (0.8%)
- European: 6 (0.7%)
- Swedish: 6 (0.7%)
- Scottish: 3 (0.3%)
- Dutch: 2 (0.2%)
- Hungarian: 2 (0.2%)
Most common places of birth for foreign-born residents (%):
| Hurt: | 78.3% (18) |
| Virginia: | 5.3% (57,498) |
| Hurt: | 4.3% (1) |
| Virginia: | 0.1% (1,168) |
Place of birth for U.S.-born residents:
- This state: 1,125
- Other state: 229
- Northeast: 58
- Midwest: 23
- South: 127
- West: 19
86.4% of Hurt residents lived in the same house 1 years ago.
Out of people who lived in different houses, 19.3% lived in this county.
Out of people who lived in different counties, 83.0% lived in Virginia.
| Hurt: | 86.4% |
| State average: | 86.6% |
Education attainment for males 25 years and older:
- No schooling: 9
- Nursery to 4th grade: 0
- 5th and 6th grade: 9
- 7th and 8th grade: 11
- 9th grade: 11
- 10th grade: 42
- 11th grade: 2
- 12th grade, no diploma: 4
- High school graduate (or equivalency): 204
- Less than 1 year of college: 39
- Some college more than 1 year, no degree: 37
- Associate degree: 37
- Bachelor's degree: 52
- Master's degree: 0
- Professional school degree: 0
- Doctorate degree: 11

Education attainment for females 25 years and older:
- No schooling: 6
- Nursery to 4th grade: 0
- 5th and 6th grade: 18
- 7th and 8th grade: 0
- 9th grade: 7
- 10th grade: 38
- 11th grade: 0
- 12th grade, no diploma: 6
- High school graduate (or equivalency): 215
- Less than 1 year of college: 38
- Some college more than 1 year, no degree: 74
- Associate degree: 79
- Bachelor's degree: 52
- Master's degree: 47
- Professional school degree: 8
- Doctorate degree: 3


Housing units in structures:
- One, detached: 597
- One, attached: 15
- Two: 13
- 3 or 4: 6
- 5 to 9: 3
- Mobile homes: 66
Median worth of mobile homes: $11,233
Housing units lacking complete kitchen facilities in 2022: 4.1%
House/condo owner moved in on average 18 years ago
Renter moved in on average 4 years ago

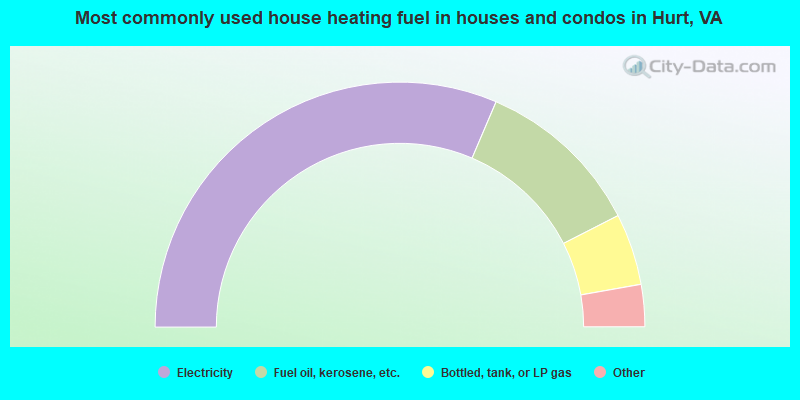
- 63.1%Electricity
- 22.2%Fuel oil, kerosene, etc.
- 9.5%Bottled, tank, or LP gas
- 3.1%Utility gas
- 0.9%Wood
- 0.7%Other fuel
- 0.7%No fuel used
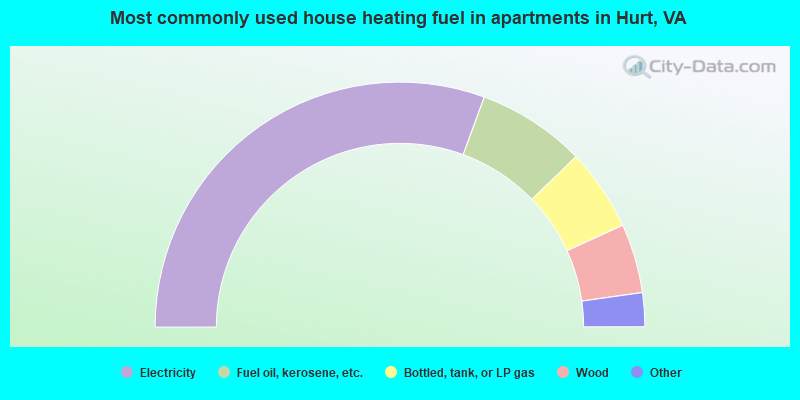
- 61.5%Electricity
- 14.4%Fuel oil, kerosene, etc.
- 10.9%Bottled, tank, or LP gas
- 9.2%Wood
- 2.3%Utility gas
- 1.7%No fuel used
Private vs. public school enrollment:
| Here: | 0.0% |
| Virginia: | 13.2% |
| Here: | 0.0% |
| Virginia: | 10.2% |
| Here: | 83.3% |
| Virginia: | 18.7% |


