Hybla Valley, VA (Virginia) Houses and Residents
Estimated median house or condo value in 2022: $481,536 (it was $169,000 in 2000 )
Hybla Valley:
$481,536Virginia:
$365,700
Lower value quartile - upper value quartile: $-701,819,685 - $728,347Mean price in 2022: Detached houses: $704,409 Here:
$704,409State:
$472,865
Townhouses or other attached units: $503,436 Here:
$503,436State:
$457,437
In 5-or-more-unit structures: $299,080 Here:
$299,080State:
$382,551
Mobile homes: $34,072 Here:
$34,072State:
$100,736
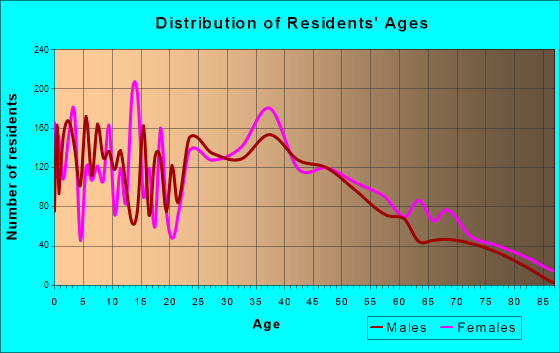
Total population: 15,801 (All urban)
Houses: 5,995 (5,789 occupied: 2,461 owner occupied, 3,359 renter occupied )
% of renters here:
58%State:
33%
Housing density: 1,965 houses/condos per square mile
Median price asked for vacant for-sale houses and condos in 2022 in this county: $1,038,941.
Median contract rent in 2022: $1,514 (lower quartile is $1,044, upper quartile is $1,834)
Median rent asked for vacant for-rent units in 2022: $1,723
Median gross rent in Hybla Valley, VA in 2022: $1,608
Housing units in Hybla Valley with a mortgage: 1,601 (150 second mortgage, 14 home equity loan, 110 both second mortgage and home equity loan )Houses without a mortgage: 0
Median household income for houses/condos with a mortgage: $165,757
Median household income for apartments without a mortgage: $78,572
Median monthly housing costs: $1,631
Data:
Median house or condo value ($)
Median house or condo value ($ change since 2000)
Median house or condo value ($) - White
Median house or condo value ($) - Black or African American
Median house or condo value ($) - Asian
Median house or condo value ($) - Hispanic or Latino
Median house or condo value ($) - American Indian and Alaska Native
Median house or condo value ($) - Multirace
Median house or condo value ($) - Other Race
Median price asked for mobile homes ($)
Household density (households per square mile)
Mean house or condo value by units in structure - 1, detached ($)
Mean house or condo value by units in structure - 1, attached ($)
Mean house or condo value by units in structure - 2 ($)
Mean house or condo value by units in structure by units in structure - 3 or 4 ($)
Mean house or condo value by units in structure - 5 or more ($)
Mean house or condo value by units in structure - Boat, RV, van, etc. ($)
Mean house or condo value by units in structure - Mobile home ($)
Median contract rent ($)
Median contract rent - Lower quartile ($)
Median contract rent - Upper quartile ($)
Median gross rent ($)
Urban houses (%)
Rural houses (%)
Houses occupied (%)
Houses occupied (% change since 2000)
Houses owner occupied (%)
Houses owner occupied (% change since 2000)
Houses renter occupied (%)
Houses renter occupied (% change since 2000)
Vacant housing units - For rent (%)
Vacant housing units - For rent (% change since 2000)
Vacant housing units - For sale only (%)
Vacant housing units - For sale only (% change since 2000)
Vacant housing units - Rented or sold, not occupied (%)
Vacant housing units - Rented or sold, not occupied (% change since 2000)
Vacant housing units - For seasonal, recreational, or occasional use (%)
Vacant housing units - For seasonal, recreational, or occasional use (% change since 2000)
Vacant housing units - For migrant workers (%)
Vacant housing units - For migrant workers (% change since 2000)
Vacant housing units - Other vacant (%)
Vacant housing units - Other vacant (% change since 2000)
Median monthly housing costs ($)
Median household income for houses/condos with a mortgage ($)
Median household income for houses/condos without a mortgage ($)
Median household income ($)
Median household income ($) - White
Median household income ($) - Black or African American
Median household income ($) - Asian
Median household income ($) - Hispanic or Latino
Median household income ($) - American Indian and Alaska Native
Median household income ($) - Multirace
Median household income ($) - Other Race
Mortgage status - with mortgage (%)
Mortgage status - with second mortgage (%)
Mortgage status - with home equity loan (%)
Mortgage status - with both second mortgage and home equity loan (%)
Mortgage status - without a mortgage (%)
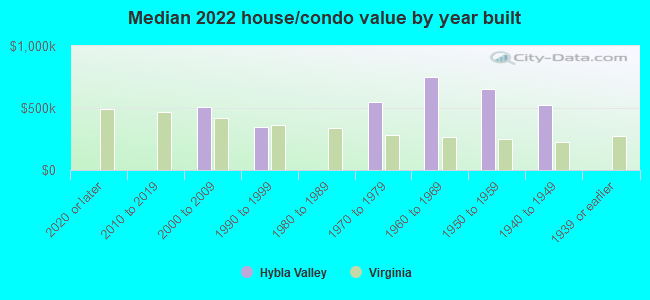
Median year house/condo built
Median year apartment built
Household type by relationship - Male householder living alone (%)
Household type by relationship - Male householder not living alone (%)
Household type by relationship - Female householder living alone (%)
Household type by relationship - Female householder not living alone (%)
Household type by relationship - Opposite-Sex spouse (%)
Household type by relationship - Same-Sex spouse (%)
Household type by relationship - Opposite-Sex unmarried partner (%)
Household type by relationship - Same-Sex unmarried partner (%)
Household type by relationship - In group quarters (%)
Size of family households - 2-person household (%)
Size of family households - 3-person household (%)
Size of family households - 4-person household (%)
Size of family households - 5-person household (%)
Size of family households - 6-person household (%)
Size of family households - 7-or-more-person household (%)
Size of nonfamily households - 1-person household (%)
Size of nonfamily households - 2-person household (%)
Size of nonfamily households - 3-person household (%)
Size of nonfamily households - 4-person household (%)
Size of nonfamily households - 5-person household (%)
Size of nonfamily households - 6-person household (%)
Size of nonfamily households - 7-or-moreperson household (%)
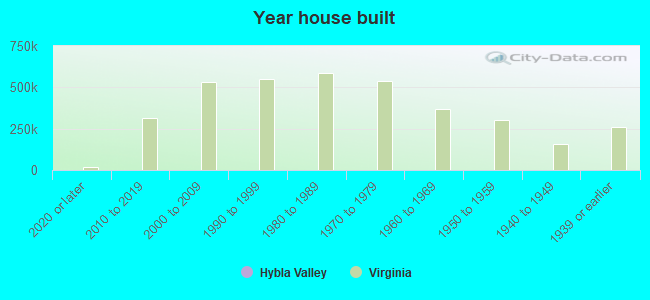
Year house built - Built 2010 or later (%)
Year house built - Built 2000 to 2009 (%)
Year house built - Built 1990 to 1999 (%)
Year house built - Built 1980 to 1989 (%)
Year house built - Built 1970 to 1979 (%)
Year house built - Built 1960 to 1969 (%)
Year house built - Built 1950 to 1959 (%)
Year house built - Built 1940 to 1949 (%)
Year house built - Built 1939 or earlier (%)
Median number of rooms in houses and condos
Median number of rooms in apartments
Median number of bedrooms in owner occupied houses
Mean number of bedrooms in owner occupied houses
Median number of bedrooms in renter occupied houses
Mean number of bedrooms in renter occupied houses
Median number of vehichles in owner occupied houses
Mean number of vehichles in owner occupied houses
Median number of vehichles in renter occupied houses
Mean number of vehichles in renter occupied houses
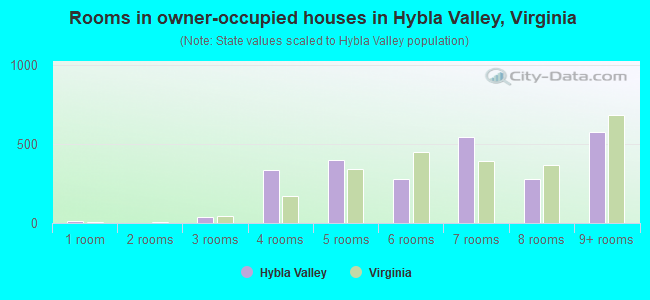
Rooms in owner-occupied houses - 1 room (%)
Rooms in owner-occupied houses - 2 rooms (%)
Rooms in owner-occupied houses - 3 rooms (%)
Rooms in owner-occupied houses - 4 rooms (%)
Rooms in owner-occupied houses - 5 rooms (%)
Rooms in owner-occupied houses - 6 rooms (%)
Rooms in owner-occupied houses - 7 rooms (%)
Rooms in owner-occupied houses - 8 rooms (%)
Rooms in owner-occupied houses - 9+ rooms (%)
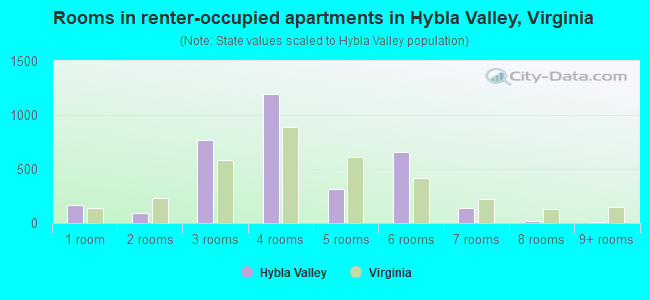
Rooms in renter-occupied houses - 1 room (%)
Rooms in renter-occupied houses - 2 rooms (%)
Rooms in renter-occupied houses - 3 rooms (%)
Rooms in renter-occupied houses - 4 rooms (%)
Rooms in renter-occupied houses - 5 rooms (%)
Rooms in renter-occupied houses - 6 rooms (%)
Rooms in renter-occupied houses - 7 rooms (%)
Rooms in renter-occupied houses - 8 rooms (%)
Rooms in renter-occupied houses - 9+ rooms (%)
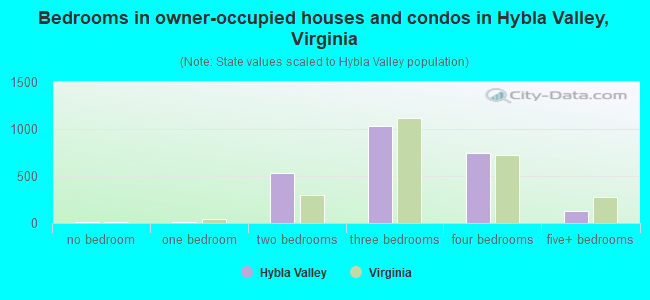
Bedrooms in owner-occupied houses - no bedrooms (%)
Bedrooms in owner-occupied houses - 1 bedroom (%)
Bedrooms in owner-occupied houses - 2 bedrooms (%)
Bedrooms in owner-occupied houses - 3 bedrooms (%)
Bedrooms in owner-occupied houses - 4 bedrooms (%)
Bedrooms in owner-occupied houses - 5+ bedrooms (%)
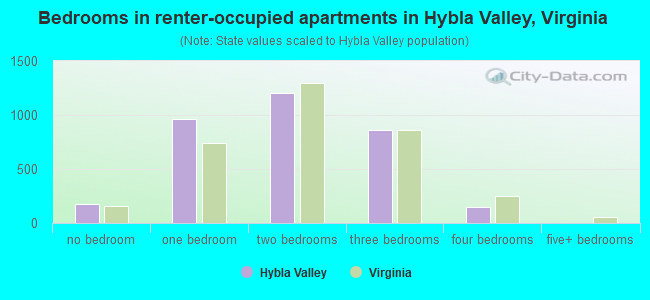
Bedrooms in renter-occupied houses - no bedrooms (%)
Bedrooms in renter-occupied houses - 1 bedroom (%)
Bedrooms in renter-occupied houses - 2 bedrooms (%)
Bedrooms in renter-occupied houses - 3 bedrooms (%)
Bedrooms in renter-occupied houses - 4 bedrooms (%)
Bedrooms in renter-occupied houses - 5+ bedrooms (%)
Vehicles available in owner-occupied houses - no vehicle available (%)
Vehicles available in owner-occupied houses - 1 vehicle available(%)
Vehicles available in owner-occupied houses - 2 Vehicles available (%)
Vehicles available in owner-occupied houses - 3 Vehicles available (%)
Vehicles available in owner-occupied houses - 4 Vehicles available (%)
Vehicles available in owner-occupied houses - 5+ Vehicles available (%)
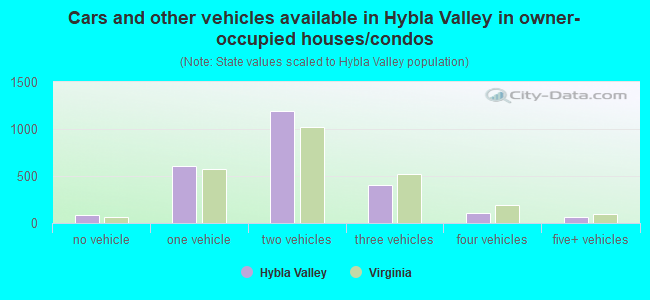
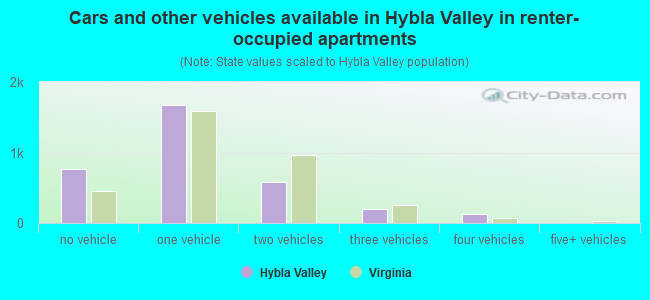
Vehicles available in renter-occupied houses - no vehicle available (%)
Vehicles available in renter-occupied houses - 1 vehicle available (%)
Vehicles available in renter-occupied houses - 2 Vehicles available (%)
Vehicles available in renter-occupied houses - 3 Vehicles available (%)
Vehicles available in renter-occupied houses - 4 Vehicles available (%)
Vehicles available in renter-occupied houses - 5+ Vehicles available (%)
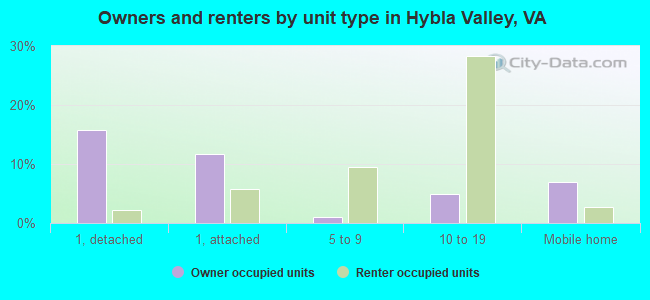
Housing units in structures - 1, detached (%)
Housing units in structures - 1, attached (%)
Housing units in structures - 2 (%)
Housing units in structures - 3 or 4 (%)
Housing units in structures - 5 to 9 (%)
Housing units in structures - 10 to 19 (%)
Housing units in structures - 20 to 49 (%)
Housing units in structures - 50 or more (%)
Housing units in structures - Mobile home (%)
Housing units in structures - Boat, RV, van, etc. (%)
Housing units in structures - Owners - 1, detached (%)
Housing units in structures - Owners - 1, attached (%)
Housing units in structures - Owners - 2 (%)
Housing units in structures - Owners - 3 or 4 (%)
Housing units in structures - Owners - 5 to 9 (%)
Housing units in structures - Owners - 10 to 19 (%)
Housing units in structures - Owners - 20 to 49 (%)
Housing units in structures - Owners - 50 or more (%)
Housing units in structures - Owners - Mobile home (%)
Housing units in structures - Owners - Boat, RV, van, etc. (%)
Housing units in structures - Renters - 1, detached (%)
Housing units in structures - Renters - 1, attached (%)
Housing units in structures - Renters - 2 (%)
Housing units in structures - Renters - 3 or 4 (%)
Housing units in structures - Renters - 5 to 9 (%)
Housing units in structures - Renters - 10 to 19 (%)
Housing units in structures - Renters - 20 to 49 (%)
Housing units in structures - Renters - 50 or more (%)
Housing units in structures - Renters - Mobile home (%)
Housing units in structures - Renters - Boat, RV, van, etc. (%)
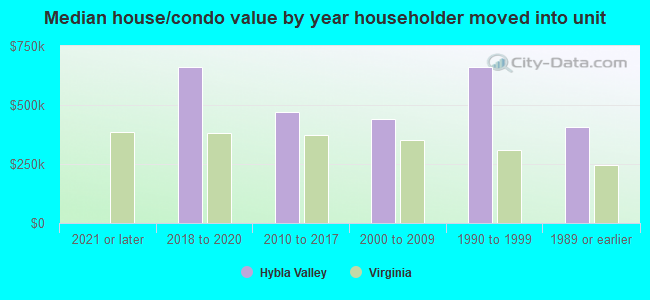
House/condo owner moved in on average (years ago)
Renter moved in on average (years ago)
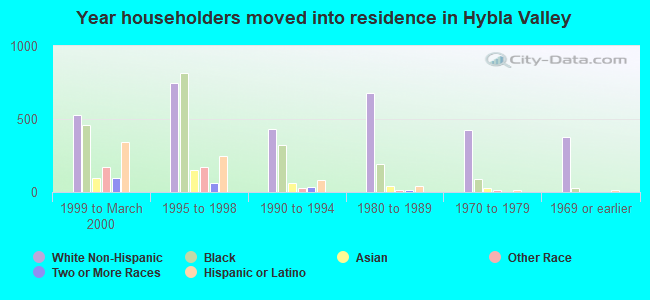
Year householder moved into unit - Moved in 1999 to March 2000 (%)
Year householder moved into unit - Moved in 1999 to March 2000 (%) - White
Year householder moved into unit - Moved in 1999 to March 2000 (%) - Black or African American
Year householder moved into unit - Moved in 1999 to March 2000 (%) - Asian
Year householder moved into unit - Moved in 1999 to March 2000 (%) - Hispanic or Latino
Year householder moved into unit - Moved in 1999 to March 2000 (%) - American Indian and Alaska Native
Year householder moved into unit - Moved in 1999 to March 2000 (%) - Multirace
Year householder moved into unit - Moved in 1999 to March 2000 (%) - Other Race
Year householder moved into unit - Moved in 1995 to 1998 (%)
Year householder moved into unit - Moved in 1995 to 1998 (%) - White
Year householder moved into unit - Moved in 1995 to 1998 (%) - Black or African American
Year householder moved into unit - Moved in 1995 to 1998 (%) - Asian
Year householder moved into unit - Moved in 1995 to 1998 (%) - Hispanic or Latino
Year householder moved into unit - Moved in 1995 to 1998 (%) - American Indian and Alaska Native
Year householder moved into unit - Moved in 1995 to 1998 (%) - Multirace
Year householder moved into unit - Moved in 1995 to 1998 (%) - Other Race
Year householder moved into unit - Moved in 1990 to 1994 (%)
Year householder moved into unit - Moved in 1990 to 1994 (%) - White
Year householder moved into unit - Moved in 1990 to 1994 (%) - Black or African American
Year householder moved into unit - Moved in 1990 to 1994 (%) - Asian
Year householder moved into unit - Moved in 1990 to 1994 (%) - Hispanic or Latino
Year householder moved into unit - Moved in 1990 to 1994 (%) - American Indian and Alaska Native
Year householder moved into unit - Moved in 1990 to 1994 (%) - Multirace
Year householder moved into unit - Moved in 1990 to 1994 (%) - Other Race
Year householder moved into unit - Moved in 1980 to 1989 (%)
Year householder moved into unit - Moved in 1980 to 1989 (%) - White
Year householder moved into unit - Moved in 1980 to 1989 (%) - Black or African American
Year householder moved into unit - Moved in 1980 to 1989 (%) - Asian
Year householder moved into unit - Moved in 1980 to 1989 (%) - Hispanic or Latino
Year householder moved into unit - Moved in 1980 to 1989 (%) - American Indian and Alaska Native
Year householder moved into unit - Moved in 1980 to 1989 (%) - Multirace
Year householder moved into unit - Moved in 1980 to 1989 (%) - Other Race
Year householder moved into unit - Moved in 1970 to 1979 (%)
Year householder moved into unit - Moved in 1970 to 1979 (%) - White
Year householder moved into unit - Moved in 1970 to 1979 (%) - Black or African American
Year householder moved into unit - Moved in 1970 to 1979 (%) - Asian
Year householder moved into unit - Moved in 1970 to 1979 (%) - Hispanic or Latino
Year householder moved into unit - Moved in 1970 to 1979 (%) - American Indian and Alaska Native
Year householder moved into unit - Moved in 1970 to 1979 (%) - Multirace
Year householder moved into unit - Moved in 1970 to 1979 (%) - Other Race
Year householder moved into unit - Moved in 1969 or earlier (%)
Year householder moved into unit - Moved in 1969 or earlier (%) - White
Year householder moved into unit - Moved in 1969 or earlier (%) - Black or African American
Year householder moved into unit - Moved in 1969 or earlier (%) - Asian
Year householder moved into unit - Moved in 1969 or earlier (%) - Hispanic or Latino
Year householder moved into unit - Moved in 1969 or earlier (%) - American Indian and Alaska Native
Year householder moved into unit - Moved in 1969 or earlier (%) - Multirace
Year householder moved into unit - Moved in 1969 or earlier (%) - Other Race
Housing units lacking complete plumbing facilities (%)
Housing units lacking complete kitchen facilities (%)
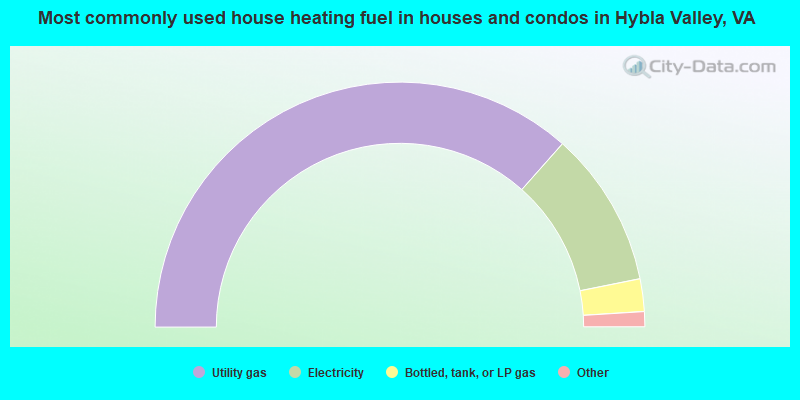
House heating fuel used in houses and condos - Utility gas (%)
House heating fuel used in houses and condos - Bottled, tank, or LP gas (%)
House heating fuel used in houses and condos - Electricity (%)
House heating fuel used in houses and condos - Fuel oil, kerosene, etc. (%)
House heating fuel used in houses and condos - Coal or coke (%)
House heating fuel used in houses and condos - Wood (%)
House heating fuel used in houses and condos - Solar energy (%)
House heating fuel used in houses and condos - Other fuel (%)
House heating fuel used in houses and condos - No fuel used (%)
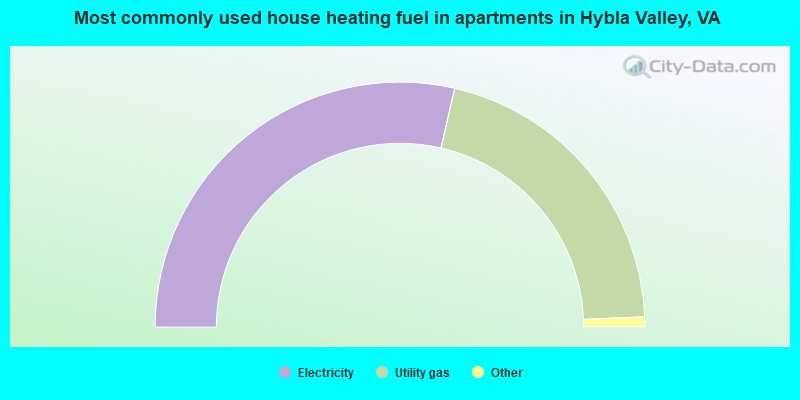
House heating fuel used in apartments - Utility gas (%)
House heating fuel used in apartments - Bottled, tank, or LP gas (%)
House heating fuel used in apartments - Electricity (%)
House heating fuel used in apartments - Fuel oil, kerosene, etc. (%)
House heating fuel used in apartments - Coal or coke (%)
House heating fuel used in apartments - Wood (%)
House heating fuel used in apartments - Solar energy (%)
House heating fuel used in apartments - Other fuel (%)
House heating fuel used in apartments - No fuel used (%)
Median year house/condo built: 1992Median year apartment built: 1972Household type by relationship:
Households: 17,992
Male householders: 2,543 (376 living alone ), Female householders: 3,172 (1,052 living alone )2,912 spouses (2,890 opposite-sex spouses ), 189 unmarried partners , (178 opposite-sex unmarried partners ), 6,609 children (6,499 natural , 20 adopted , 88 stepchildren ), 207 grandchildren , 297 brothers or sisters , 357 parents , 14 foster children , 1,074 other relatives , 389 non-relatives In group quarters: 224
Size of family households: 1,462 2-persons , 778 3-persons , 1,078 4-persons , 589 5-persons , 115 6-persons , 110 7-or-more-persons .
Size of nonfamily households: 1,474 1-person , 175 2-persons , 23 3-persons .
2,387 married couples with children. single-parent households (612 men , 1,701 women ).
47.7% of residents of Hybla Valley speak English at home. of residents speak Spanish at home (46% speak English very well , 18% speak English well , 18% speak English not well , 17% don't speak English at all ).of residents speak other Indo-European language at home (59% speak English very well , 32% speak English well , 5% speak English not well , 3% don't speak English at all ).of residents speak Asian or Pacific Island language at home (51% speak English very well , 32% speak English well , 15% speak English not well , 3% don't speak English at all ).of residents speak other language at home (72% speak English very well , 24% speak English well , 4% speak English not well ).
Foreign born population: 6,593 (36.6%)of them are naturalized citizens )
Median number of rooms in houses and condos:
Median number of rooms in apartments
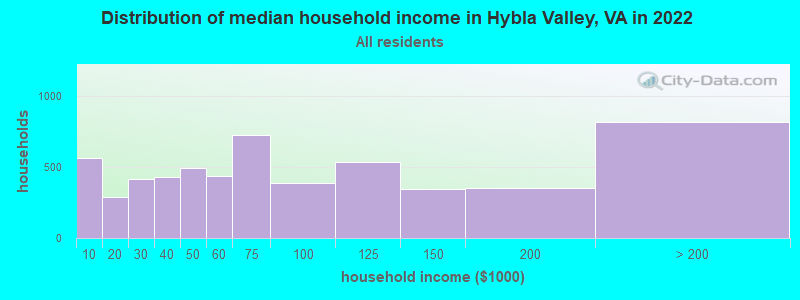
Hybla Valley, VA household income distribution 566 Less than $10,000286 $10,000 to $19,999417 $20,000 to $29,999434 $30,000 to $39,999494 $40,000 to $49,999436 $50,000 to $59,999730 $60,000 to $74,999390 $75,000 to $99,999534 $100,000 to $124,999345 $125,000 to $149,999354 $150,000 to $199,999819 $200,000 or more
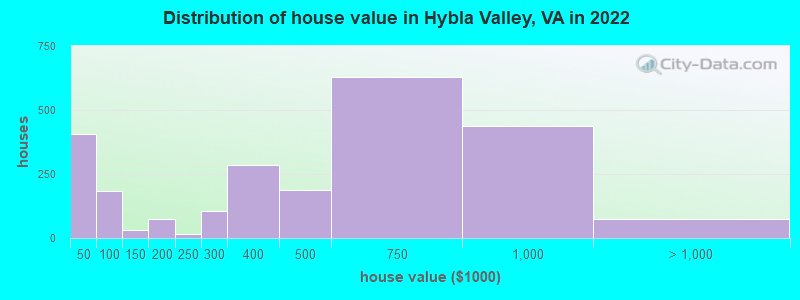
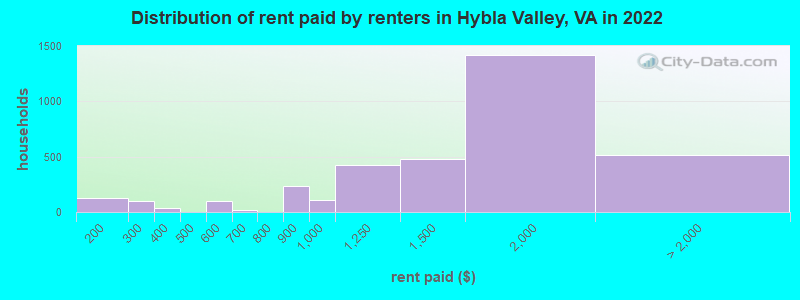
Home value of owner - occupied houses in 2022 in Hybla Valley, VA 67 Less than $10,00079 $10,000 to $14,99955 $15,000 to $19,999120 $20,000 to $24,99918 $25,000 to $29,99927 $30,000 to $34,99913 $35,000 to $39,99925 $40,000 to $49,99914 $50,000 to $59,999136 $60,000 to $69,9999 $80,000 to $89,99931 $100,000 to $124,99940 $150,000 to $174,99933 $175,000 to $199,99915 $200,000 to $249,999103 $250,000 to $299,999286 $300,000 to $399,999188 $400,000 to $499,999629 $500,000 to $749,999439 $750,000 to $999,99973 $1,000,000 to $1,499,999Rent paid by renters in 2022 in Hybla Valley, VA 69 $100 to $14956 $150 to $19999 $200 to $24939 $350 to $39998 $550 to $59915 $600 to $649234 $800 to $899110 $900 to $999429 $1,000 to $1,249481 $1,250 to $1,4991,417 $1,500 to $1,999248 $2,000 to $2,49966 $2,500 to $2,99933 $3,000 to $3,49921 $3,500 or more145 No cash rent
Percentage of workers working in this county: 48.2%Number of people working at home: 751 (9.1% of all workers )
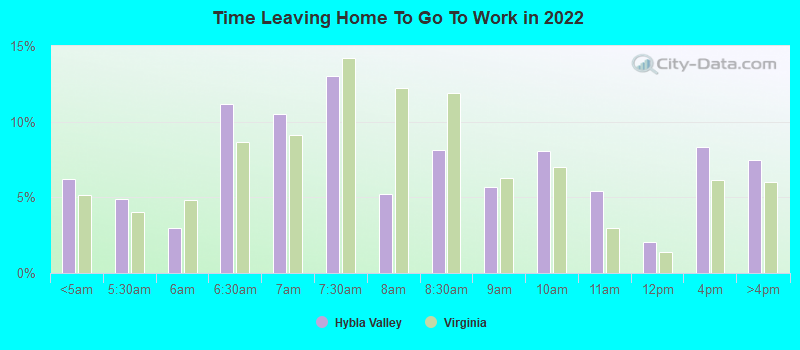
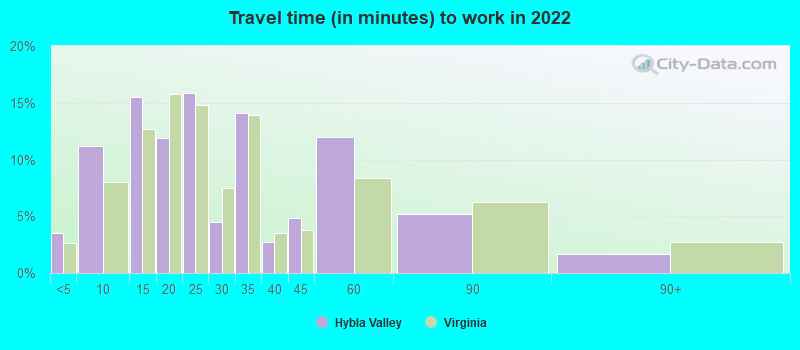
Travel time to work (commute)
Less than 5 minutes: 1335 to 9 minutes: 21110 to 14 minutes: 74115 to 19 minutes: 77220 to 24 minutes: 1,02525 to 29 minutes: 42630 to 34 minutes: 1,13035 to 39 minutes: 63340 to 44 minutes: 38345 to 59 minutes: 72160 to 89 minutes: 65090 or more minutes: 109
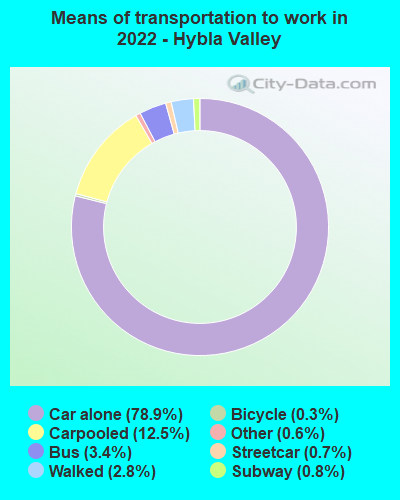
Means of transportation to work:
Drove a car alone: 3,048 (64.0%)Carpooled: 495 (10.4%)Bus : 89 (1.9%)Subway or elevated rail : 24 (0.5%)Long-distance train or commuter rail : 17 (0.4%)Taxi: 34 (0.7%)Bicycle: 7 (0.1%)Walked: 125 (2.6%)Worked at home: 751 (15.8%)
Unemployment by race in 2022
Unemployment rate for White non-Hispanic residents 7.2% Males0.7% FemalesUnemployment rate for Black residents 6.8% Males8.5% FemalesUnemployment rate for Asian residents 25.9% Males1.5% FemalesUnemployment rate for two or more race residents 3.0% FemalesUnemployment rate for Hispanic or Latino residents 1.3% Males0.7% Females
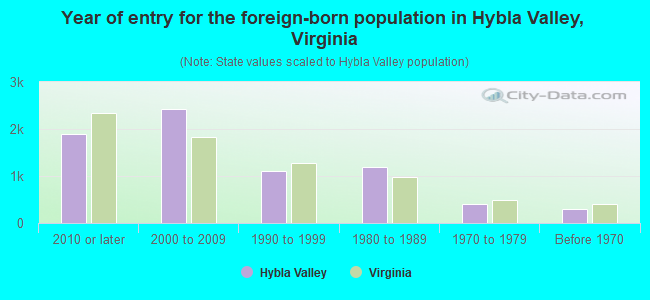
Year of entry for the foreign-born population in Hybla Valley, Virginia
1,899 2010 or later 2,424 2000 to 2009 1,107 1990 to 1999 1,195 1980 to 1989 410 1970 to 1979 288 Before 1970
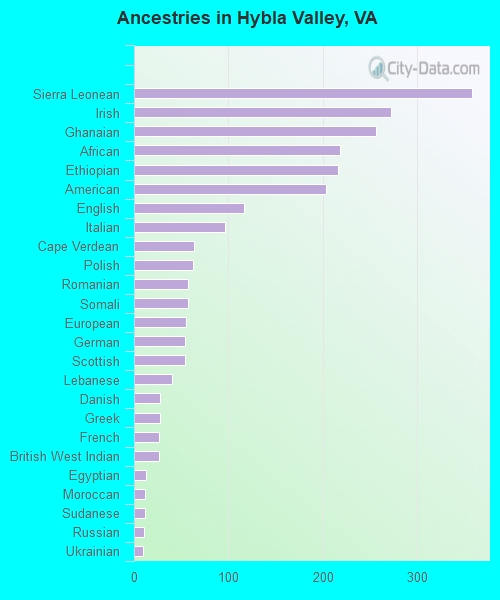
First ancestries reported:
Sierra Leonean: 358 (3.4%)
Irish: 272 (2.6%)
Ghanaian: 256 (2.4%)
African: 218 (2.1%)
Ethiopian: 216 (2.1%)
American: 203 (1.9%)
English: 116 (1.1%)
Italian: 96 (0.9%)
Cape Verdean: 64 (0.6%)
Polish: 62 (0.6%)
Romanian: 57 (0.5%)
Somali: 57 (0.5%)
European: 55 (0.5%)
German: 54 (0.5%)
Scottish: 54 (0.5%)
Lebanese: 40 (0.4%)
Danish: 28 (0.3%)
Greek: 28 (0.3%)
French: 27 (0.3%)
British West Indian: 27 (0.3%)
Egyptian: 13 (0.1%)
Moroccan: 12 (0.1%)
Sudanese: 12 (0.1%)
Russian: 11 (0.1%)
Ukrainian: 10 (0.10%)
Haitian: 9 (0.09%)
Welsh: 2 (0.02%) Most common places of birth for foreign-born residents (%): El Salvador Hybla Valley:
16.4% (1,078)Virginia:
9.9% (107,534)
Mexico Hybla Valley:
13.2% (872)Virginia:
5.3% (57,498)
Honduras Hybla Valley:
11.6% (765)Virginia:
3.0% (32,892)
Sierra Leone Hybla Valley:
7.3% (484)Virginia:
0.6% (6,458)
Ghana Hybla Valley:
5.5% (362)Virginia:
1.6% (17,346)
Bolivia Hybla Valley:
4.7% (312)Virginia:
2.4% (25,722)
Ethiopia Hybla Valley:
4.4% (291)Virginia:
2.9% (32,082)
Venezuela Hybla Valley:
4.4% (290)Virginia:
0.8% (8,186)
Pakistan Hybla Valley:
3.7% (242)Virginia:
2.3% (24,582)
Bangladesh Hybla Valley:
3.4% (225)Virginia:
1.1% (12,049)
Peru Hybla Valley:
3.2% (213)Virginia:
2.4% (26,366)
India Hybla Valley:
2.8% (185)Virginia:
9.0% (97,830)
Korea Hybla Valley:
2.1% (138)Virginia:
4.9% (52,857)
Colombia Hybla Valley:
1.9% (125)Virginia:
1.3% (14,435)
Japan Hybla Valley:
1.9% (123)Virginia:
0.8% (8,805)
Argentina Hybla Valley:
1.6% (108)Virginia:
0.5% (4,997)
Vietnam Hybla Valley:
1.6% (106)Virginia:
4.2% (45,750)
Place of birth for U.S.-born residents:
This state: 6,850Other state: 4,138Northeast: 1,262Midwest: 539South: 1,924West: 406 81.8% of Hybla Valley residents lived in the same house 1 years ago.
Out of people who lived in different houses, 38.4% lived in this county.
Out of people who lived in different counties, 43.8% lived in Virginia.
Hybla Valley:
81.8%State average:
86.6%
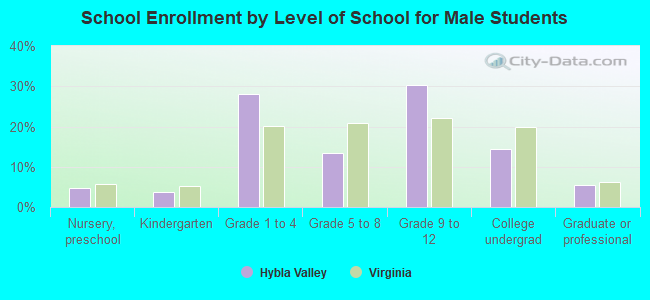
Education attainment for males 25 years and older:
No schooling: 198Nursery to 4th grade: 915th and 6th grade: 07th and 8th grade: 199th grade: 9910th grade: 8411th grade: 1312th grade, no diploma: 164High school graduate (or equivalency): 1,043Less than 1 year of college: 338Some college more than 1 year, no degree: 484Associate degree: 293Bachelor's degree: 1,013Master's degree: 655Professional school degree: 110Doctorate degree: 132
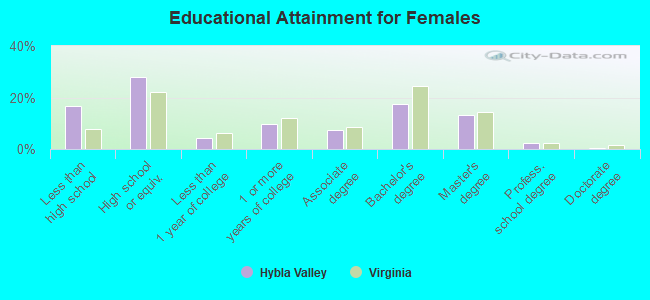
Education attainment for females 25 years and older:
No schooling: 178Nursery to 4th grade: 1095th and 6th grade: 867th and 8th grade: 1019th grade: 21610th grade: 7311th grade: 512th grade, no diploma: 209High school graduate (or equivalency): 1,619Less than 1 year of college: 257Some college more than 1 year, no degree: 570Associate degree: 435Bachelor's degree: 1,012Master's degree: 760Professional school degree: 132Doctorate degree: 31
Housing units in structures:
One, detached: 1,075One, attached: 1,076Two: 443 or 4: 945 to 9: 57010 to 19: 2,25720 to 49: 9150 or more: 121Mobile homes: 663Median worth of mobile homes: $36,526
Housing units lacking complete plumbing facilities in 2022: 0.2%Housing units lacking complete kitchen facilities in 2022: 1.6%House/condo owner moved in on average 13 years ago
Renter moved in on average 4 years ago
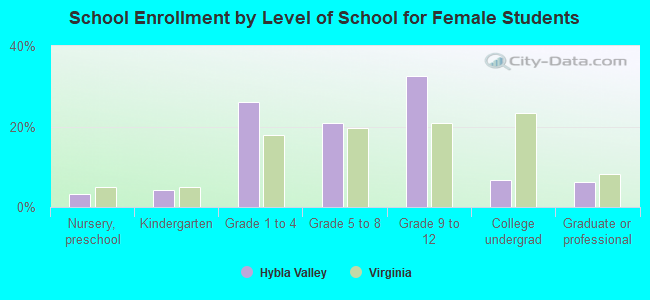
Private vs. public school enrollment:
Students in private schools in grades 1 to 8 (elementary and middle school): 262 Students in private schools in grades 9 to 12 (high school): 131 Students in private undergraduate colleges: 43