Independence, IA (Iowa) Houses and Residents
| Independence: | $166,096 |
| Iowa: | $194,600 |
Total population: 5,986 (Urban population: 5,582 (all inside urban clusters), Rural population: 311 (all nonfarm))
Houses: 2,889 (2,680 occupied: 1,875 owner occupied, 849 renter occupied)
| % of renters here: | 31% |
| State: | 28% |
Housing density: 779 houses/condos per square mile
Median price asked for vacant for-sale houses and condos in 2022: $323,215.
Median contract rent in 2022: $626 (lower quartile is $464, upper quartile is $764)
Median rent asked for vacant for-rent units in 2022: $522
Median gross rent in Independence, IA in 2022: $779
Housing units in Independence with a mortgage: 1,028 (94 second mortgage, 6 home equity loan, 61 both second mortgage and home equity loan)
Houses without a mortgage: 0
Median household income for houses/condos with a mortgage: $83,828
Median household income for apartments without a mortgage: $71,837
Median monthly housing costs: $861
Compare current foreclosures near Independence, IA:
| Photo | Address | Area | Beds / Baths | Price | Details |
|---|---|---|---|---|---|

|
#1
Lawrence Ave
Independence, IA 50644
|
- sq. feet
|
- baths - beds |
show details | |

|
#2
Enterprise Ct, Apt 11
Independence, IA 50644
|
- sq. feet
|
- baths - beds |
show details | |

|
#3
Kellie Ave SW
Independence, IA 50644
|
- sq. feet
|
- baths - beds |
show details | |

|
#4
262nd St
Independence, IA 50644
|
- sq. feet
|
- baths - beds |
show details | |

|
#5
8th Ave NE
Independence, IA 50644
|
- sq. feet
|
- baths - beds |
show details | |

|
#6
9th Ave NW
Independence, IA 50644
|
- sq. feet
|
- baths - beds |
show details | |

|
#7
7th Ave SW
Independence, IA 50644
|
- sq. feet
|
- baths - beds |
show details | |

|
#8
9th Ave NE
Independence, IA 50644
|
- sq. feet
|
- baths - beds |
show details | |

|
#9
7th Ave NW
Independence, IA 50644
|
- sq. feet
|
- baths - beds |
show details | |

|
#10
6th Ave NE
Independence, IA 50644
|
- sq. feet
|
- baths - beds |
show details |
| Photo | Address | Area | Beds / Baths | Price | Details |
|---|---|---|---|---|---|

|
#11
1st Ave NE
Oelwein, IA 50662
|
1,865 sq. feet
|
3 baths 4 beds |
show details | |

|
#12
E Sycamore St
Dunkerton, IA 50626
|
1,428 sq. feet
|
1 baths 3 beds |
show details | |

|
#13
Purdy Rd
La Porte City, IA 50651
|
2,132 sq. feet
|
4 baths 4 beds |
show details | |

|
#14
Young Rd
Jesup, IA 50648
|
1,936 sq. feet
|
2 baths 4 beds |
show details | |

|
#15
2nd St NE
Fairbank, IA 50629
|
1,030 sq. feet
|
2 baths 2 beds |
show details | |

|
#16
Oxley Rd
La Porte City, IA 50651
|
2,746 sq. feet
|
3 baths 3 beds |
show details | |

|
#17
Keokuk Ave
Hazleton, IA 50641
|
- sq. feet
|
- baths - beds |
show details | |

|
#18
Bettys Grove Rd
Walker, IA 52352
|
- sq. feet
|
- baths - beds |
show details | |

|
#19
16th Ave
Gilbertville, IA 50634
|
- sq. feet
|
- baths - beds |
show details | |

|
#20
N Washington St
Fairbank, IA 50629
|
- sq. feet
|
- baths - beds |
show details |
| Photo | Address | Area | Beds / Baths | Price | Details |
|---|---|---|---|---|---|

|
#21
280th St Lot 2
Jesup, IA 50648
|
- sq. feet
|
- baths - beds |
show details | |

|
Check over 1 million property listings on Foreclosure.com!
|
browse all offers | |||

Latest news about housing in Independence, IA collected exclusively by city-data.com from local newspapers, TV, and radio stations

 | Need Answers (5 replies) |
| Tell Me About Iowa, Please. (26 replies) |
| Town Suggestions - Northern Iowa (12 replies) |
| West Des Moines - The good, the bad and the ugly (47 replies) |
| Best Iowa Cities for Middle-aged Single Men (14 replies) |
| West Liberty (32 replies) |

Median year apartment built: 1970
Household type by relationship:
Households: 6,128- Male householders: 1,355 (572 living alone), Female householders: 1,294 (513 living alone)
1,138 spouses (1,138 opposite-sex spouses), 193 unmarried partners, (193 opposite-sex unmarried partners), 1,642 children (1,546 natural, 10 adopted, 86 stepchildren), 37 grandchildren, 53 brothers or sisters, 76 parents, 0 foster children, 0 other relatives, 190 non-relatives
- In group quarters: 145
Size of family households: 689 2-persons, 342 3-persons, 252 4-persons, 56 5-persons, 135 6-persons, 7 7-or-more-persons.
Size of nonfamily households: 1,129 1-person, 101 2-persons, 10 3-persons.
989 married couples with children.
360 single-parent households (121 men, 239 women).
96.4% of residents of Independence speak English at home.
3.1% of residents speak Spanish at home (57% speak English very well, 25% speak English well, 18% don't speak English at all).
0.3% of residents speak other Indo-European language at home (100% speak English very well).
0.2% of residents speak other language at home (100% speak English very well).
Foreign born population: 229 (3.7%)
(3.1% of them are naturalized citizens)
| Here: | 6.9 |
| State: | 6.8 |
| Here: | 4.1 |
| State: | 4.2 |

- Bedrooms in owner-occupied houses and condos in Independence, Iowa
- 0no bedroom
- 411 bedroom
- 3732 bedrooms
- 8133 bedrooms
- 5124 bedrooms
- 1365+ bedrooms

- Bedrooms in renter-occupied apartments in Independence, Iowa
- 73no bedroom
- 2921 bedroom
- 2992 bedrooms
- 1573 bedrooms
- 284 bedrooms
- 05+ bedrooms

- Cars and other vehicles available in Independence in owner-occupied houses/condos
- 55no vehicle
- 4501 vehicle
- 7732 vehicles
- 3813 vehicles
- 1864 vehicles
- 325+ vehicles

- Cars and other vehicles available in Independence in renter-occupied apartments
- 231no vehicle
- 4301 vehicle
- 1112 vehicles
- 763 vehicles
- 04 vehicles
- 05+ vehicles

- Rooms in owner-occupied houses in Independence, Iowa
- 01 room
- 352 rooms
- 303 rooms
- 1224 rooms
- 2855 rooms
- 3696 rooms
- 3807 rooms
- 1698 rooms
- 4869+ rooms

- Rooms in renter-occupied apartments in Independence, Iowa
- 551 room
- 82 rooms
- 1183 rooms
- 3834 rooms
- 695 rooms
- 1406 rooms
- 487 rooms
- 108 rooms
- 189+ rooms


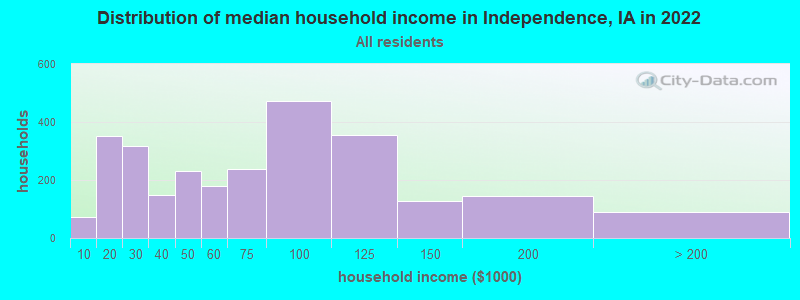
Independence, IA household income distribution

- 72Less than $10,000
- 352$10,000 to $19,999
- 318$20,000 to $29,999
- 150$30,000 to $39,999
- 231$40,000 to $49,999
- 178$50,000 to $59,999
- 239$60,000 to $74,999
- 472$75,000 to $99,999
- 354$100,000 to $124,999
- 129$125,000 to $149,999
- 145$150,000 to $199,999
- 89$200,000 or more
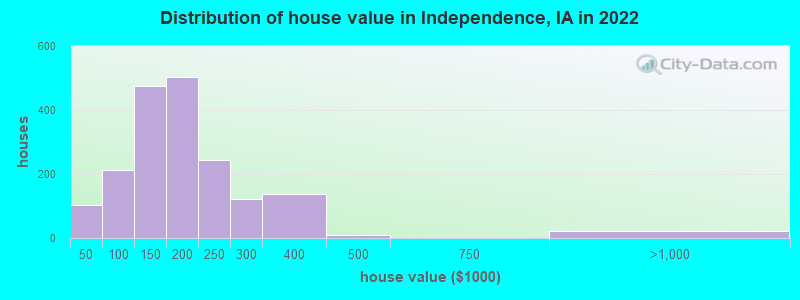
Home value of owner - occupied houses in 2022 in Independence, IA
-
- 36Less than $10,000
- 13$10,000 to $14,999
- 49$15,000 to $19,999
- 3$40,000 to $49,999
- 29$60,000 to $69,999
- 117$70,000 to $79,999
- 28$80,000 to $89,999
- 33$90,000 to $99,999
- 226$100,000 to $124,999
- 248$125,000 to $149,999
- 344$150,000 to $174,999
- 157$175,000 to $199,999
- 242$200,000 to $249,999
- 121$250,000 to $299,999
- 136$300,000 to $399,999
- 8$400,000 to $499,999
- 23$750,000 to $999,999
Rent paid by renters in 2022 in Independence, IA
-
- 65$100 to $149
- 6$150 to $199
- 31$200 to $249
- 41$300 to $349
- 25$350 to $399
- 24$400 to $449
- 50$450 to $499
- 65$500 to $549
- 37$550 to $599
- 71$600 to $649
- 47$650 to $699
- 109$700 to $749
- 71$750 to $799
- 29$800 to $899
- 39$900 to $999
- 51$1,000 to $1,249
- 13$1,500 to $1,999
- 7$2,000 to $2,499
- 9$3,500 or more
- 41No cash rent


Percentage of workers working in this county: 66.1%
Number of people working at home: 223 (7.1% of all workers)
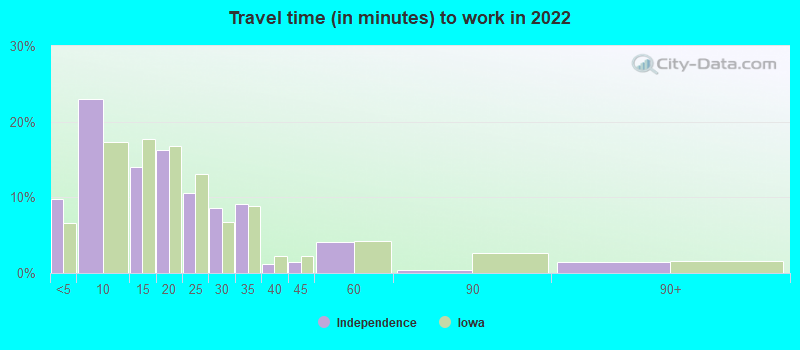
Travel time to work (commute)
- Less than 5 minutes: 320
- 5 to 9 minutes: 823
- 10 to 14 minutes: 401
- 15 to 19 minutes: 269
- 20 to 24 minutes: 138
- 25 to 29 minutes: 318
- 30 to 34 minutes: 142
- 35 to 39 minutes: 55
- 40 to 44 minutes: 79
- 45 to 59 minutes: 201
- 60 to 89 minutes: 72
- 90 or more minutes: 91
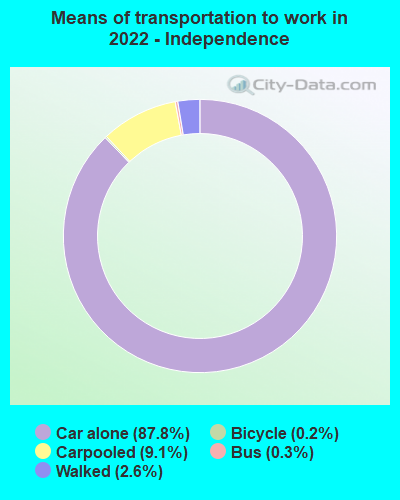
Means of transportation to work:
- Drove a car alone: 3,299 (81.7%)
- Carpooled: 362 (9.0%)
- Bus: 11 (0.3%)
- Bicycle: 9 (0.2%)
- Walked: 97 (2.4%)
- Worked at home: 223 (5.5%)

- Unemployment by race in 2022
- Unemployment rate for White non-Hispanic residents
- 1.1%Males
- 1.6%Females

- Year of entry for the foreign-born population in Independence, Iowa
- 1982010 or later
- 62000 to 2009
- 481990 to 1999
- 231980 to 1989
- 281970 to 1979
- 40Before 1970

First ancestries reported:
- German: 654 (30.2%)
- American: 400 (18.5%)
- English: 167 (7.7%)
- Irish: 147 (6.8%)
- European: 98 (4.5%)
- African: 79 (3.6%)
- Polish: 48 (2.2%)
- Norwegian: 33 (1.5%)
- Czech: 31 (1.4%)
- Italian: 27 (1.2%)
- Swedish: 22 (1.0%)
- Dutch: 20 (0.9%)
- Danish: 14 (0.6%)
- French Canadian: 10 (0.5%)
- Scotch-Irish: 9 (0.4%)
- Scottish: 7 (0.3%)
- Hungarian: 5 (0.2%)
- Slovene: 4 (0.2%)
Most common places of birth for foreign-born residents (%):
| Independence: | 55.3% (121) |
| Iowa: | 1.7% (2,949) |
| Independence: | 30.6% (67) |
| Iowa: | 23.3% (41,625) |
| Independence: | 3.2% (7) |
| Iowa: | 6.2% (11,148) |
| Independence: | 2.3% (5) |
| Iowa: | 0.2% (366) |
| Independence: | 1.8% (4) |
| Iowa: | 1.0% (1,803) |
Place of birth for U.S.-born residents:
- This state: 5,001
- Other state: 904
- Northeast: 26
- Midwest: 520
- South: 136
- West: 222
82.3% of Independence residents lived in the same house 1 years ago.
Out of people who lived in different houses, 37.6% lived in this county.
Out of people who lived in different counties, 59.6% lived in Iowa.
| Independence: | 82.3% |
| State average: | 87.2% |
Education attainment for males 25 years and older:
- No schooling: 27
- Nursery to 4th grade: 0
- 5th and 6th grade: 36
- 7th and 8th grade: 11
- 9th grade: 3
- 10th grade: 13
- 11th grade: 14
- 12th grade, no diploma: 19
- High school graduate (or equivalency): 819
- Less than 1 year of college: 234
- Some college more than 1 year, no degree: 250
- Associate degree: 186
- Bachelor's degree: 312
- Master's degree: 125
- Professional school degree: 11
- Doctorate degree: 14

Education attainment for females 25 years and older:
- No schooling: 0
- Nursery to 4th grade: 0
- 5th and 6th grade: 0
- 7th and 8th grade: 0
- 9th grade: 0
- 10th grade: 26
- 11th grade: 23
- 12th grade, no diploma: 18
- High school graduate (or equivalency): 703
- Less than 1 year of college: 208
- Some college more than 1 year, no degree: 346
- Associate degree: 276
- Bachelor's degree: 411
- Master's degree: 211
- Professional school degree: 8
- Doctorate degree: 26


Housing units in structures:
- One, detached: 2,043
- One, attached: 114
- Two: 153
- 3 or 4: 311
- 5 to 9: 24
- 10 to 19: 11
- 20 to 49: 158
- Mobile homes: 73
Median worth of mobile homes: $11,901
Housing units lacking complete kitchen facilities in 2022: 6.0%
House/condo owner moved in on average 10 years ago
Renter moved in on average 4 years ago

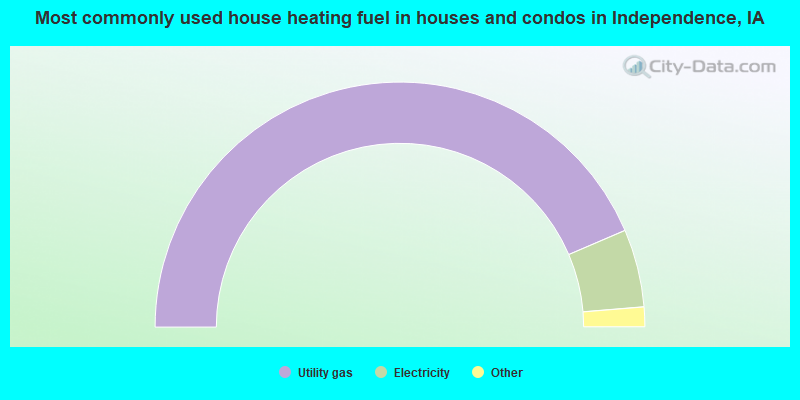
- 87.1%Utility gas
- 10.3%Electricity
- 1.5%Bottled, tank, or LP gas
- 0.6%Wood
- 0.5%No fuel used
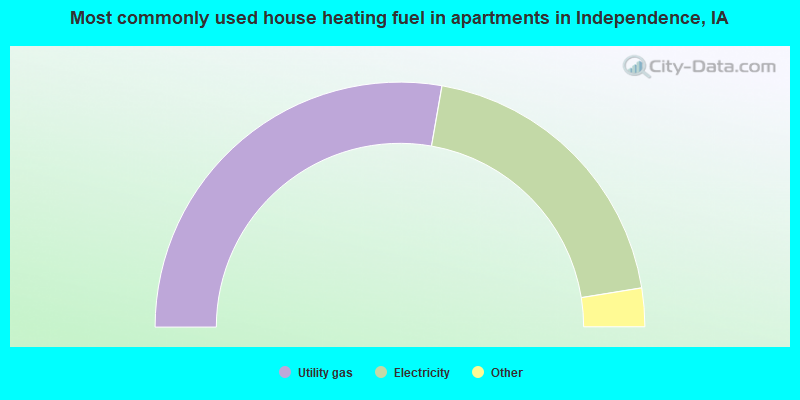
- 55.5%Utility gas
- 39.4%Electricity
- 2.2%Bottled, tank, or LP gas
- 1.6%Other fuel
- 1.3%No fuel used
Private vs. public school enrollment:
| Here: | 16.1% |
| Iowa: | 10.6% |
| Here: | 2.9% |
| Iowa: | 7.9% |
| Here: | 6.3% |
| Iowa: | 23.9% |


