Independence, OH (Ohio) Houses and Residents
| Independence: | $311,698 |
| Ohio: | $204,100 |
Total population: 7,136 (Urban population: 6,313, Rural population: 883 (all nonfarm))
Houses: 3,135 (3,008 occupied: 2,859 owner occupied, 166 renter occupied)
| % of renters here: | 5% |
| State: | 33% |
Housing density: 327 houses/condos per square mile
Median price asked for vacant for-sale houses and condos in 2022 in this county: $148,610.
Median contract rent in 2022: $1,069 (lower quartile is $686, upper quartile is $1,343)
Median gross rent in Independence, OH in 2022: $1,551
Housing units in Independence with a mortgage: 1,566 (195 second mortgage, 0 home equity loan, 193 both second mortgage and home equity loan)
Houses without a mortgage: 308
Median household income for houses/condos with a mortgage: $132,321
Median household income for apartments without a mortgage: $86,850
Median monthly housing costs: $1,311
Compare current foreclosures near Independence, OH:
| Photo | Address | Area | Beds / Baths | Price | Details |
|---|---|---|---|---|---|

|
#1
Starlight Dr
Independence, OH 44131
|
1,838 sq. feet
|
2 baths 3 beds |
show details | |

|
#2
Starlight Dr
Independence, OH 44131
|
1,340 sq. feet
|
1 baths 3 beds |
show details | |

|
#3
Brecksville Rd
Independence, OH 44131
|
2,836 sq. feet
|
2 baths 3 beds |
show details | |

|
#4
W 5th St
Independence, OH 44131
|
1,652 sq. feet
|
1 baths 3 beds |
show details | |

|
#5
E Schaaf Rd
Independence, OH 44131
|
1,889 sq. feet
|
1 baths 4 beds |
show details | |

|
#6
Meadowlane Rd
Independence, OH 44131
|
1,669 sq. feet
|
1 baths 3 beds |
show details | |

|
#7
Vezber Dr
Independence, OH 44131
|
1,535 sq. feet
|
1 baths 3 beds |
show details | |

|
#8
E Schaaf Rd
Independence, OH 44131
|
1,683 sq. feet
|
1 baths 3 beds |
show details | |

|
#9
Poplar Dr
Independence, OH 44131
|
2,233 sq. feet
|
1 baths 2 beds |
show details | |

|
#10
E Pleasant Valley Rd
Independence, OH 44131
|
2,430 sq. feet
|
2 baths 4 beds |
show details |
| Photo | Address | Area | Beds / Baths | Price | Details |
|---|---|---|---|---|---|

|
#11
Cabrini Ln
Independence, OH 44131
|
1,914 sq. feet
|
1 baths 3 beds |
show details | |

|
#12
Saint Joseph Dr
Independence, OH 44131
|
1,771 sq. feet
|
1 baths 4 beds |
show details | |

|
#13
Greenlawn Dr
Independence, OH 44131
|
1,539 sq. feet
|
1 baths 3 beds |
show details | |

|
#14
Elmarge Dr
Independence, OH 44131
|
1,725 sq. feet
|
2 baths 3 beds |
show details | |

|
#15
Crossview Rd
Independence, OH 44131
|
- sq. feet
|
- baths - beds |
show details | |

|
#16
Oak Tree Blvd Ste 200
Independence, OH 44131
|
- sq. feet
|
- baths - beds |
show details | |

|
#17
E Meadowlawn Blvd
Independence, OH 44131
|
- sq. feet
|
- baths - beds |
show details | |

|
#18
Hale Dr
Streetsboro, OH 44241
|
1,874 sq. feet
|
2 baths 3 beds |
$314,500
|
show details |

|
#19
Miller Ave
Cleveland, OH 44119
|
830 sq. feet
|
1 baths 2 beds |
$149,900
|
show details |

|
#20
E 134th St
Cleveland, OH 44105
|
1,549 sq. feet
|
1 baths 3 beds |
$129,900
|
show details |
| Photo | Address | Area | Beds / Baths | Price | Details |
|---|---|---|---|---|---|

|
#21
Wilmington Rd
Cleveland, OH 44121
|
1,278 sq. feet
|
1 baths 3 beds |
$134,900
|
show details |

|
#22
Ashland Dr
Brook Park, OH 44142
|
888 sq. feet
|
1 baths 3 beds |
$214,500
|
show details |

|
#23
Arcade Ave
Cleveland, OH 44110
|
2,036 sq. feet
|
2 baths 4 beds |
$8,500
|
show details |

|
#24
E 128th St
Cleveland, OH 44120
|
2,590 sq. feet
|
3 baths 5 beds |
$22,500
|
show details |

|
#25
Greenfield Ct
Berea, OH 44017
|
840 sq. feet
|
1 baths 2 beds |
$144,500
|
show details |

|
#26
E 147th St
Cleveland, OH 44120
|
2,360 sq. feet
|
3 baths 5 beds |
$22,500
|
show details |

|
#27
E 128th St
Cleveland, OH 44120
|
1,894 sq. feet
|
1 baths 4 beds |
$44,900
|
show details |

|
#28
E 97th St
Cleveland, OH 44105
|
- sq. feet
|
1 baths 5 beds |
$62,400
|
show details |

|
#29
Maryland Ave
Cleveland, OH 44105
|
1,908 sq. feet
|
2 baths 4 beds |
$29,900
|
show details |

|
#30
Daleford Rd
Cleveland, OH 44120
|
3,164 sq. feet
|
3 baths 6 beds |
show details |
| Photo | Address | Area | Beds / Baths | Price | Details |
|---|---|---|---|---|---|

|
#31
Van Aken Blvd Apt 207
Beachwood, OH 44122
|
798 sq. feet
|
1 baths 2 beds |
show details | |

|
#32
Pawnee Ave
Cleveland, OH 44119
|
1,884 sq. feet
|
2 baths 4 beds |
show details | |

|
#33
Osceola Ave
Cleveland, OH 44108
|
2,395 sq. feet
|
2 baths 4 beds |
show details | |

|
#34
Coventry Dr
Cleveland, OH 44134
|
2,234 sq. feet
|
1 baths 3 beds |
show details | |

|
#35
Glenfield Rd
Cleveland, OH 44119
|
- sq. feet
|
- baths - beds |
$34,900
|
show details |

|
#36
Ridge Rd
North Royalton, OH 44133
|
1,269 sq. feet
|
2 baths 4 beds |
show details | |

|
#37
Forest Glen Dr
North Royalton, OH 44133
|
3,464 sq. feet
|
3 baths 4 beds |
show details | |

|
#38
E 143rd St
Cleveland, OH 44128
|
1,161 sq. feet
|
1 baths 4 beds |
show details | |

|
#39
Thornwood Ave
Cleveland, OH 44108
|
1,228 sq. feet
|
1 baths 3 beds |
show details | |

|
#40
Sherry Ave
Cleveland, OH 44135
|
1,461 sq. feet
|
1 baths 5 beds |
show details |
| Photo | Address | Area | Beds / Baths | Price | Details |
|---|---|---|---|---|---|

|
#41
E 142nd St
Cleveland, OH 44128
|
711 sq. feet
|
1 baths 2 beds |
show details | |

|
#42
E 153rd St
Cleveland, OH 44128
|
783 sq. feet
|
1 baths 2 beds |
show details | |

|
#43
Kennerdown Ave
Maple Heights, OH 44137
|
1,188 sq. feet
|
1 baths 3 beds |
show details | |

|
#44
Blue Heron Dr
Solon, OH 44139
|
2,372 sq. feet
|
3 baths 4 beds |
show details | |

|
#45
Dove Ave
Cleveland, OH 44105
|
1,455 sq. feet
|
2 baths 3 beds |
show details | |

|
#46
Palmetto Ave
Bedford, OH 44146
|
1,068 sq. feet
|
1 baths 3 beds |
show details | |

|
#47
E 179th St
Cleveland, OH 44119
|
1,512 sq. feet
|
2 baths 3 beds |
show details | |

|
#48
Fulton Rd
Cleveland, OH 44144
|
1,014 sq. feet
|
1 baths 2 beds |
show details | |

|
#49
Kirton Ave
Cleveland, OH 44135
|
1,092 sq. feet
|
1 baths 2 beds |
show details | |

|
Check over 1 million property listings on Foreclosure.com!
|
browse all offers | |||

Latest news about housing in Independence, OH collected exclusively by city-data.com from local newspapers, TV, and radio stations

 | Housing Market for $500k+ Homes (38 replies) |
| Houses for rent near Independence (3 replies) |
| Young couple needing advice on where to rent, work in Independence (3 replies) |
| Why buy in Cincinnati as opposed to northern KY? (30 replies) |
| Cleveland Development Discussions (4357 replies) |
| How did Biden not win Ohio? (211 replies) |

Median year apartment built: 1954
Household type by relationship:
Households: 7,415- Male householders: 1,603 (358 living alone), Female householders: 1,359 (326 living alone)
1,862 spouses (1,855 opposite-sex spouses), 57 unmarried partners, (57 opposite-sex unmarried partners), 2,314 children (2,267 natural, 0 adopted, 47 stepchildren), 97 grandchildren, 0 brothers or sisters, 30 parents, 0 foster children, 37 other relatives, 25 non-relatives
- In group quarters: 27
Size of family households: 1,178 2-persons, 489 3-persons, 416 4-persons, 144 5-persons, 60 6-persons, 7 7-or-more-persons.
Size of nonfamily households: 689 1-person, 51 2-persons.
1,185 married couples with children.
142 single-parent households (71 men, 71 women).
92.7% of residents of Independence speak English at home.
1.1% of residents speak Spanish at home (97% speak English very well, 3% speak English not well).
3.5% of residents speak other Indo-European language at home (75% speak English very well, 25% speak English well).
2.3% of residents speak Asian or Pacific Island language at home (69% speak English very well, 12% speak English well, 19% speak English not well).
1.0% of residents speak other language at home (100% speak English very well).
Foreign born population: 295 (4.0%)
(91.2% of them are naturalized citizens)
| Here: | 7.4 |
| State: | 6.7 |
| Here: | 6.0 |
| State: | 4.4 |

- Bedrooms in owner-occupied houses and condos in Independence, Ohio
- 0no bedroom
- 01 bedroom
- 1652 bedrooms
- 1,4813 bedrooms
- 9714 bedrooms
- 2425+ bedrooms

- Bedrooms in renter-occupied apartments in Independence, Ohio
- 0no bedroom
- 561 bedroom
- 192 bedrooms
- 523 bedrooms
- 394 bedrooms
- 05+ bedrooms

- Cars and other vehicles available in Independence in owner-occupied houses/condos
- 38no vehicle
- 5681 vehicle
- 1,3212 vehicles
- 6833 vehicles
- 1824 vehicles
- 675+ vehicles

- Cars and other vehicles available in Independence in renter-occupied apartments
- 6no vehicle
- 841 vehicle
- 622 vehicles
- 143 vehicles
- 04 vehicles
- 05+ vehicles

- Rooms in owner-occupied houses in Independence, Ohio
- 01 room
- 02 rooms
- 63 rooms
- 554 rooms
- 3435 rooms
- 5166 rooms
- 5567 rooms
- 5158 rooms
- 8689+ rooms

- Rooms in renter-occupied apartments in Independence, Ohio
- 01 room
- 02 rooms
- 03 rooms
- 404 rooms
- 135 rooms
- 526 rooms
- 287 rooms
- 338 rooms
- 09+ rooms


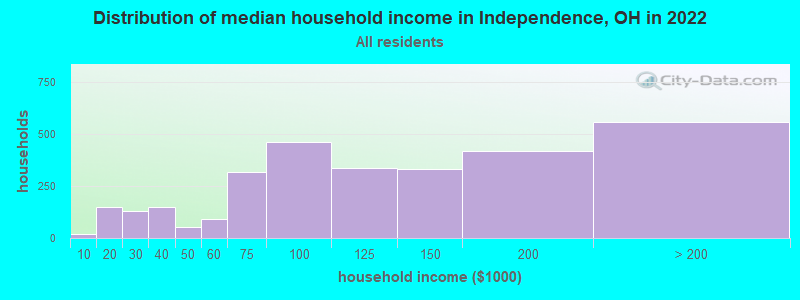
Independence, OH household income distribution

- 21Less than $10,000
- 150$10,000 to $19,999
- 131$20,000 to $29,999
- 148$30,000 to $39,999
- 55$40,000 to $49,999
- 90$50,000 to $59,999
- 319$60,000 to $74,999
- 461$75,000 to $99,999
- 334$100,000 to $124,999
- 329$125,000 to $149,999
- 418$150,000 to $199,999
- 557$200,000 or more
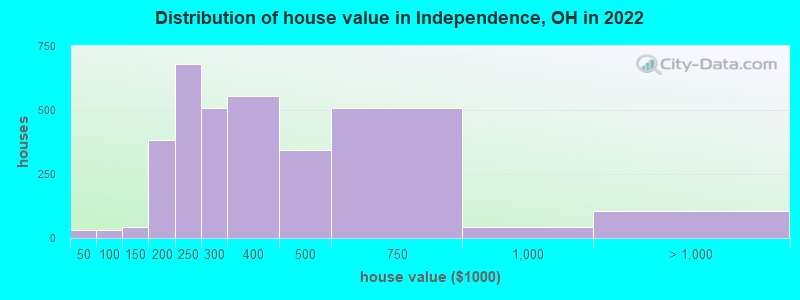
Home value of owner - occupied houses in 2022 in Independence, OH
-
- 8Less than $10,000
- 5$10,000 to $14,999
- 6$25,000 to $29,999
- 10$35,000 to $39,999
- 9$50,000 to $59,999
- 21$90,000 to $99,999
- 41$125,000 to $149,999
- 151$150,000 to $174,999
- 229$175,000 to $199,999
- 680$200,000 to $249,999
- 508$250,000 to $299,999
- 555$300,000 to $399,999
- 341$400,000 to $499,999
- 508$500,000 to $749,999
- 44$750,000 to $999,999
- 31$1,000,000 to $1,499,999
- 72$2,000,000 or more
Rent paid by renters in 2022 in Independence, OH
-
- 24$400 to $449
- 52$650 to $699
- 49$1,000 to $1,249
- 46$1,250 to $1,499
- 4$1,500 to $1,999
- 10No cash rent


Percentage of workers working in this county: 83.4%
Number of people working at home: 812 (20.7% of all workers)

Travel time to work (commute)
- Less than 5 minutes: 90
- 5 to 9 minutes: 252
- 10 to 14 minutes: 427
- 15 to 19 minutes: 567
- 20 to 24 minutes: 457
- 25 to 29 minutes: 506
- 30 to 34 minutes: 358
- 35 to 39 minutes: 49
- 40 to 44 minutes: 173
- 45 to 59 minutes: 208
- 60 to 89 minutes: 43
- 90 or more minutes: 34
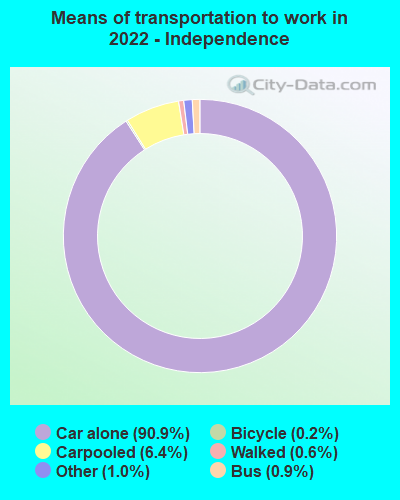
Means of transportation to work:
- Drove a car alone: 12,968 (83.3%)
- Carpooled: 922 (5.9%)
- Bus: 107 (0.7%)
- Taxi: 146 (0.9%)
- Bicycle: 44 (0.3%)
- Walked: 107 (0.7%)
- Worked at home: 812 (5.2%)

- Unemployment by race in 2022
- Unemployment rate for White non-Hispanic residents
- 1.3%Males

- Year of entry for the foreign-born population in Independence, Ohio
- 02010 or later
- 372000 to 2009
- 591990 to 1999
- 1041980 to 1989
- 451970 to 1979
- 196Before 1970

First ancestries reported:
- Polish: 583 (20.0%)
- Italian: 356 (12.2%)
- German: 259 (8.9%)
- American: 176 (6.0%)
- Irish: 163 (5.6%)
- Hungarian: 152 (5.2%)
- Slovak: 106 (3.6%)
- Slovene: 95 (3.3%)
- Arab: 84 (2.9%)
- Greek: 63 (2.2%)
- English: 62 (2.1%)
- Romanian: 43 (1.5%)
- Palestinian: 40 (1.4%)
- Lebanese: 31 (1.1%)
- Czech: 31 (1.1%)
- Eastern European: 18 (0.6%)
- Slavic: 17 (0.6%)
- Welsh: 16 (0.5%)
- Carpatho Rusyn: 15 (0.5%)
- Dutch: 15 (0.5%)
- Serbian: 12 (0.4%)
- European: 7 (0.2%)
- Austrian: 3 (0.1%)
Most common places of birth for foreign-born residents (%):
| Independence: | 14.1% (43) |
| Ohio: | 1.4% (8,101) |
| Independence: | 13.4% (41) |
| Ohio: | 6.2% (35,703) |
| Independence: | 11.8% (36) |
| Ohio: | 2.6% (14,988) |
| Independence: | 8.2% (25) |
| Ohio: | 1.1% (6,346) |
| Independence: | 5.9% (18) |
| Ohio: | 0.9% (5,422) |
| Independence: | 5.6% (17) |
| Ohio: | 1.0% (5,979) |
| Independence: | 4.6% (14) |
| Ohio: | 0.3% (1,754) |
| Independence: | 3.6% (11) |
| Ohio: | 2.2% (12,846) |
| Independence: | 3.3% (10) |
| Ohio: | 0.7% (4,155) |
| Independence: | 2.6% (8) |
| Ohio: | 0.7% (3,862) |
| Independence: | 2.6% (8) |
| Ohio: | 0.8% (4,490) |
| Independence: | 2.3% (7) |
| Ohio: | 0.2% (1,013) |
| Independence: | 1.6% (5) |
| Ohio: | 3.1% (17,818) |
Place of birth for U.S.-born residents:
- This state: 6,100
- Other state: 935
- Northeast: 548
- Midwest: 57
- South: 310
- West: 33
96.1% of Independence residents lived in the same house 1 years ago.
Out of people who lived in different houses, 46.8% lived in this county.
Out of people who lived in different counties, 100.0% lived in Ohio.
| Independence: | 96.1% |
| State average: | 87.8% |
Education attainment for males 25 years and older:
- No schooling: 0
- Nursery to 4th grade: 0
- 5th and 6th grade: 0
- 7th and 8th grade: 0
- 9th grade: 0
- 10th grade: 4
- 11th grade: 6
- 12th grade, no diploma: 0
- High school graduate (or equivalency): 614
- Less than 1 year of college: 250
- Some college more than 1 year, no degree: 442
- Associate degree: 37
- Bachelor's degree: 833
- Master's degree: 319
- Professional school degree: 77
- Doctorate degree: 22

Education attainment for females 25 years and older:
- No schooling: 16
- Nursery to 4th grade: 0
- 5th and 6th grade: 0
- 7th and 8th grade: 0
- 9th grade: 0
- 10th grade: 0
- 11th grade: 23
- 12th grade, no diploma: 12
- High school graduate (or equivalency): 779
- Less than 1 year of college: 154
- Some college more than 1 year, no degree: 278
- Associate degree: 139
- Bachelor's degree: 715
- Master's degree: 615
- Professional school degree: 142
- Doctorate degree: 74


Housing units in structures:
- One, detached: 3,051
- One, attached: 45
- Two: 21
- 20 to 49: 15
Housing units lacking complete kitchen facilities in 2022: 1.2%
House/condo owner moved in on average 19 years ago
Renter moved in on average 6 years ago

Private vs. public school enrollment:
| Here: | 2.6% |
| Ohio: | 16.0% |
| Here: | 19.4% |
| Ohio: | 13.1% |
| Here: | 55.6% |
| Ohio: | 22.3% |


