Independence, OR (Oregon) Houses and Residents
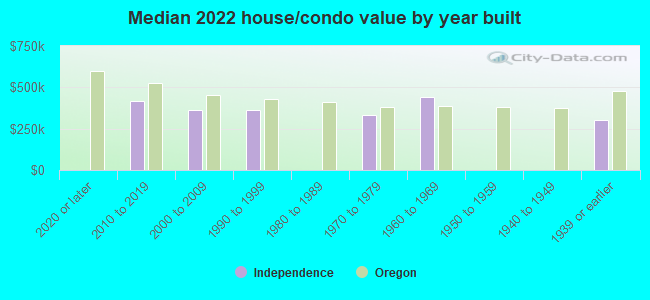
| Independence: | $358,378 |
| Oregon: | $475,600 |
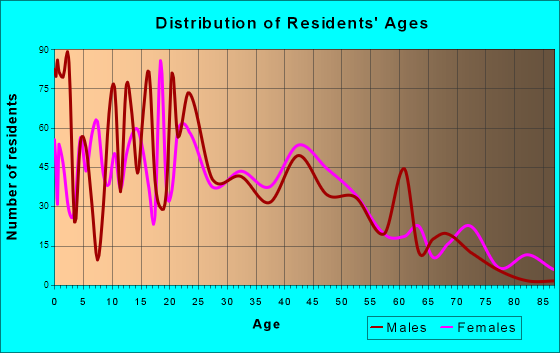
Total population: 8,768 (Urban population: 5,972 (all inside urban clusters), Rural population: 0)
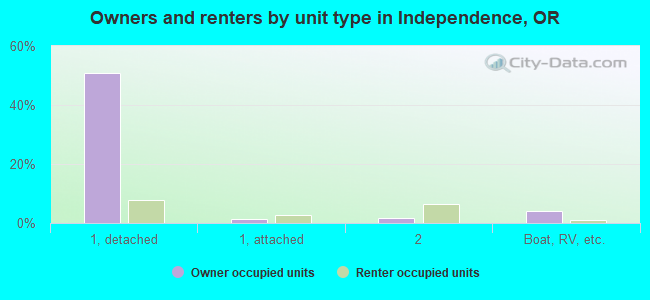
Houses: 3,144 (3,099 occupied: 1,834 owner occupied, 1,258 renter occupied)
| % of renters here: | 41% |
| State: | 37% |
Housing density: 1,347 houses/condos per square mile
Median price asked for vacant for-sale houses and condos in 2022 in this county: $300,360.
Median contract rent in 2022: $1,412 (lower quartile is $969, upper quartile is $1,592)
Median rent asked for vacant for-rent units in 2022: $1,550
Median gross rent in Independence, OR in 2022: $1,496
Housing units in Independence with a mortgage: 1,330 (124 second mortgage, 0 home equity loan, 112 both second mortgage and home equity loan)
Houses without a mortgage: 15
Median household income for houses/condos with a mortgage: $78,600
Median household income for apartments without a mortgage: $66,569
Median monthly housing costs: $1,563
Compare current foreclosures near Independence, OR:
| Photo | Address | Area | Beds / Baths | Price | Details |
|---|---|---|---|---|---|

|
#1
E St
Independence, OR 97351
|
1,392 sq. feet
|
2 baths 3 beds |
show details | |

|
#2
Rickreall Rd
Independence, OR 97351
|
2,432 sq. feet
|
1 baths 3 beds |
show details | |

|
#3
S Main St
Independence, OR 97351
|
2,082 sq. feet
|
1 baths 4 beds |
show details | |

|
#4
Monmouth St
Independence, OR 97351
|
2,260 sq. feet
|
2 baths 4 beds |
show details | |

|
#5
S 11th St
Independence, OR 97351
|
1,116 sq. feet
|
1 baths 3 beds |
show details | |

|
#6
S 6th St
Independence, OR 97351
|
1,583 sq. feet
|
2 baths 3 beds |
show details | |

|
#7
Morning Glory Dr
Independence, OR 97351
|
2,078 sq. feet
|
2 baths 4 beds |
show details | |

|
#8
Marigold Dr
Independence, OR 97351
|
- sq. feet
|
- baths - beds |
show details | |

|
#9
D St
Independence, OR 97351
|
- sq. feet
|
- baths - beds |
show details | |

|
#10
S 16th St
Independence, OR 97351
|
- sq. feet
|
- baths - beds |
show details |
| Photo | Address | Area | Beds / Baths | Price | Details |
|---|---|---|---|---|---|

|
#11
Chestnut St
Independence, OR 97351
|
- sq. feet
|
- baths - beds |
show details | |

|
#12
N Gun Club Rd
Independence, OR 97351
|
- sq. feet
|
- baths - beds |
show details | |

|
#13
White Oak Cir Apt 325
Independence, OR 97351
|
- sq. feet
|
- baths - beds |
show details | |

|
#14
Osprey Ln, Apt 101
Independence, OR 97351
|
- sq. feet
|
- baths - beds |
show details | |

|
#15
Deann Dr # 8
Independence, OR 97351
|
- sq. feet
|
- baths - beds |
show details | |

|
#16
Log Cabin St
Independence, OR 97351
|
- sq. feet
|
- baths - beds |
show details | |

|
#17
Bates Rd SE
Aumsville, OR 97325
|
1,920 sq. feet
|
2 baths 3 beds |
show details | |

|
#18
Michigan City Ln NW
Salem, OR 97304
|
1,568 sq. feet
|
2 baths 3 beds |
show details | |

|
#19
Hawksview Ave SE
Salem, OR 97306
|
1,683 sq. feet
|
3 baths 3 beds |
show details | |

|
#20
Broadway St NE
Salem, OR 97301
|
884 sq. feet
|
1 baths 2 beds |
show details |
| Photo | Address | Area | Beds / Baths | Price | Details |
|---|---|---|---|---|---|

|
#21
S 2nd Pl
Jefferson, OR 97352
|
1,321 sq. feet
|
2 baths 3 beds |
show details | |

|
#22
Hazelgreen Rd NE
Salem, OR 97305
|
1,236 sq. feet
|
2 baths 3 beds |
show details | |

|
#23
Crater Ave N
Salem, OR 97303
|
1,297 sq. feet
|
2 baths 3 beds |
show details | |

|
#24
Marlatt Rd S
Jefferson, OR 97352
|
1,196 sq. feet
|
1 baths 2 beds |
show details | |

|
#25
Arcade Ave NE
Salem, OR 97303
|
1,495 sq. feet
|
2 baths 3 beds |
show details | |

|
#26
Golden Eagle St NW
Salem, OR 97304
|
2,753 sq. feet
|
3 baths 4 beds |
show details | |

|
#27
Vallejo St NE
Salem, OR 97301
|
960 sq. feet
|
1 baths 3 beds |
show details | |

|
#28
20th St NE
Salem, OR 97301
|
1,020 sq. feet
|
2 baths 3 beds |
show details | |

|
#29
Stayton Rd SE
Turner, OR 97392
|
832 sq. feet
|
1 baths 2 beds |
show details | |

|
#30
16th Ave SW
Albany, OR 97321
|
983 sq. feet
|
1 baths 3 beds |
show details |
| Photo | Address | Area | Beds / Baths | Price | Details |
|---|---|---|---|---|---|

|
#31
NW Card Ave
Dallas, OR 97338
|
1,330 sq. feet
|
2 baths 3 beds |
show details | |

|
#32
Azalea Ave SE
Albany, OR 97322
|
2,131 sq. feet
|
2 baths 4 beds |
show details | |

|
#33
Waller St SE
Salem, OR 97302
|
1,112 sq. feet
|
1 baths 3 beds |
show details | |

|
#34
Regal Dr NE
Salem, OR 97301
|
1,732 sq. feet
|
3 baths 5 beds |
show details | |

|
#35
Mcclellan Ln SE
Aumsville, OR 97325
|
988 sq. feet
|
1 baths 2 beds |
show details | |

|
#36
E Del Mar
Aumsville, OR 97325
|
1,651 sq. feet
|
2 baths 4 beds |
show details | |

|
#37
Fairview St
Falls City, OR 97344
|
1,120 sq. feet
|
1 baths 3 beds |
show details | |

|
#38
Holly Loop SE
Turner, OR 97392
|
1,054 sq. feet
|
2 baths 3 beds |
show details | |

|
#39
Washington St SW
Albany, OR 97321
|
1,116 sq. feet
|
1 baths 2 beds |
show details | |

|
#40
Periwinkle Dr SE
Salem, OR 97317
|
- sq. feet
|
3 baths 4 beds |
show details |
| Photo | Address | Area | Beds / Baths | Price | Details |
|---|---|---|---|---|---|

|
#41
Abrams Ave NE
Salem, OR 97301
|
2,329 sq. feet
|
2 baths 4 beds |
show details | |

|
#42
NE Azalea Dr
Corvallis, OR 97330
|
1,144 sq. feet
|
1 baths 3 beds |
show details | |

|
#43
State St Unit 3
Salem, OR 97301
|
1,008 sq. feet
|
2 baths 3 beds |
show details | |

|
#44
Auburn Rd NE Unit 154
Salem, OR 97301
|
1,440 sq. feet
|
2 baths 3 beds |
show details | |

|
#45
Stonefield Pl N
Salem, OR 97303
|
1,264 sq. feet
|
2 baths 3 beds |
show details | |

|
#46
Apollo St SE
Turner, OR 97392
|
2,196 sq. feet
|
2 baths 3 beds |
show details | |

|
#47
Ferndell St NE
Salem, OR 97301
|
1,390 sq. feet
|
1 baths 3 beds |
show details | |

|
#48
Nordic Ct N
Salem, OR 97303
|
1,360 sq. feet
|
2 baths 2 beds |
show details | |

|
#49
Tierra Dr NE
Salem, OR 97301
|
1,000 sq. feet
|
1 baths 3 beds |
show details | |

|
Check over 1 million property listings on Foreclosure.com!
|
browse all offers | |||

Latest news about housing in Independence, OR collected exclusively by city-data.com from local newspapers, TV, and radio stations

 | Rental homes in the Salem area? (11 replies) |
| Independence update? (4 replies) |
| Oregon’s population declines for first time in 30 years, state economist warns of revenue loss (188 replies) |
| How will the new Single Family Home Zoning Ban Change Oregon? (24 replies) |
| How to Oregonians feel about Calif. transplants (308 replies) |
| impressions of Independence/Monmouth? (3 replies) |
Median year apartment built: 2000
Household type by relationship:
Households: 10,210- Male householders: 1,294 (297 living alone), Female householders: 1,783 (297 living alone)
1,684 spouses (1,640 opposite-sex spouses), 443 unmarried partners, (435 opposite-sex unmarried partners), 3,630 children (3,169 natural, 136 adopted, 325 stepchildren), 155 grandchildren, 30 brothers or sisters, 294 parents, 61 foster children, 321 other relatives, 432 non-relatives
- In group quarters: 77
Size of family households: 806 2-persons, 563 3-persons, 385 4-persons, 251 5-persons, 144 6-persons, 132 7-or-more-persons.
Size of nonfamily households: 442 1-person, 310 2-persons, 53 3-persons.
1,462 married couples with children.
1,103 single-parent households (58 men, 1,045 women).
75.8% of residents of Independence speak English at home.
23.4% of residents speak Spanish at home (62% speak English very well, 15% speak English well, 7% speak English not well, 16% don't speak English at all).
0.4% of residents speak other Indo-European language at home (95% speak English very well, 5% speak English not well).
0.3% of residents speak other language at home (100% speak English very well).
Foreign born population: 1,090 (10.7%)
(28.3% of them are naturalized citizens)
| Here: | 6.1 |
| State: | 6.2 |
| Here: | 4.4 |
| State: | 4.0 |
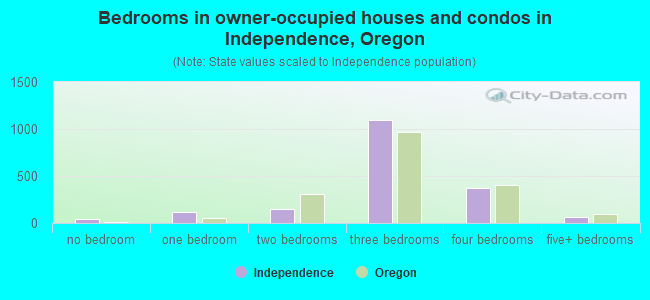
- Bedrooms in owner-occupied houses and condos in Independence, Oregon
- 40no bedroom
- 1171 bedroom
- 1462 bedrooms
- 1,0943 bedrooms
- 3684 bedrooms
- 695+ bedrooms
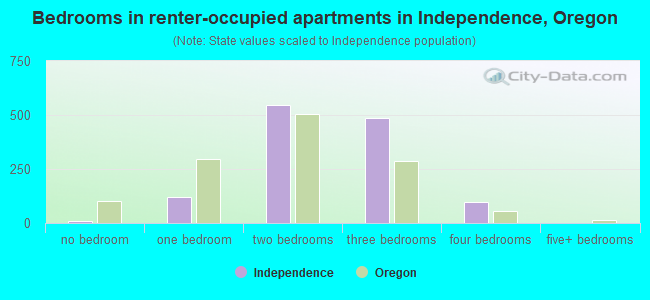
- Bedrooms in renter-occupied apartments in Independence, Oregon
- 10no bedroom
- 1211 bedroom
- 5452 bedrooms
- 4843 bedrooms
- 984 bedrooms
- 05+ bedrooms
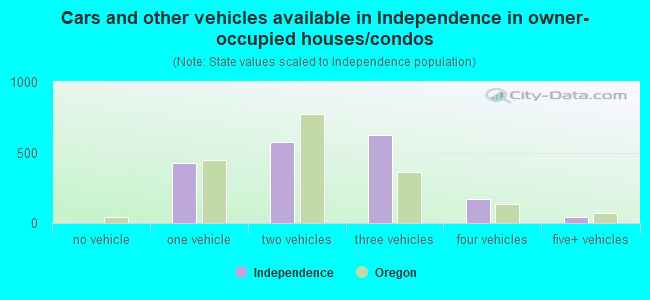
- Cars and other vehicles available in Independence in owner-occupied houses/condos
- 0no vehicle
- 4241 vehicle
- 5712 vehicles
- 6273 vehicles
- 1724 vehicles
- 415+ vehicles
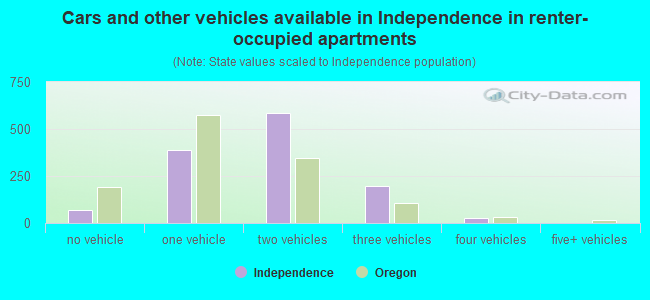
- Cars and other vehicles available in Independence in renter-occupied apartments
- 67no vehicle
- 3861 vehicle
- 5842 vehicles
- 1963 vehicles
- 264 vehicles
- 05+ vehicles
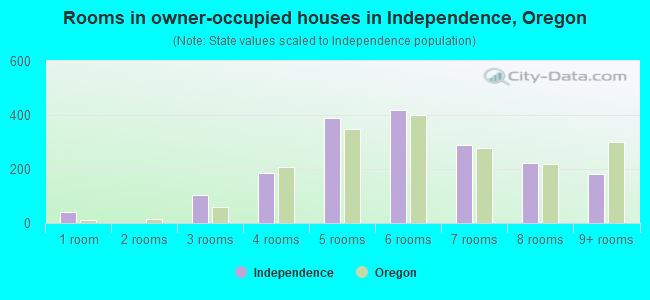
- Rooms in owner-occupied houses in Independence, Oregon
- 401 room
- 02 rooms
- 1053 rooms
- 1874 rooms
- 3895 rooms
- 4176 rooms
- 2907 rooms
- 2238 rooms
- 1839+ rooms
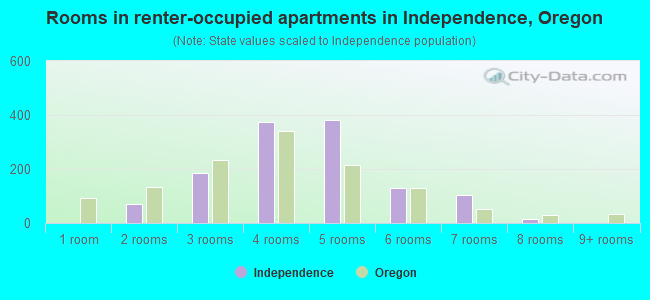
- Rooms in renter-occupied apartments in Independence, Oregon
- 01 room
- 692 rooms
- 1843 rooms
- 3744 rooms
- 3825 rooms
- 1316 rooms
- 1047 rooms
- 148 rooms
- 09+ rooms
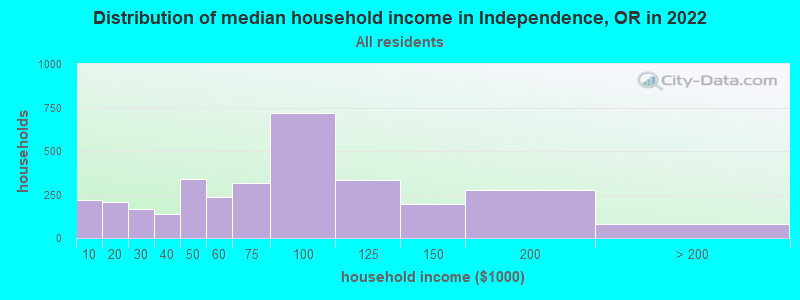
Independence, OR household income distribution

- 218Less than $10,000
- 209$10,000 to $19,999
- 167$20,000 to $29,999
- 138$30,000 to $39,999
- 341$40,000 to $49,999
- 236$50,000 to $59,999
- 316$60,000 to $74,999
- 716$75,000 to $99,999
- 333$100,000 to $124,999
- 194$125,000 to $149,999
- 276$150,000 to $199,999
- 81$200,000 or more
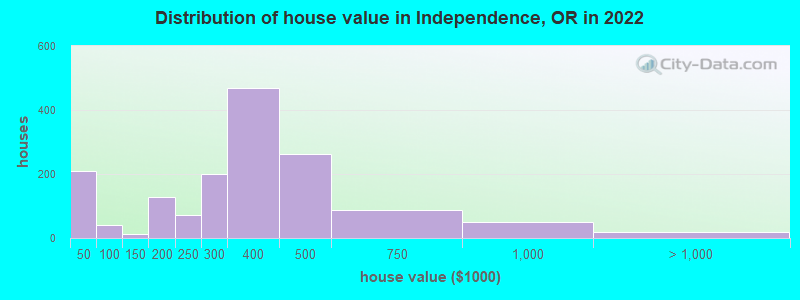
Home value of owner - occupied houses in 2022 in Independence, OR
-
- 137Less than $10,000
- 8$10,000 to $14,999
- 13$20,000 to $24,999
- 11$25,000 to $29,999
- 33$35,000 to $39,999
- 4$40,000 to $49,999
- 24$50,000 to $59,999
- 12$90,000 to $99,999
- 13$100,000 to $124,999
- 57$150,000 to $174,999
- 72$175,000 to $199,999
- 71$200,000 to $249,999
- 201$250,000 to $299,999
- 468$300,000 to $399,999
- 261$400,000 to $499,999
- 86$500,000 to $749,999
- 51$750,000 to $999,999
- 20$1,000,000 to $1,499,999
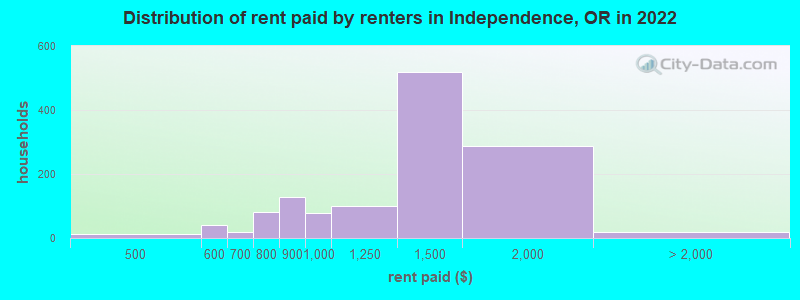
Rent paid by renters in 2022 in Independence, OR
-
- 13$400 to $449
- 17$500 to $549
- 24$550 to $599
- 17$650 to $699
- 82$750 to $799
- 127$800 to $899
- 78$900 to $999
- 99$1,000 to $1,249
- 518$1,250 to $1,499
- 288$1,500 to $1,999
- 18No cash rent
Percentage of workers working in this county: 51.1%
Number of people working at home: 757 (14.2% of all workers)
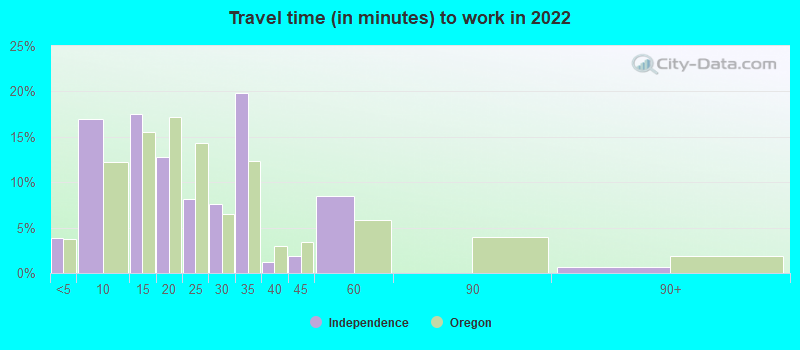
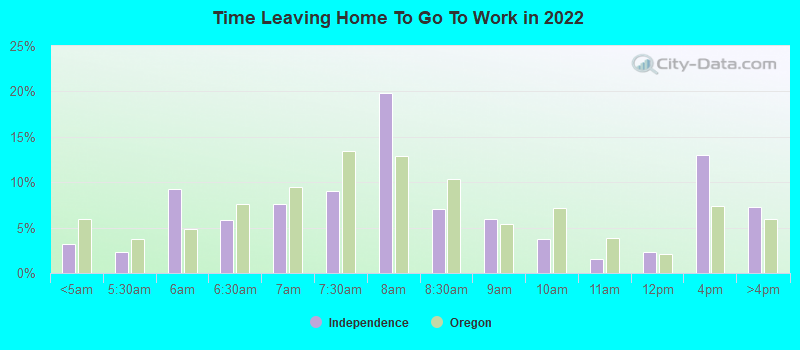
Travel time to work (commute)
- Less than 5 minutes: 202
- 5 to 9 minutes: 388
- 10 to 14 minutes: 461
- 15 to 19 minutes: 479
- 20 to 24 minutes: 445
- 25 to 29 minutes: 794
- 30 to 34 minutes: 1,096
- 35 to 39 minutes: 384
- 40 to 44 minutes: 95
- 45 to 59 minutes: 190
- 60 to 89 minutes: 113
- 90 or more minutes: 40
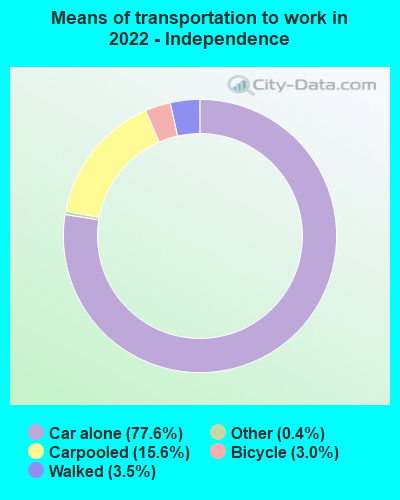
Means of transportation to work:
- Drove a car alone: 2,074 (61.3%)
- Carpooled: 422 (12.5%)
- Taxi: 12 (0.4%)
- Bicycle: 66 (1.9%)
- Walked: 103 (3.0%)
- Worked at home: 757 (22.4%)
- Unemployment by race in 2022
- Unemployment rate for White non-Hispanic residents
- 1.9%Males
- 1.5%Females
- Unemployment rate for other race residents
- 1.6%Males
- 11.7%Females
- Unemployment rate for Hispanic or Latino residents
- 0.5%Males
- 16.5%Females
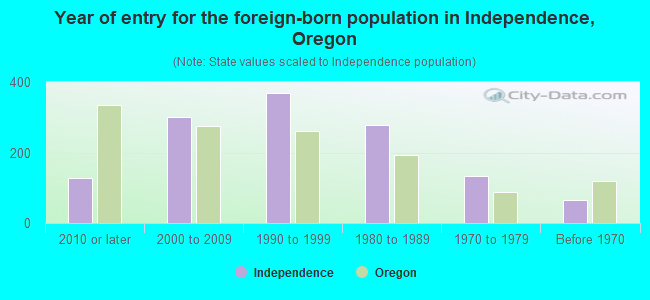
- Year of entry for the foreign-born population in Independence, Oregon
- 1292010 or later
- 3022000 to 2009
- 3681990 to 1999
- 2771980 to 1989
- 1321970 to 1979
- 64Before 1970
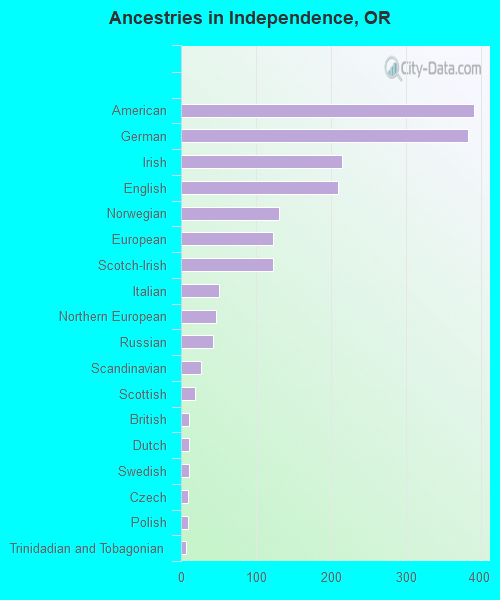
First ancestries reported:
- American: 391 (7.7%)
- German: 383 (7.5%)
- Irish: 215 (4.2%)
- English: 209 (4.1%)
- Norwegian: 131 (2.6%)
- European: 122 (2.4%)
- Scotch-Irish: 122 (2.4%)
- Italian: 51 (1.0%)
- Northern European: 47 (0.9%)
- Russian: 43 (0.8%)
- Scandinavian: 27 (0.5%)
- Scottish: 18 (0.4%)
- British: 10 (0.2%)
- Dutch: 10 (0.2%)
- Swedish: 10 (0.2%)
- Czech: 9 (0.2%)
- Polish: 9 (0.2%)
- Trinidadian and Tobagonian: 6 (0.1%)
- Hungarian: 2 (0.04%)
- Welsh: 2 (0.04%)
Most common places of birth for foreign-born residents (%):
| Independence: | 90.0% (913) |
| Oregon: | 33.9% (140,109) |
| Independence: | 6.4% (65) |
| Oregon: | 0.2% (931) |
| Independence: | 2.0% (20) |
| Oregon: | 1.5% (6,313) |
| Independence: | 1.9% (19) |
| Oregon: | 1.9% (8,005) |
| Independence: | 1.8% (18) |
| Oregon: | 0.6% (2,667) |
Place of birth for U.S.-born residents:
- This state: 5,162
- Other state: 3,750
- Northeast: 106
- Midwest: 357
- South: 604
- West: 2,721
86.6% of Independence residents lived in the same house 1 years ago.
Out of people who lived in different houses, 32.4% lived in this county.
Out of people who lived in different counties, 84.8% lived in Oregon.
| Independence: | 86.6% |
| State average: | 85.5% |
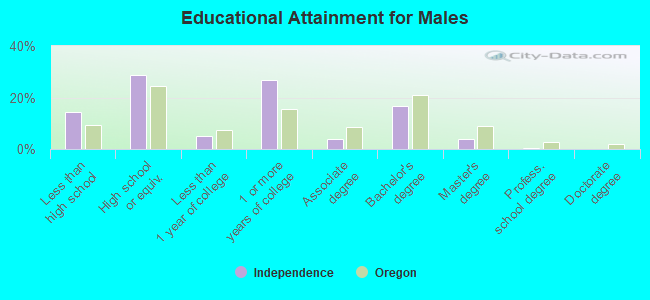
Education attainment for males 25 years and older:
- No schooling: 156
- Nursery to 4th grade: 0
- 5th and 6th grade: 59
- 7th and 8th grade: 33
- 9th grade: 102
- 10th grade: 18
- 11th grade: 17
- 12th grade, no diploma: 38
- High school graduate (or equivalency): 838
- Less than 1 year of college: 147
- Some college more than 1 year, no degree: 792
- Associate degree: 115
- Bachelor's degree: 491
- Master's degree: 110
- Professional school degree: 16
- Doctorate degree: 3
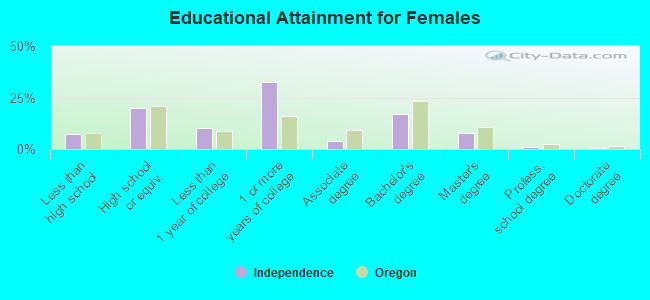
Education attainment for females 25 years and older:
- No schooling: 17
- Nursery to 4th grade: 0
- 5th and 6th grade: 24
- 7th and 8th grade: 13
- 9th grade: 43
- 10th grade: 54
- 11th grade: 1
- 12th grade, no diploma: 53
- High school graduate (or equivalency): 547
- Less than 1 year of college: 285
- Some college more than 1 year, no degree: 896
- Associate degree: 101
- Bachelor's degree: 470
- Master's degree: 211
- Professional school degree: 25
- Doctorate degree: 8
Housing units in structures:
- One, detached: 1,786
- One, attached: 124
- Two: 301
- 3 or 4: 99
- 5 to 9: 182
- 10 to 19: 95
- 20 to 49: 105
- 50 or more: 183
- Mobile homes: 122
- Boats, RVs, vans, etc.: 142
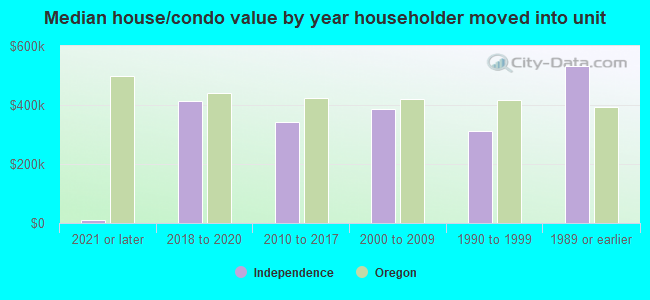
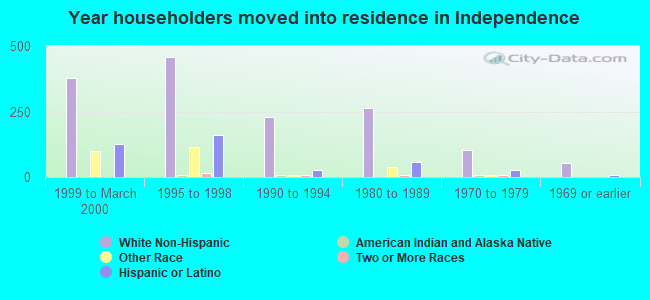
House/condo owner moved in on average 11 years ago
Renter moved in on average 2 years ago
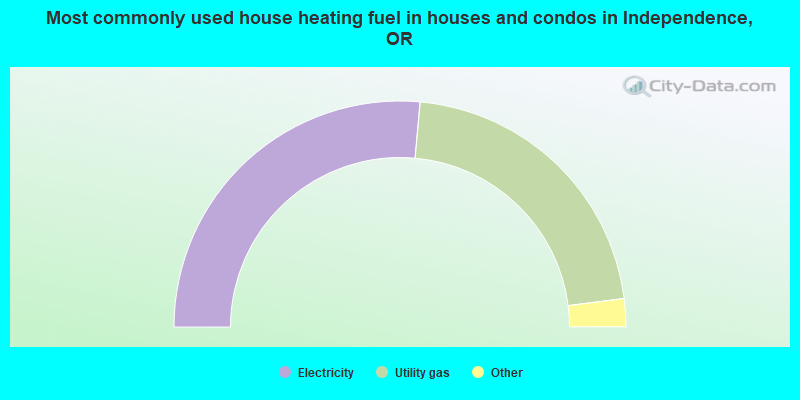
- 52.9%Electricity
- 43.2%Utility gas
- 2.2%Bottled, tank, or LP gas
- 1.7%Wood
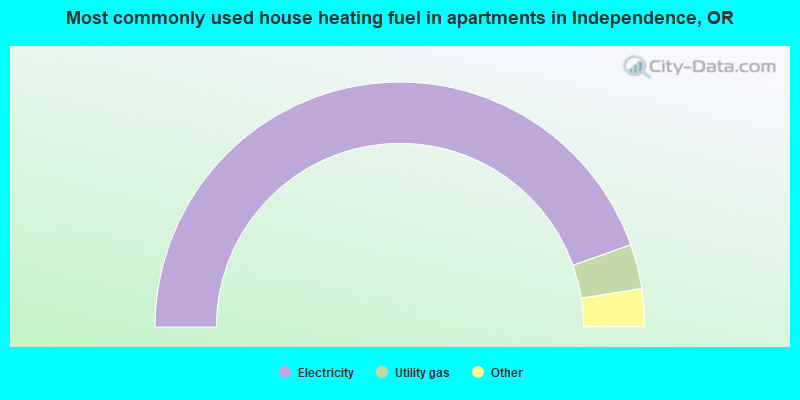
- 89.1%Electricity
- 5.9%Utility gas
- 3.8%Bottled, tank, or LP gas
- 1.2%Wood
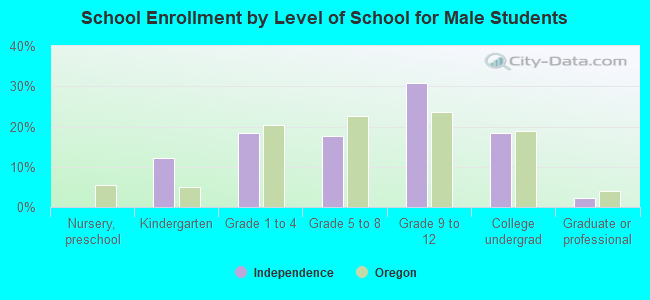
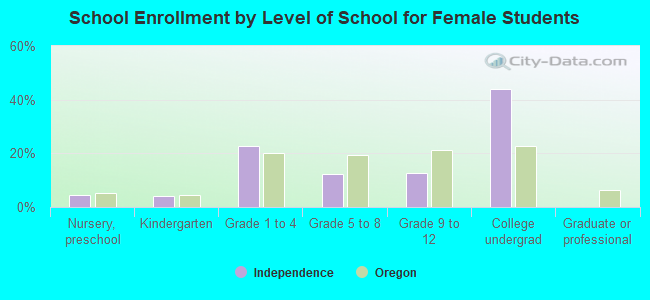
Private vs. public school enrollment:
| Here: | 6.0% |
| Oregon: | 13.7% |
| Here: | 1.1% |
| Oregon: | 8.8% |
| Here: | 10.3% |
| Oregon: | 17.7% |