Indian Wells, CA (California) Houses and Residents
| Indian Wells: | $1,129,277 |
| California: | $715,900 |
Total population: 5,219 (Urban population: 3,056, Rural population: 736 (all nonfarm))
Houses: 5,499 (2,630 occupied: 2,062 owner occupied, 585 renter occupied)
| % of renters here: | 22% |
| State: | 44% |
Housing density: 416 houses/condos per square mile
Median price asked for vacant for-sale houses and condos in 2022: $1,212,035.
Median contract rent in 2022: $754 (lower quartile is $657, upper quartile is $923)
Median rent asked for vacant for-rent units in 2022: $2,703
Median gross rent in Indian Wells, CA in 2022: $899
Housing units in Indian Wells with a mortgage: 841 (56 second mortgage, 0 home equity loan, 64 both second mortgage and home equity loan)
Houses without a mortgage: 0
Median household income for houses/condos with a mortgage: $148,059
Median household income for apartments without a mortgage: $168,480
Median monthly housing costs: $2,125
Compare current foreclosures near Indian Wells, CA:
| Photo | Address | Area | Beds / Baths | Price | Details |
|---|---|---|---|---|---|

|
#1
Seminole Rd
Indian Wells, CA 92210
|
1,716 sq. feet
|
2 baths 2 beds |
show details | |

|
#2
N Arcadia Ct Apt B209
Palm Springs, CA 92262
|
589 sq. feet
|
1 baths 1 beds |
show details | |

|
#3
Desert Greens Dr N
Palm Desert, CA 92260
|
1,500 sq. feet
|
2 baths 3 beds |
show details | |

|
#4
Buena Cir
Palm Desert, CA 92260
|
886 sq. feet
|
1 baths 2 beds |
show details | |

|
#5
Avenida Juarez
Cathedral City, CA 92234
|
1,698 sq. feet
|
2 baths 4 beds |
show details | |

|
#6
Panorama Rd
Cathedral City, CA 92234
|
1,971 sq. feet
|
2 baths 3 beds |
show details | |

|
#7
Palo Verde St
Indio, CA 92201
|
1,026 sq. feet
|
2 baths 3 beds |
show details | |

|
#8
Sunningdale Dr
Rancho Mirage, CA 92270
|
2,010 sq. feet
|
2 baths 2 beds |
show details | |

|
#9
Landau Blvd Apt
Cathedral City, CA 92234
|
1,017 sq. feet
|
2 baths 2 beds |
show details | |

|
#10
Stillwater Dr
La Quinta, CA 92253
|
3,589 sq. feet
|
5 baths 5 beds |
show details |
| Photo | Address | Area | Beds / Baths | Price | Details |
|---|---|---|---|---|---|

|
#11
Esperanza Trl
Palm Springs, CA 92262
|
2,637 sq. feet
|
2 baths 2 beds |
show details | |

|
#12
Apache St
Indio, CA 92203
|
936 sq. feet
|
1 baths 3 beds |
show details | |

|
#13
W Panorama Rd
Palm Springs, CA 92262
|
3,852 sq. feet
|
3 baths 4 beds |
show details | |

|
#14
Rocio Ct
Palm Desert, CA 92260
|
3,001 sq. feet
|
2 baths 3 beds |
show details | |

|
#15
Avenue 76
Thermal, CA 92274
|
- sq. feet
|
2 baths 3 beds |
show details | |

|
#16
Toscana Way W
Rancho Mirage, CA 92270
|
4,159 sq. feet
|
5 baths 4 beds |
show details | |

|
#17
Cray Mill Dr
Indio, CA 92203
|
1,841 sq. feet
|
2 baths 3 beds |
show details | |

|
#18
Florida Ave
Palm Desert, CA 92211
|
1,380 sq. feet
|
3 baths 2 beds |
show details | |

|
#19
Garbino Rd
Cathedral City, CA 92234
|
1,502 sq. feet
|
2 baths 3 beds |
show details | |

|
#20
Calle Helene
Thousand Palms, CA 92276
|
960 sq. feet
|
2 baths 3 beds |
show details |
| Photo | Address | Area | Beds / Baths | Price | Details |
|---|---|---|---|---|---|

|
#21
Amy Cir
Cathedral City, CA 92234
|
1,853 sq. feet
|
2 baths 3 beds |
show details | |

|
#22
Stagecoach Rd
Indio, CA 92203
|
2,749 sq. feet
|
3 baths 4 beds |
show details | |

|
#23
S Paseo Laredo
Cathedral City, CA 92234
|
1,440 sq. feet
|
2 baths 3 beds |
show details | |

|
#24
Adare Ct
Indio, CA 92203
|
2,107 sq. feet
|
4 baths 4 beds |
show details | |

|
#25
Junipero St
Indio, CA 92201
|
1,032 sq. feet
|
2 baths 3 beds |
show details | |

|
#26
Wimbledon Cir
Rancho Mirage, CA 92270
|
1,985 sq. feet
|
2 baths 2 beds |
show details | |

|
#27
Pebble Bch
La Quinta, CA 92253
|
2,895 sq. feet
|
4 baths 2 beds |
show details | |

|
#28
Conner Pl
Indio, CA 92203
|
2,694 sq. feet
|
3 baths 4 beds |
show details | |

|
#29
Cumbres Ct
Cathedral City, CA 92234
|
851 sq. feet
|
2 baths 1 beds |
show details | |

|
#30
Cray Mill Dr
Indio, CA 92203
|
1,841 sq. feet
|
2 baths 3 beds |
show details |
| Photo | Address | Area | Beds / Baths | Price | Details |
|---|---|---|---|---|---|

|
#31
Via Valverde
Cathedral City, CA 92234
|
1,344 sq. feet
|
2 baths 3 beds |
show details | |

|
#32
Lincoln Dr
Indio, CA 92201
|
1,507 sq. feet
|
2 baths 2 beds |
show details | |

|
#33
Capri St
Rancho Mirage, CA 92270
|
1,640 sq. feet
|
2 baths 2 beds |
show details | |

|
#34
Priscilla Ct
Indio, CA 92201
|
1,276 sq. feet
|
2 baths 3 beds |
show details | |

|
#35
San Luis Rey Dr
Cathedral City, CA 92234
|
1,048 sq. feet
|
1 baths 1 beds |
show details | |

|
#36
Vista Chino
Cathedral City, CA 92234
|
972 sq. feet
|
1 baths 2 beds |
show details | |

|
#37
Orange Grove Ave
Indio, CA 92201
|
1,088 sq. feet
|
1 baths 3 beds |
show details | |

|
#38
Mountain View Ave
Indio, CA 92201
|
2,066 sq. feet
|
4 baths 5 beds |
show details | |

|
#39
Westchester Dr
Thousand Palms, CA 92276
|
1,152 sq. feet
|
2 baths 2 beds |
show details | |

|
#40
San Capistrano Dr
Coachella, CA 92236
|
2,653 sq. feet
|
4 baths 6 beds |
show details |
| Photo | Address | Area | Beds / Baths | Price | Details |
|---|---|---|---|---|---|

|
#41
Desert Princess Dr
Cathedral City, CA 92234
|
1,212 sq. feet
|
2 baths 2 beds |
show details | |

|
#42
King St
Indio, CA 92201
|
1,791 sq. feet
|
2 baths 2 beds |
show details | |

|
#43
Bradshaw Ln
Palm Springs, CA 92262
|
960 sq. feet
|
2 baths 2 beds |
show details | |

|
#44
Mottle Cir
Rancho Mirage, CA 92270
|
1,850 sq. feet
|
3 baths 4 beds |
show details | |

|
#45
Camino Vida
Palm Springs, CA 92264
|
1,967 sq. feet
|
2 baths 2 beds |
show details | |

|
#46
Melanita Dr
Cathedral City, CA 92234
|
1,435 sq. feet
|
2 baths 4 beds |
show details | |

|
#47
Medano Rd
Cathedral City, CA 92234
|
1,739 sq. feet
|
2 baths 3 beds |
show details | |

|
#48
Desert West Dr
Rancho Mirage, CA 92270
|
2,420 sq. feet
|
3 baths 3 beds |
show details | |

|
#49
Zuni Ct
Indio, CA 92203
|
1,056 sq. feet
|
2 baths 3 beds |
show details | |

|
Check over 1 million property listings on Foreclosure.com!
|
browse all offers | |||


Median year apartment built: 1996
Household type by relationship:
Households: 4,920- Male householders: 1,240 (275 living alone), Female householders: 1,387 (564 living alone)
1,355 spouses (1,314 opposite-sex spouses), 235 unmarried partners, (223 opposite-sex unmarried partners), 406 children (395 natural, 3 adopted, 8 stepchildren), 107 grandchildren, 16 brothers or sisters, 76 parents, 0 foster children, 39 other relatives, 44 non-relatives
- In group quarters: 10
Size of family households: 1,346 2-persons, 49 3-persons, 76 4-persons, 11 5-persons, 12 6-persons, 22 7-or-more-persons.
Size of nonfamily households: 814 1-person, 280 2-persons.
262 married couples with children.
4 single-parent households (0 men, 4 women).
94.9% of residents of Indian Wells speak English at home.
1.3% of residents speak Spanish at home (100% speak English very well).
2.4% of residents speak other Indo-European language at home (78% speak English very well, 22% speak English well).
2.2% of residents speak Asian or Pacific Island language at home (52% speak English very well, 23% speak English well, 24% speak English not well).
Foreign born population: 402 (8.2%)
(51.0% of them are naturalized citizens)
| Here: | 6.3 |
| State: | 6.0 |
| Here: | 3.2 |
| State: | 3.9 |

- Bedrooms in owner-occupied houses and condos in Indian Wells, California
- 0no bedroom
- 661 bedroom
- 2802 bedrooms
- 1,1453 bedrooms
- 4924 bedrooms
- 795+ bedrooms

- Bedrooms in renter-occupied apartments in Indian Wells, California
- 0no bedroom
- 4171 bedroom
- 1242 bedrooms
- 283 bedrooms
- 174 bedrooms
- 05+ bedrooms

- Cars and other vehicles available in Indian Wells in owner-occupied houses/condos
- 44no vehicle
- 7221 vehicle
- 1,0872 vehicles
- 1503 vehicles
- 484 vehicles
- 115+ vehicles

- Cars and other vehicles available in Indian Wells in renter-occupied apartments
- 13no vehicle
- 3631 vehicle
- 2012 vehicles
- 83 vehicles
- 04 vehicles
- 05+ vehicles

- Rooms in owner-occupied houses in Indian Wells, California
- 01 room
- 272 rooms
- 133 rooms
- 1654 rooms
- 4455 rooms
- 4346 rooms
- 4067 rooms
- 1888 rooms
- 3849+ rooms

- Rooms in renter-occupied apartments in Indian Wells, California
- 01 room
- 872 rooms
- 3023 rooms
- 1144 rooms
- 545 rooms
- 66 rooms
- 177 rooms
- 08 rooms
- 59+ rooms


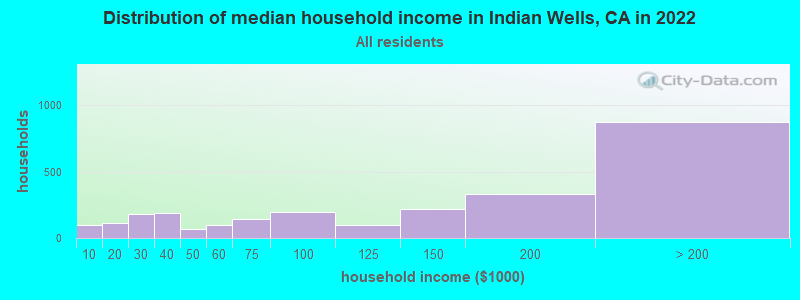
Indian Wells, CA household income distribution

- 100Less than $10,000
- 115$10,000 to $19,999
- 182$20,000 to $29,999
- 191$30,000 to $39,999
- 66$40,000 to $49,999
- 97$50,000 to $59,999
- 146$60,000 to $74,999
- 194$75,000 to $99,999
- 97$100,000 to $124,999
- 218$125,000 to $149,999
- 332$150,000 to $199,999
- 874$200,000 or more
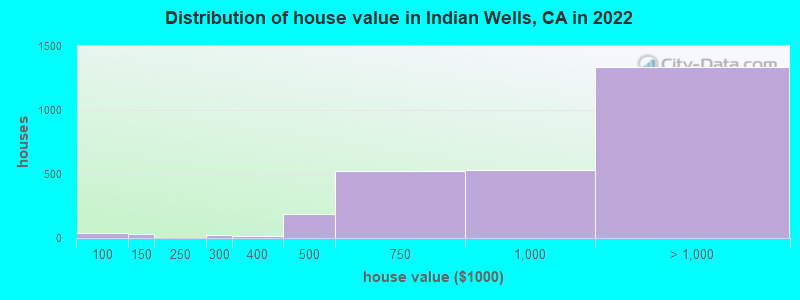
Home value of owner - occupied houses in 2022 in Indian Wells, CA
-
- 36$60,000 to $69,999
- 5$80,000 to $89,999
- 33$125,000 to $149,999
- 20$250,000 to $299,999
- 18$300,000 to $399,999
- 191$400,000 to $499,999
- 526$500,000 to $749,999
- 533$750,000 to $999,999
- 704$1,000,000 to $1,499,999
- 182$1,500,000 to $1,999,999
- 450$2,000,000 or more
Rent paid by renters in 2022 in Indian Wells, CA
-
- 131$600 to $649
- 46$650 to $699
- 110$700 to $749
- 5$750 to $799
- 77$800 to $899
- 16$900 to $999
- 16$1,000 to $1,249
- 20$1,250 to $1,499
- 3$1,500 to $1,999
- 17$2,500 to $2,999
- 10$3,500 or more
- 195No cash rent


Percentage of workers working in this county: 84.4%
Number of people working at home: 603 (34.7% of all workers)
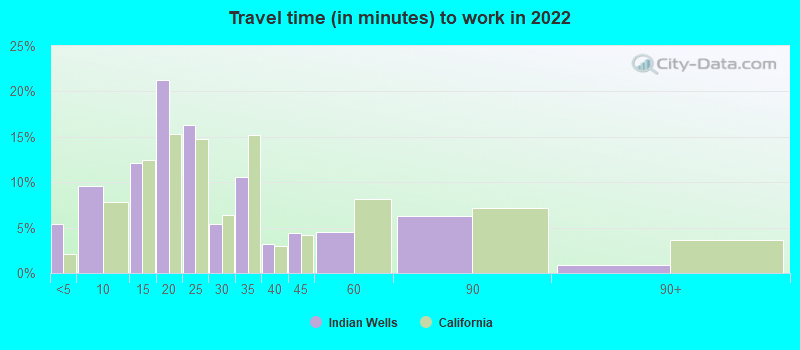
Travel time to work (commute)
- Less than 5 minutes: 217
- 5 to 9 minutes: 127
- 10 to 14 minutes: 142
- 15 to 19 minutes: 262
- 20 to 24 minutes: 88
- 25 to 29 minutes: 172
- 30 to 34 minutes: 43
- 35 to 39 minutes: 0
- 40 to 44 minutes: 31
- 45 to 59 minutes: 42
- 60 to 89 minutes: 43
- 90 or more minutes: 56

Means of transportation to work:
- Drove a car alone: 3,324 (66.6%)
- Carpooled: 794 (15.9%)
- Taxi: 85 (1.7%)
- Bicycle: 14 (0.3%)
- Walked: 170 (3.4%)
- Worked at home: 603 (12.1%)

- Unemployment by race in 2022
- Unemployment rate for White non-Hispanic residents
- 2.4%Males
- 5.0%Females
- Unemployment rate for other race residents
- 100.0%Females
- Unemployment rate for two or more race residents
- 29.8%Females
- Unemployment rate for Hispanic or Latino residents
- 35.4%Males
- 41.9%Females

- Year of entry for the foreign-born population in Indian Wells, California
- 892010 or later
- 432000 to 2009
- 631990 to 1999
- 391980 to 1989
- 611970 to 1979
- 150Before 1970

First ancestries reported:
- English: 410 (16.9%)
- Irish: 213 (8.8%)
- Italian: 196 (8.1%)
- American: 155 (6.4%)
- German: 148 (6.1%)
- Scottish: 144 (5.9%)
- Canadian: 71 (2.9%)
- Polish: 70 (2.9%)
- European: 47 (1.9%)
- Russian: 46 (1.9%)
- Greek: 45 (1.9%)
- Serbian: 41 (1.7%)
- French: 39 (1.6%)
- Norwegian: 38 (1.6%)
- Dutch: 29 (1.2%)
- Yugoslavian: 18 (0.7%)
- Iranian: 17 (0.7%)
- Danish: 15 (0.6%)
- Scandinavian: 15 (0.6%)
- British: 11 (0.5%)
- Scotch-Irish: 11 (0.5%)
- Swedish: 11 (0.5%)
- Swiss: 10 (0.4%)
- Austrian: 9 (0.4%)
- Northern European: 9 (0.4%)
- Eastern European: 8 (0.3%)
- Welsh: 6 (0.2%)
- Armenian: 5 (0.2%)
- Czechoslovakian: 3 (0.1%)
Most common places of birth for foreign-born residents (%):
| Indian Wells: | 30.8% (124) |
| California: | 1.2% (127,477) |
| Indian Wells: | 14.9% (60) |
| California: | 7.8% (818,297) |
| Indian Wells: | 10.4% (42) |
| California: | 0.6% (57,953) |
| Indian Wells: | 8.0% (32) |
| California: | 0.6% (60,582) |
| Indian Wells: | 4.0% (16) |
| California: | 2.0% (206,004) |
| Indian Wells: | 3.0% (12) |
| California: | 0.2% (16,042) |
| Indian Wells: | 3.0% (12) |
| California: | 0.2% (20,997) |
| Indian Wells: | 3.0% (12) |
| California: | 6.6% (684,672) |
| Indian Wells: | 2.7% (11) |
| California: | 0.4% (39,097) |
| Indian Wells: | 2.5% (10) |
| California: | 0.1% (12,623) |
| Indian Wells: | 2.5% (10) |
| California: | 37.2% (3,881,193) |
| Indian Wells: | 1.7% (7) |
| California: | 0.3% (31,439) |
| Indian Wells: | 1.7% (7) |
| California: | 0.2% (23,338) |
Place of birth for U.S.-born residents:
- This state: 1,616
- Other state: 2,669
- Northeast: 742
- Midwest: 1,014
- South: 434
- West: 488
82.8% of Indian Wells residents lived in the same house 1 years ago.
Out of people who lived in different houses, 21.0% lived in this county.
Out of people who lived in different counties, 55.5% lived in California.
| Indian Wells: | 82.8% |
| State average: | 88.9% |
Education attainment for males 25 years and older:
- No schooling: 13
- Nursery to 4th grade: 11
- 5th and 6th grade: 0
- 7th and 8th grade: 7
- 9th grade: 0
- 10th grade: 0
- 11th grade: 3
- 12th grade, no diploma: 7
- High school graduate (or equivalency): 218
- Less than 1 year of college: 86
- Some college more than 1 year, no degree: 171
- Associate degree: 263
- Bachelor's degree: 633
- Master's degree: 497
- Professional school degree: 242
- Doctorate degree: 79

Education attainment for females 25 years and older:
- No schooling: 14
- Nursery to 4th grade: 2
- 5th and 6th grade: 11
- 7th and 8th grade: 0
- 9th grade: 11
- 10th grade: 0
- 11th grade: 0
- 12th grade, no diploma: 16
- High school graduate (or equivalency): 422
- Less than 1 year of college: 105
- Some college more than 1 year, no degree: 293
- Associate degree: 304
- Bachelor's degree: 655
- Master's degree: 460
- Professional school degree: 103
- Doctorate degree: 82


Housing units in structures:
- One, detached: 3,378
- One, attached: 1,275
- Two: 193
- 3 or 4: 154
- 5 to 9: 152
- 20 to 49: 13
- 50 or more: 278
- Mobile homes: 51
Housing units lacking complete kitchen facilities in 2022: 1.9%
House/condo owner moved in on average 8 years ago
Renter moved in on average 6 years ago

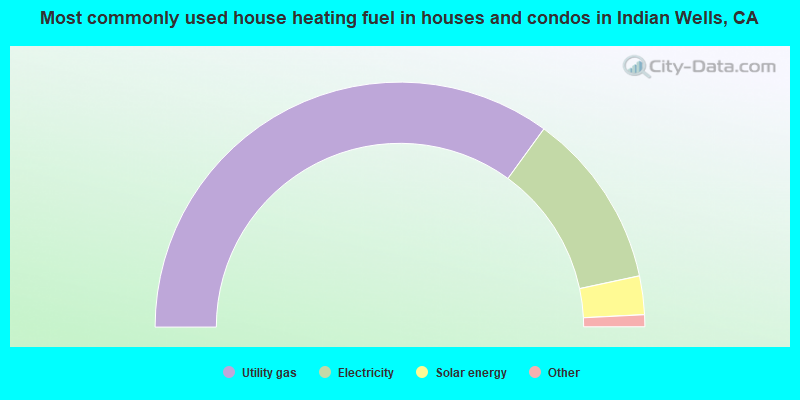
- 70.0%Utility gas
- 23.3%Electricity
- 5.1%Solar energy
- 0.8%Bottled, tank, or LP gas
- 0.7%Wood
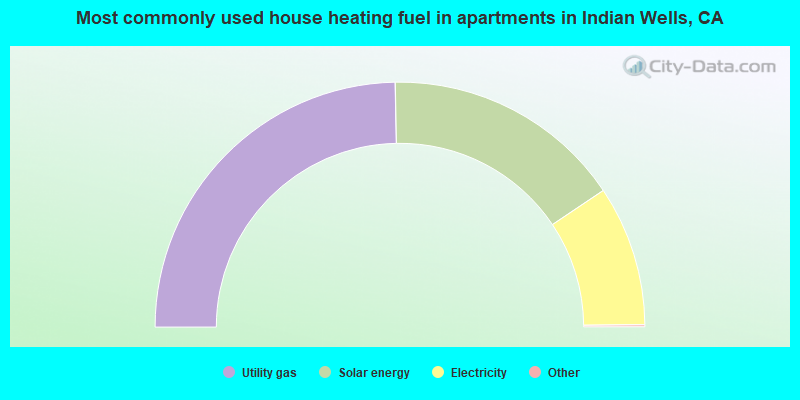
- 49.6%Utility gas
- 31.9%Solar energy
- 18.6%Electricity
Private vs. public school enrollment:
| Here: | 20.6% |
| California: | 10.5% |
| Here: | 9.3% |
| California: | 8.5% |
| Here: | 8.7% |
| California: | 15.9% |


