Indianola, IA (Iowa) Houses and Residents
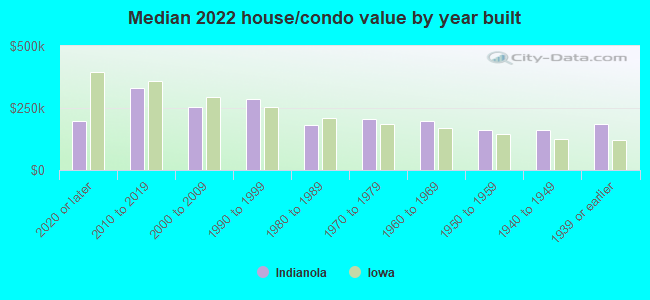
| Indianola: | $220,961 |
| Iowa: | $194,600 |
Total population: 15,305 (Urban population: 12,941 (all inside urban clusters), Rural population: 28 (6 farm, 22 nonfarm))
Houses: 6,471 (6,033 occupied: 4,094 owner occupied, 2,037 renter occupied)
| % of renters here: | 33% |
| State: | 28% |
Housing density: 704 houses/condos per square mile
Median price asked for vacant for-sale houses and condos in 2022: $278,509.
Median contract rent in 2022: $770 (lower quartile is $633, upper quartile is $968)
Median rent asked for vacant for-rent units in 2022: $1,184
Median gross rent in Indianola, IA in 2022: $891
Housing units in Indianola with a mortgage: 2,790 (363 second mortgage, 0 home equity loan, 288 both second mortgage and home equity loan)
Houses without a mortgage: 96
Median household income for houses/condos with a mortgage: $103,280
Median household income for apartments without a mortgage: $73,409
Median monthly housing costs: $1,044
Compare current foreclosures near Indianola, IA:
| Photo | Address | Area | Beds / Baths | Price | Details |
|---|---|---|---|---|---|

|
#1
W Salem Ave
Indianola, IA 50125
|
- sq. feet
|
1 baths 3 beds |
$147,000
|
show details |

|
#2
S F St
Indianola, IA 50125
|
888 sq. feet
|
1 baths 3 beds |
show details | |

|
#3
E Kentucky Ave
Indianola, IA 50125
|
1,178 sq. feet
|
3 baths 3 beds |
show details | |

|
#4
W Boston Ave
Indianola, IA 50125
|
1,238 sq. feet
|
1 baths 3 beds |
show details | |

|
#5
N D St
Indianola, IA 50125
|
997 sq. feet
|
2 baths 2 beds |
show details | |

|
#6
S 4th St
Indianola, IA 50125
|
1,800 sq. feet
|
3 baths 3 beds |
show details | |

|
#7
W 4th Ave Apt 109
Indianola, IA 50125
|
- sq. feet
|
- baths - beds |
show details | |

|
#8
N 9th St
Indianola, IA 50125
|
- sq. feet
|
- baths - beds |
show details | |

|
#9
W 1st Ave
Indianola, IA 50125
|
- sq. feet
|
- baths - beds |
show details | |

|
#10
N 6th St # 8
Indianola, IA 50125
|
- sq. feet
|
- baths - beds |
show details |
| Photo | Address | Area | Beds / Baths | Price | Details |
|---|---|---|---|---|---|

|
#11
73rd Ave
Indianola, IA 50125
|
- sq. feet
|
- baths - beds |
show details | |

|
#12
N 14th St Apt 1
Indianola, IA 50125
|
- sq. feet
|
- baths - beds |
show details | |

|
#13
SW 13th St
Des Moines, IA 50315
|
620 sq. feet
|
1 baths 1 beds |
$154,900
|
show details |

|
#14
E Diehl Ave
Des Moines, IA 50320
|
1,796 sq. feet
|
4 baths 5 beds |
$339,900
|
show details |

|
#15
SE 8th St
Des Moines, IA 50315
|
1,008 sq. feet
|
1 baths 2 beds |
$234,900
|
show details |

|
#16
SW 5th St
Des Moines, IA 50315
|
730 sq. feet
|
1 baths 2 beds |
$169,900
|
show details |

|
#17
E 36th St
Des Moines, IA 50317
|
1,026 sq. feet
|
1 baths 2 beds |
$204,900
|
show details |

|
#18
Easton Blvd
Des Moines, IA 50317
|
824 sq. feet
|
1 baths 2 beds |
$199,500
|
show details |

|
#19
E 23rd St
Des Moines, IA 50317
|
829 sq. feet
|
1 baths 2 beds |
show details | |

|
#20
30th Ave
Norwalk, IA 50211
|
1,228 sq. feet
|
2 baths 4 beds |
show details |
| Photo | Address | Area | Beds / Baths | Price | Details |
|---|---|---|---|---|---|

|
#21
41st St
Des Moines, IA 50312
|
992 sq. feet
|
2 baths 2 beds |
show details | |

|
#22
Chicago Ave
Des Moines, IA 50317
|
840 sq. feet
|
1 baths 3 beds |
show details | |

|
#23
E Elm St
Milo, IA 50166
|
1,008 sq. feet
|
2 baths 3 beds |
show details | |

|
#24
SW 7th St
Des Moines, IA 50315
|
856 sq. feet
|
1 baths 2 beds |
show details | |

|
#25
Fairfax St
Norwalk, IA 50211
|
1,288 sq. feet
|
3 baths 3 beds |
show details | |

|
#26
E Walnut St
Des Moines, IA 50317
|
968 sq. feet
|
1 baths 3 beds |
show details | |

|
#27
SE Powers Dr
Runnells, IA 50237
|
2,767 sq. feet
|
3 baths 3 beds |
show details | |

|
#28
E Elm St
Des Moines, IA 50317
|
1,070 sq. feet
|
1 baths 3 beds |
show details | |

|
#29
Scott Ave
Des Moines, IA 50317
|
1,136 sq. feet
|
1 baths 3 beds |
show details | |

|
#30
East St
New Virginia, IA 50210
|
1,344 sq. feet
|
2 baths 3 beds |
show details |
| Photo | Address | Area | Beds / Baths | Price | Details |
|---|---|---|---|---|---|

|
#31
W Clark St
Pleasantville, IA 50225
|
936 sq. feet
|
1 baths 2 beds |
show details | |

|
#32
E Thornton Ave
Des Moines, IA 50315
|
1,091 sq. feet
|
1 baths 2 beds |
show details | |

|
#33
Fulton Dr
Des Moines, IA 50315
|
644 sq. feet
|
1 baths 2 beds |
show details | |

|
#34
SW 31st St
Des Moines, IA 50321
|
1,696 sq. feet
|
1 baths 3 beds |
show details | |

|
#35
E Gray St
Des Moines, IA 50315
|
840 sq. feet
|
1 baths 2 beds |
show details | |

|
#36
Casady Dr
Des Moines, IA 50315
|
1,603 sq. feet
|
1 baths 2 beds |
show details | |

|
#37
Fleetwood Dr
Des Moines, IA 50315
|
1,500 sq. feet
|
1 baths 3 beds |
show details | |

|
#38
E Bell Ave
Des Moines, IA 50315
|
1,200 sq. feet
|
1 baths 3 beds |
show details | |

|
#39
S Union St
Des Moines, IA 50315
|
1,332 sq. feet
|
1 baths 3 beds |
show details | |

|
#40
Virginia Cir
Des Moines, IA 50320
|
1,566 sq. feet
|
2 baths 3 beds |
show details |
| Photo | Address | Area | Beds / Baths | Price | Details |
|---|---|---|---|---|---|

|
#41
Orchard Dr
Des Moines, IA 50327
|
984 sq. feet
|
1 baths 3 beds |
show details | |

|
#42
Maple St
West Des Moines, IA 50265
|
864 sq. feet
|
1 baths 2 beds |
show details | |

|
#43
Des Moines St
Des Moines, IA 50317
|
768 sq. feet
|
1 baths 2 beds |
show details | |

|
#44
41st St
Des Moines, IA 50312
|
1,368 sq. feet
|
1 baths 2 beds |
show details | |

|
#45
E 22nd St
Des Moines, IA 50317
|
1,034 sq. feet
|
1 baths 3 beds |
show details | |

|
#46
Kinsey Ave
Des Moines, IA 50317
|
1,002 sq. feet
|
1 baths 3 beds |
show details | |

|
#47
Searle St
Des Moines, IA 50317
|
1,197 sq. feet
|
1 baths 3 beds |
show details | |

|
#48
Indianapolis Ave
Des Moines, IA 50317
|
1,008 sq. feet
|
1 baths 3 beds |
show details | |

|
#49
E 19th St
Des Moines, IA 50316
|
1,322 sq. feet
|
2 baths 3 beds |
show details | |

|
Check over 1 million property listings on Foreclosure.com!
|
browse all offers | |||

Latest news about housing in Indianola, IA collected exclusively by city-data.com from local newspapers, TV, and radio stations

 | Rental HOUSES south of Des Moines (2 replies) |
| Rentals for 1k or less that don't have crazy pet deposits? (7 replies) |
| Moving Recommendations Needed (6 replies) |
| Looking for fresh produce & lower beef prices (6 replies) |
| Retired and moving out of NJ , thinking of Ankeny (19 replies) |
| Ankeny vs. Pella (14 replies) |
Median year apartment built: 1978
Household type by relationship:
Households: 15,903- Male householders: 2,657 (756 living alone), Female householders: 3,308 (1,115 living alone)
2,799 spouses (2,783 opposite-sex spouses), 392 unmarried partners, (364 opposite-sex unmarried partners), 4,724 children (4,545 natural, 34 adopted, 144 stepchildren), 32 grandchildren, 36 brothers or sisters, 93 parents, 0 foster children, 73 other relatives, 306 non-relatives
- In group quarters: 1,480
Size of family households: 1,767 2-persons, 702 3-persons, 745 4-persons, 448 5-persons, 140 6-persons, 57 7-or-more-persons.
Size of nonfamily households: 1,946 1-person, 253 2-persons, 43 3-persons, 9 4-persons.
2,696 married couples with children.
895 single-parent households (325 men, 570 women).
95.5% of residents of Indianola speak English at home.
1.3% of residents speak Spanish at home (88% speak English very well, 3% speak English well, 9% speak English not well).
1.8% of residents speak other Indo-European language at home (54% speak English very well, 43% speak English well, 3% speak English not well).
0.9% of residents speak Asian or Pacific Island language at home (22% speak English very well, 65% speak English well, 13% speak English not well).
Foreign born population: 386 (2.4%)
(79.8% of them are naturalized citizens)
| Here: | 6.5 |
| State: | 6.8 |
| Here: | 4.1 |
| State: | 4.2 |
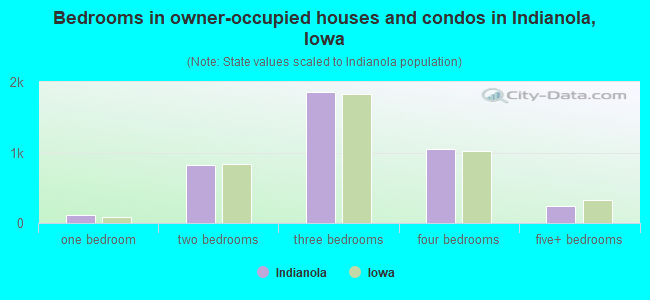
- Bedrooms in owner-occupied houses and condos in Indianola, Iowa
- 11no bedroom
- 1151 bedroom
- 8182 bedrooms
- 1,8593 bedrooms
- 1,0564 bedrooms
- 2355+ bedrooms
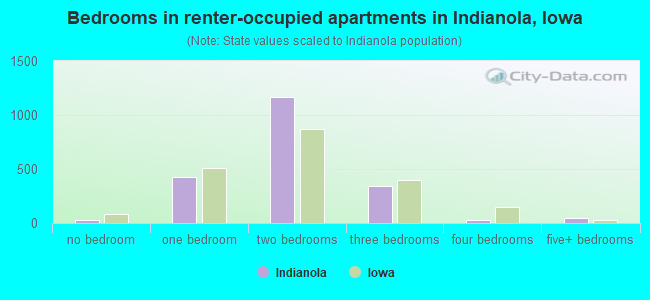
- Bedrooms in renter-occupied apartments in Indianola, Iowa
- 27no bedroom
- 4251 bedroom
- 1,1632 bedrooms
- 3473 bedrooms
- 314 bedrooms
- 455+ bedrooms
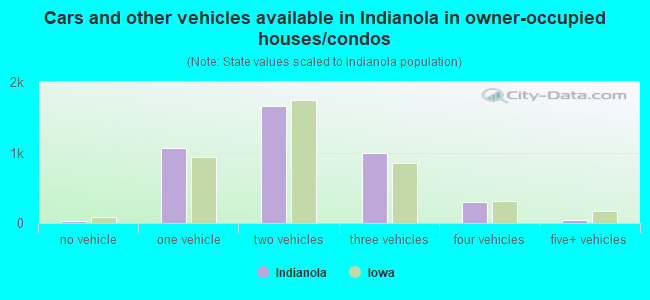
- Cars and other vehicles available in Indianola in owner-occupied houses/condos
- 30no vehicle
- 1,0631 vehicle
- 1,6652 vehicles
- 9893 vehicles
- 3034 vehicles
- 445+ vehicles
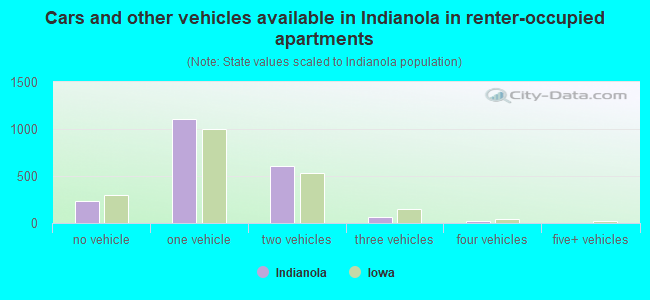
- Cars and other vehicles available in Indianola in renter-occupied apartments
- 232no vehicle
- 1,1071 vehicle
- 6072 vehicles
- 683 vehicles
- 244 vehicles
- 05+ vehicles
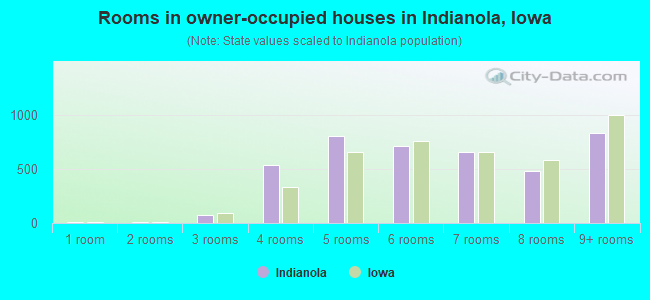
- Rooms in owner-occupied houses in Indianola, Iowa
- 111 room
- 92 rooms
- 763 rooms
- 5314 rooms
- 8025 rooms
- 7066 rooms
- 6527 rooms
- 4788 rooms
- 8299+ rooms
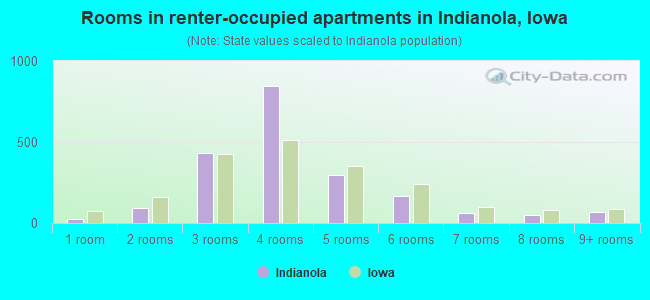
- Rooms in renter-occupied apartments in Indianola, Iowa
- 271 room
- 932 rooms
- 4323 rooms
- 8454 rooms
- 2985 rooms
- 1666 rooms
- 627 rooms
- 478 rooms
- 679+ rooms
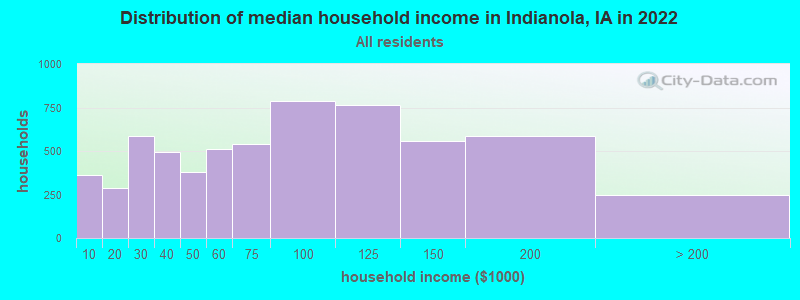
Indianola, IA household income distribution

- 362Less than $10,000
- 286$10,000 to $19,999
- 584$20,000 to $29,999
- 494$30,000 to $39,999
- 378$40,000 to $49,999
- 511$50,000 to $59,999
- 541$60,000 to $74,999
- 788$75,000 to $99,999
- 763$100,000 to $124,999
- 556$125,000 to $149,999
- 587$150,000 to $199,999
- 246$200,000 or more
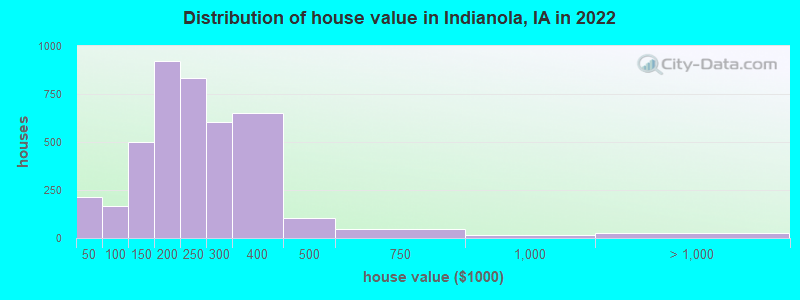
Home value of owner - occupied houses in 2022 in Indianola, IA
-
- 83Less than $10,000
- 35$10,000 to $14,999
- 11$15,000 to $19,999
- 16$20,000 to $24,999
- 35$25,000 to $29,999
- 28$30,000 to $34,999
- 39$50,000 to $59,999
- 60$70,000 to $79,999
- 15$80,000 to $89,999
- 53$90,000 to $99,999
- 168$100,000 to $124,999
- 332$125,000 to $149,999
- 441$150,000 to $174,999
- 482$175,000 to $199,999
- 831$200,000 to $249,999
- 602$250,000 to $299,999
- 652$300,000 to $399,999
- 104$400,000 to $499,999
- 47$500,000 to $749,999
- 17$750,000 to $999,999
- 12$1,000,000 to $1,499,999
- 13$1,500,000 to $1,999,999
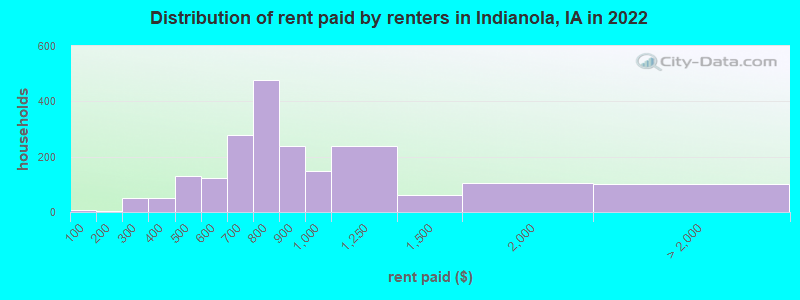
Rent paid by renters in 2022 in Indianola, IA
-
- 8Less than $100
- 4$150 to $199
- 17$200 to $249
- 34$250 to $299
- 51$300 to $349
- 71$400 to $449
- 57$450 to $499
- 72$500 to $549
- 49$550 to $599
- 161$600 to $649
- 115$650 to $699
- 207$700 to $749
- 270$750 to $799
- 236$800 to $899
- 149$900 to $999
- 237$1,000 to $1,249
- 59$1,250 to $1,499
- 104$1,500 to $1,999
- 16$2,000 to $2,499
- 4$2,500 to $2,999
- 7$3,500 or more
- 72No cash rent
Percentage of workers working in this county: 55.4%
Number of people working at home: 927 (12.0% of all workers)
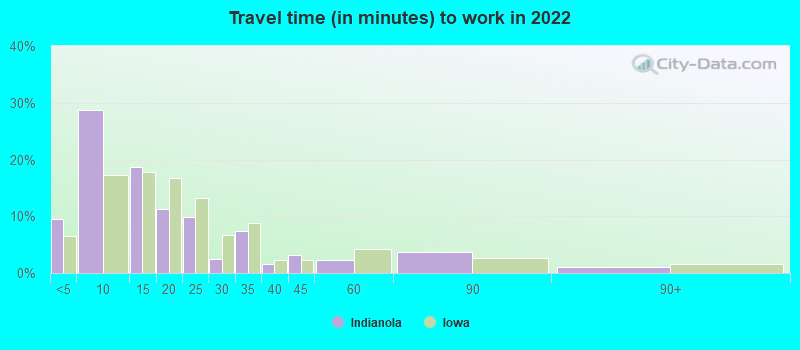
Travel time to work (commute)
- Less than 5 minutes: 545
- 5 to 9 minutes: 1,470
- 10 to 14 minutes: 877
- 15 to 19 minutes: 271
- 20 to 24 minutes: 428
- 25 to 29 minutes: 384
- 30 to 34 minutes: 1,433
- 35 to 39 minutes: 392
- 40 to 44 minutes: 365
- 45 to 59 minutes: 445
- 60 to 89 minutes: 168
- 90 or more minutes: 58
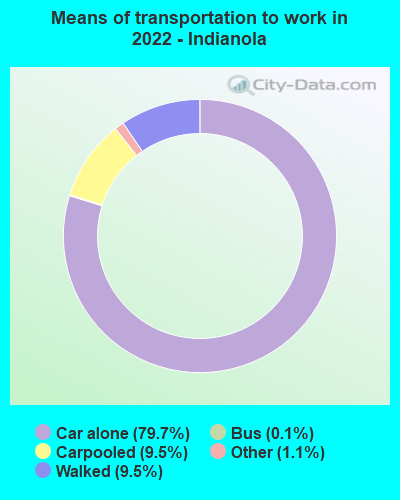
Means of transportation to work:
- Drove a car alone: 4,314 (68.2%)
- Carpooled: 544 (8.6%)
- Bus: 6 (0.1%)
- Taxi: 58 (0.9%)
- Walked: 516 (8.2%)
- Worked at home: 927 (14.6%)
- Unemployment by race in 2022
- Unemployment rate for White non-Hispanic residents
- 2.8%Males
- 3.3%Females
- Unemployment rate for Black residents
- 41.7%Males
- Unemployment rate for Hispanic or Latino residents
- 17.8%Males
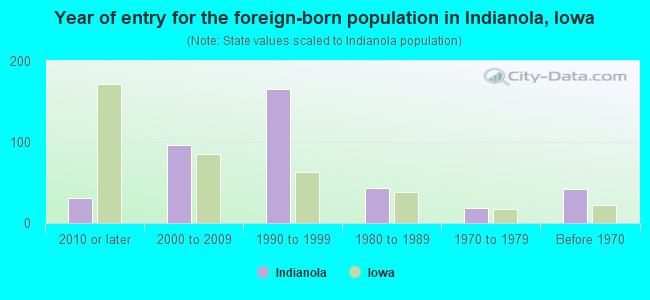
- Year of entry for the foreign-born population in Indianola, Iowa
- 312010 or later
- 962000 to 2009
- 1661990 to 1999
- 431980 to 1989
- 181970 to 1979
- 42Before 1970
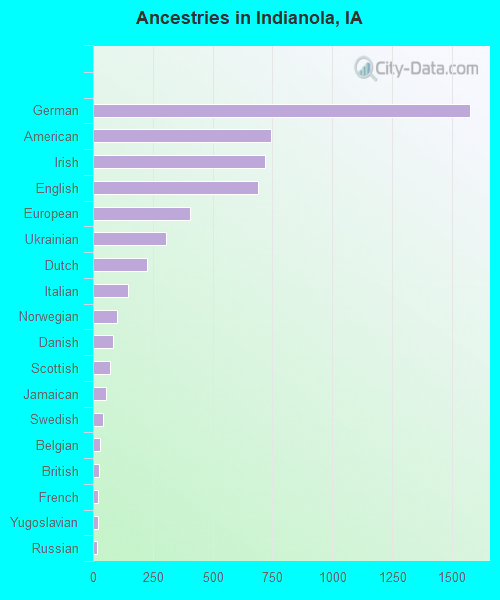
First ancestries reported:
- German: 1,576 (23.6%)
- American: 745 (11.2%)
- Irish: 720 (10.8%)
- English: 689 (10.3%)
- European: 405 (6.1%)
- Ukrainian: 304 (4.6%)
- Dutch: 226 (3.4%)
- Italian: 145 (2.2%)
- Norwegian: 100 (1.5%)
- Danish: 84 (1.3%)
- Scottish: 71 (1.1%)
- Jamaican: 53 (0.8%)
- Swedish: 40 (0.6%)
- Belgian: 28 (0.4%)
- British: 24 (0.4%)
- French: 20 (0.3%)
- Yugoslavian: 19 (0.3%)
- Russian: 15 (0.2%)
- Canadian: 12 (0.2%)
- French Canadian: 12 (0.2%)
- Polish: 12 (0.2%)
- Greek: 11 (0.2%)
- Welsh: 9 (0.1%)
- Finnish: 7 (0.1%)
- Scotch-Irish: 7 (0.1%)
Most common places of birth for foreign-born residents (%):
| Indianola: | 30.4% (112) |
| Iowa: | 4.2% (7,428) |
| Indianola: | 13.3% (49) |
| Iowa: | 0.5% (816) |
| Indianola: | 12.2% (45) |
| Iowa: | 0.0% (73) |
| Indianola: | 11.9% (44) |
| Iowa: | 23.3% (41,625) |
| Indianola: | 6.8% (25) |
| Iowa: | 2.6% (4,675) |
| Indianola: | 6.8% (25) |
| Iowa: | 6.2% (11,148) |
| Indianola: | 6.5% (24) |
| Iowa: | 3.2% (5,751) |
| Indianola: | 4.9% (18) |
| Iowa: | 0.8% (1,425) |
| Indianola: | 2.4% (9) |
| Iowa: | 4.6% (8,194) |
| Indianola: | 2.2% (8) |
| Iowa: | 2.9% (5,155) |
Place of birth for U.S.-born residents:
- This state: 12,035
- Other state: 3,362
- Northeast: 275
- Midwest: 1,847
- South: 463
- West: 784
84.0% of Indianola residents lived in the same house 1 years ago.
Out of people who lived in different houses, 30.6% lived in this county.
Out of people who lived in different counties, 77.9% lived in Iowa.
| Indianola: | 84.0% |
| State average: | 87.2% |
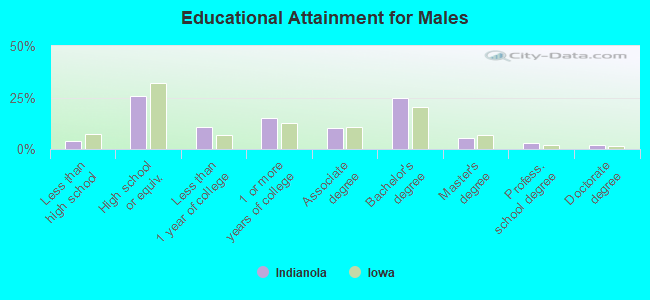
Education attainment for males 25 years and older:
- No schooling: 23
- Nursery to 4th grade: 0
- 5th and 6th grade: 0
- 7th and 8th grade: 16
- 9th grade: 0
- 10th grade: 52
- 11th grade: 56
- 12th grade, no diploma: 26
- High school graduate (or equivalency): 1,218
- Less than 1 year of college: 511
- Some college more than 1 year, no degree: 705
- Associate degree: 489
- Bachelor's degree: 1,162
- Master's degree: 249
- Professional school degree: 132
- Doctorate degree: 98
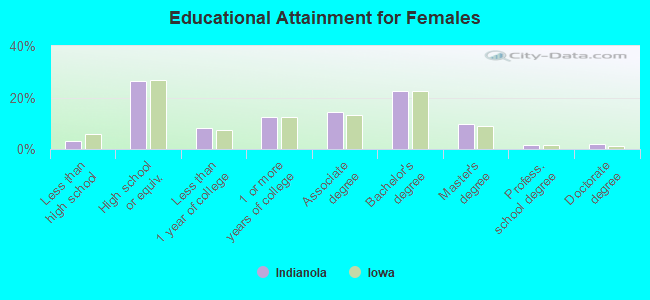
Education attainment for females 25 years and older:
- No schooling: 33
- Nursery to 4th grade: 0
- 5th and 6th grade: 9
- 7th and 8th grade: 2
- 9th grade: 1
- 10th grade: 18
- 11th grade: 54
- 12th grade, no diploma: 33
- High school graduate (or equivalency): 1,355
- Less than 1 year of college: 418
- Some college more than 1 year, no degree: 640
- Associate degree: 743
- Bachelor's degree: 1,150
- Master's degree: 491
- Professional school degree: 77
- Doctorate degree: 104
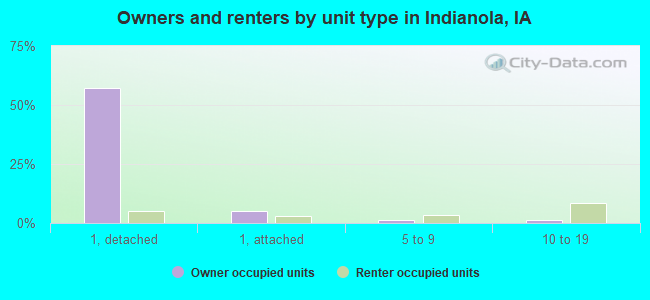
Housing units in structures:
- One, detached: 3,808
- One, attached: 514
- Two: 137
- 3 or 4: 242
- 5 to 9: 338
- 10 to 19: 650
- 20 to 49: 421
- 50 or more: 204
- Mobile homes: 154
Median worth of mobile homes: $19,401
Housing units lacking complete kitchen facilities in 2022: 1.2%
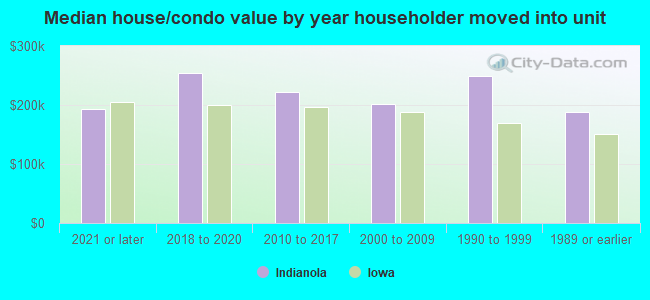
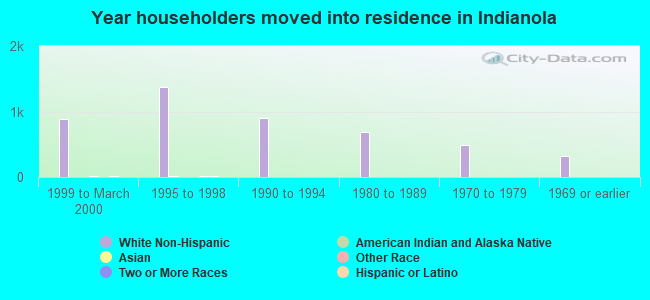
House/condo owner moved in on average 8 years ago
Renter moved in on average 3 years ago
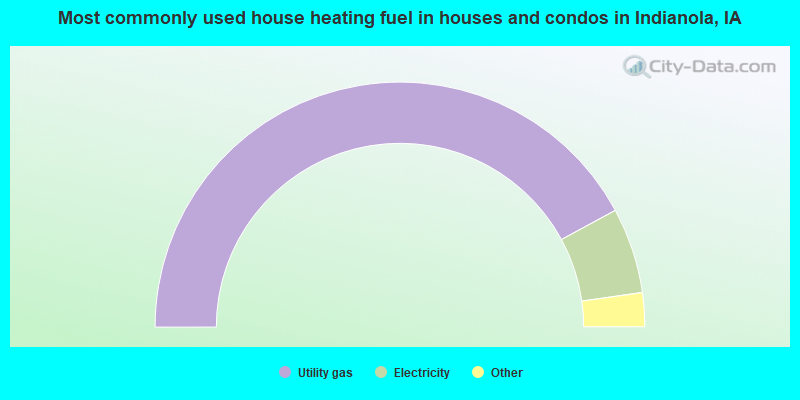
- 84.2%Utility gas
- 11.3%Electricity
- 2.3%Bottled, tank, or LP gas
- 1.8%Other fuel
- 0.2%Wood
- 0.2%No fuel used
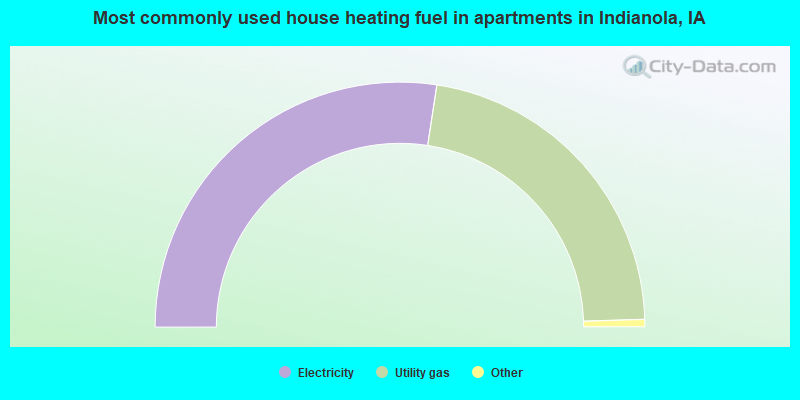
- 54.9%Electricity
- 44.2%Utility gas
- 0.8%Other fuel
- 0.2%Bottled, tank, or LP gas
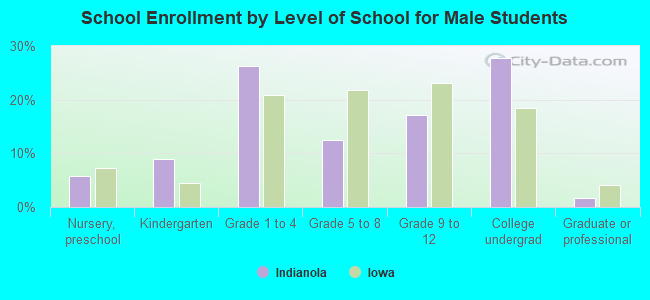
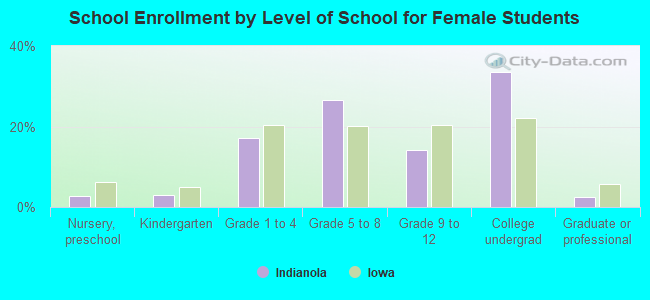
Private vs. public school enrollment:
| Here: | 8.5% |
| Iowa: | 10.6% |
| Here: | 5.4% |
| Iowa: | 7.9% |
| Here: | 80.3% |
| Iowa: | 23.9% |