Jump to a detailed profile or search site with Google Custom Search

Indio, CA (California) Houses and Residents

Estimated median house or condo value in 2022: $477,900 (it was $92,300 in 2000)
Indio:

$477,900
California:

$715,900
Lower value quartile - upper value quartile: $339,400 - $628,600

Mean price in 2022:

Detached houses: $486,706
Here:

$486,706
State:

$988,808

Townhouses or other attached units: $466,675
Here:

$466,675
State:

$838,546

In 3-to-4-unit structures: $287,886
Here:

$287,886
State:

$824,253

In 5-or-more-unit structures: $576,802
Here:

$576,802
State:

$730,996

Mobile homes: $101,224
Here:

$101,224
State:

$184,506

Occupied boats, RVs, vans, etc.: $86,397
Here:

$86,397
State:

$204,957

Total population: 85,633 (Urban population: 47,772, Rural population: 1,387 (82 farm, 1,305 nonfarm))

Houses: 37,123 (30,593 occupied: 20,190 owner occupied, 10,403 renter occupied)

% of renters here:

34%
State:

44%

Housing density: 1,391 houses/condos per square mile

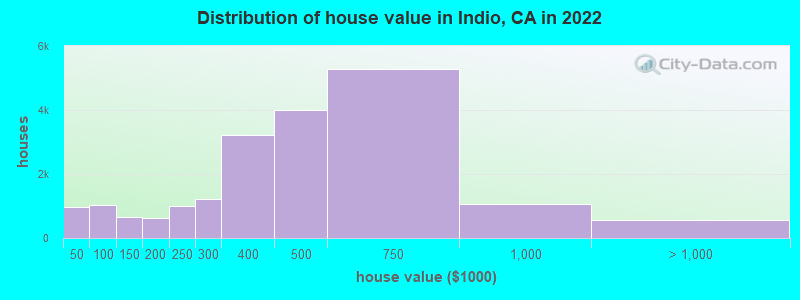
Median price asked for vacant for-sale houses and condos in 2022: $394,780.

Median contract rent in 2022: $1,177 (lower quartile is $768, upper quartile is $1,653)


Median rent asked for vacant for-rent units in 2022: $1,319


Median gross rent in Indio, CA in 2022: $1,352

Housing units in Indio with a mortgage: 14,135 (681 second mortgage, 43 home equity loan, 461 both second mortgage and home equity loan)
Houses without a mortgage: 49

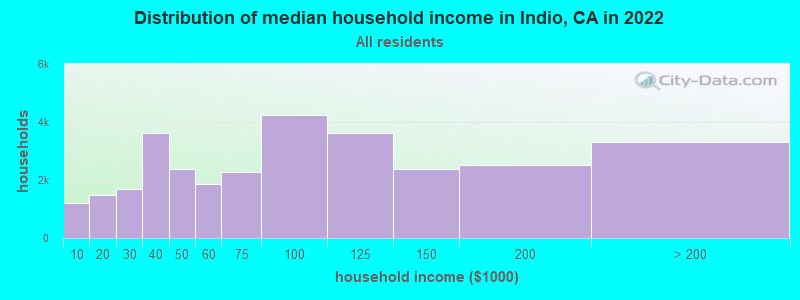
Median household income for houses/condos with a mortgage: $116,654

Median household income for apartments without a mortgage: $55,748

Median monthly housing costs: $1,488

Compare current foreclosures in Indio, CA:

Check out more offers in Indio, CA.
Powered by Foreclosure.com

Settings
X
Data:
Loading data...
Based on 2000-2022 data
Loading data...

123
Hide US histogram

Latest news about housing in Indio, CA collected exclusively by city-data.com from local newspapers, TV, and radio stations

Indio, California Age and Sex of Residents
Median year house/condo built: 2004

Median year apartment built: 1988

Household type by relationship:

Households: 91,991
  • Male householders: 16,574 (3,214 living alone), Female householders: 14,019 (3,613 living alone)
  • 17,175 spouses (17,008 opposite-sex spouses), 1,603 unmarried partners, (1,536 opposite-sex unmarried partners), 28,335 children (26,871 natural, 515 adopted, 949 stepchildren), 2,931 grandchildren, 2,872 brothers or sisters, 2,375 parents, 0 foster children, 3,998 other relatives, 1,203 non-relatives
  • In group quarters: 906

Size of family households: 7,295 2-persons, 5,399 3-persons, 3,541 4-persons, 3,394 5-persons, 1,767 6-persons, 945 7-or-more-persons.

Size of nonfamily households: 6,827 1-person, 1,351 2-persons, 74 3-persons.

14,966 married couples with children.
3,090 single-parent households (640 men, 2,450 women).

46.0% of residents of Indio speak English at home.
50.4% of residents speak Spanish at home (63% speak English very well, 21% speak English well, 10% speak English not well, 6% don't speak English at all).
0.9% of residents speak other Indo-European language at home (85% speak English very well, 13% speak English well, 1% speak English not well, 1% don't speak English at all).
1.9% of residents speak Asian or Pacific Island language at home (54% speak English very well, 22% speak English well, 19% speak English not well, 5% don't speak English at all).
0.2% of residents speak other language at home (54% speak English very well, 36% speak English well, 10% speak English not well).

Foreign born population: 26,434 (28.7%)
(39.1% of them are naturalized citizens)

Median number of rooms in houses and condos:
Here:

5.8
State:

6.0

Median number of rooms in apartments
Here:

4.1
State:

3.9

Owner-occupied Renter-occupied
Bedrooms in owner-occupied houses and condos in Indio, California
  • Bedrooms in owner-occupied houses and condos in Indio, California
  • 172no bedroom
  • 1,0151 bedroom
  • 4,4962 bedrooms
  • 6,9013 bedrooms
  • 6,4604 bedrooms
  • 1,1465+ bedrooms
Bedrooms in renter-occupied apartments in Indio, California
  • Bedrooms in renter-occupied apartments in Indio, California
  • 955no bedroom
  • 2,2001 bedroom
  • 3,9042 bedrooms
  • 1,9013 bedrooms
  • 1,3424 bedrooms
  • 1015+ bedrooms
Owner-occupied Renter-occupied
Cars and other vehicles available in Indio in owner-occupied houses/condos
  • Cars and other vehicles available in Indio in owner-occupied houses/condos
  • 217no vehicle
  • 5,7671 vehicle
  • 7,9332 vehicles
  • 3,4383 vehicles
  • 2,2464 vehicles
  • 5895+ vehicles
Cars and other vehicles available in Indio in renter-occupied apartments
  • Cars and other vehicles available in Indio in renter-occupied apartments
  • 808no vehicle
  • 3,6951 vehicle
  • 3,0952 vehicles
  • 2,1273 vehicles
  • 3744 vehicles
  • 3045+ vehicles
Owner-occupied Renter-occupied
Rooms in owner-occupied houses in Indio, California
  • Rooms in owner-occupied houses in Indio, California
  • 351 room
  • 2222 rooms
  • 1,2243 rooms
  • 1,8874 rooms
  • 5,1705 rooms
  • 5,7896 rooms
  • 2,3587 rooms
  • 2,0128 rooms
  • 1,4939+ rooms
Rooms in renter-occupied apartments in Indio, California
  • Rooms in renter-occupied apartments in Indio, California
  • 9551 room
  • 4772 rooms
  • 1,8423 rooms
  • 3,0734 rooms
  • 1,8545 rooms
  • 1,3466 rooms
  • 4437 rooms
  • 578 rooms
  • 3569+ rooms
Year house built
Median 2022 house/condo value by year built
Median house/condo value by year householder moved into unit
Breakdown of mean house values by ages of householders
Owners and renters by unit type in Indio, CA
  • Indio, CA household income distribution

  • Distribution of median household income in Indio, CA in 2022
  • 1,191Less than $10,000
  • 1,488$10,000 to $19,999
  • 1,673$20,000 to $29,999
  • 3,632$30,000 to $39,999
  • 2,388$40,000 to $49,999
  • 1,864$50,000 to $59,999
  • 2,282$60,000 to $74,999
  • 4,230$75,000 to $99,999
  • 3,632$100,000 to $124,999
  • 2,365$125,000 to $149,999
  • 2,534$150,000 to $199,999
  • 3,314$200,000 or more
  • Home value of owner - occupied houses in 2022 in Indio, CA

  • Distribution of house value in Indio, CA in 2022
  • 209Less than $10,000
  • 63$10,000 to $14,999
  • 68$15,000 to $19,999
  • 114$20,000 to $24,999
  • 55$25,000 to $29,999
  • 118$30,000 to $34,999
  • 46$35,000 to $39,999
  • 276$40,000 to $49,999
  • 406$50,000 to $59,999
  • 80$60,000 to $69,999
  • 144$70,000 to $79,999
  • 106$80,000 to $89,999
  • 16$90,000 to $99,999
  • 397$100,000 to $124,999
  • 257$125,000 to $149,999
  • 287$150,000 to $174,999
  • 342$175,000 to $199,999
  • 990$200,000 to $249,999
  • 1,232$250,000 to $299,999
  • 3,218$300,000 to $399,999
  • 4,002$400,000 to $499,999
  • 5,294$500,000 to $749,999
  • 1,050$750,000 to $999,999
  • 432$1,000,000 to $1,499,999
  • 49$1,500,000 to $1,999,999
  • 95$2,000,000 or more
  • Rent paid by renters in 2022 in Indio, CA

  • Distribution of rent paid by renters in Indio, CA in 2022
  • 82$100 to $149
  • 120$150 to $199
  • 181$200 to $249
  • 28$250 to $299
  • 36$300 to $349
  • 197$350 to $399
  • 347$400 to $449
  • 26$450 to $499
  • 323$500 to $549
  • 94$550 to $599
  • 170$600 to $649
  • 244$650 to $699
  • 444$700 to $749
  • 134$750 to $799
  • 519$800 to $899
  • 651$900 to $999
  • 2,347$1,000 to $1,249
  • 1,099$1,250 to $1,499
  • 1,630$1,500 to $1,999
  • 712$2,000 to $2,499
  • 173$2,500 to $2,999
  • 27$3,000 to $3,499
  • 112$3,500 or more
  • 315No cash rent
Time Leaving Home To Go To Work in 2022

Percentage of workers working in this county: 94.8%
Number of people working at home: 2,455 (5.9% of all workers)

Travel time (in minutes) to work in 2022

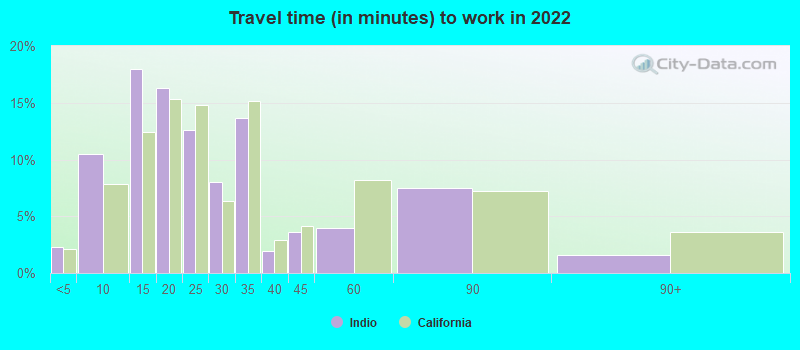
Travel time to work (commute)

  • Less than 5 minutes: 884
  • 5 to 9 minutes: 4,267
  • 10 to 14 minutes: 4,913
  • 15 to 19 minutes: 8,025
  • 20 to 24 minutes: 6,693
  • 25 to 29 minutes: 5,485
  • 30 to 34 minutes: 6,075
  • 35 to 39 minutes: 305
  • 40 to 44 minutes: 317
  • 45 to 59 minutes: 954
  • 60 to 89 minutes: 650
  • 90 or more minutes: 816
Means of transportation to work in 2022 - Indio

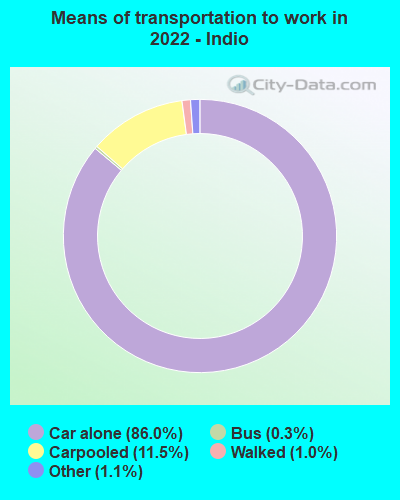
Means of transportation to work:

  • Drove a car alone: 23,094 (77.1%)
  • Carpooled: 3,352 (11.2%)
  • Bus: 76 (0.3%)
  • Taxi: 313 (1.0%)
  • Bicycle: 26 (0.1%)
  • Walked: 260 (0.9%)
  • Worked at home: 2,455 (8.2%)
Class of Workers in 2022
  • Unemployment by race in 2022
  • Unemployment rate for White non-Hispanic residents
  • 2.1%Males
  • 4.5%Females
  • Unemployment rate for Black residents
  • 8.4%Males
  • 7.1%Females
  • Unemployment rate for Asian residents
  • 1.6%Males
  • 14.2%Females
  • Unemployment rate for other race residents
  • 10.9%Males
  • 10.0%Females
  • Unemployment rate for two or more race residents
  • 0.9%Males
  • 3.3%Females
  • Unemployment rate for Hispanic or Latino residents
  • 2.7%Males
  • 2.5%Females
Year of entry for the foreign-born population in Indio, California
  • Year of entry for the foreign-born population in Indio, California
  • 4,1562010 or later
  • 5,4782000 to 2009
  • 3,8951990 to 1999
  • 5,1321980 to 1989
  • 3,0561970 to 1979
  • 2,138Before 1970
Ancestries in Indio, CA

First ancestries reported:

  • American: 1,926 (3.0%)
  • English: 1,923 (3.0%)
  • Italian: 979 (1.5%)
  • German: 877 (1.4%)
  • Irish: 838 (1.3%)
  • European: 407 (0.6%)
  • Polish: 360 (0.6%)
  • Eastern European: 214 (0.3%)
  • Scottish: 150 (0.2%)
  • Norwegian: 148 (0.2%)
  • Canadian: 140 (0.2%)
  • Dutch: 138 (0.2%)
  • Albanian: 126 (0.2%)
  • Scotch-Irish: 102 (0.2%)
  • British: 93 (0.1%)
  • French: 93 (0.1%)
  • Czech: 91 (0.1%)
  • Swedish: 90 (0.1%)
  • Romanian: 88 (0.1%)
  • Hungarian: 88 (0.1%)
  • Ukrainian: 81 (0.1%)
  • Greek: 66 (0.1%)
  • Austrian: 62 (0.10%)
  • Russian: 56 (0.09%)
  • French Canadian: 54 (0.08%)
  • Scandinavian: 48 (0.07%)
  • Danish: 46 (0.07%)
  • Jamaican: 43 (0.07%)
  • Swiss: 39 (0.06%)
  • African: 30 (0.05%)
  • Croatian: 27 (0.04%)
  • Northern European: 26 (0.04%)
  • Arab: 25 (0.04%)
  • Lithuanian: 22 (0.03%)
  • Armenian: 22 (0.03%)
  • South African: 21 (0.03%)
  • Iranian: 20 (0.03%)
  • Czechoslovakian: 17 (0.03%)
  • Israeli: 16 (0.02%)
  • Welsh: 16 (0.02%)
  • Portuguese: 15 (0.02%)
  • Palestinian: 14 (0.02%)
  • Lebanese: 10 (0.02%)
  • Brazilian: 9 (0.01%)
  • Finnish: 9 (0.01%)
  • Icelander: 6 (0.01%)
  • Yugoslavian: 4 (0.01%)

Most common places of birth for foreign-born residents (%):

Mexico
Indio:

73.2% (16,716)
California:

37.2% (3,881,193)

Philippines
Indio:

3.7% (845)
California:

7.8% (818,297)

Canada
Indio:

3.3% (763)
California:

1.2% (127,477)

Vietnam
Indio:

2.0% (468)
California:

4.9% (512,335)

Guatemala
Indio:

1.6% (363)
California:

2.8% (290,436)

El Salvador
Indio:

1.5% (349)
California:

4.2% (440,287)

Place of birth for U.S.-born residents:

  • This state: 52,522
  • Other state: 12,210
  • Northeast: 1,971
  • Midwest: 4,665
  • South: 2,075
  • West: 3,499

94.1% of Indio residents lived in the same house 1 years ago.
   Out of people who lived in different houses, 38.9% lived in this county.
   Out of people who lived in different counties, 62.0% lived in California.


Indio:

94.1%
State average:

88.9%

Education attainment for males 25 years and older:

  • No schooling: 633
  • Nursery to 4th grade: 185
  • 5th and 6th grade: 2,373
  • 7th and 8th grade: 487
  • 9th grade: 2,970
  • 10th grade: 181
  • 11th grade: 910
  • 12th grade, no diploma: 1,592
  • High school graduate (or equivalency): 7,839
  • Less than 1 year of college: 1,543
  • Some college more than 1 year, no degree: 3,012
  • Associate degree: 1,879
  • Bachelor's degree: 3,738
  • Master's degree: 2,481
  • Professional school degree: 278
  • Doctorate degree: 736
Educational Attainment for Males

Education attainment for females 25 years and older:

  • No schooling: 596
  • Nursery to 4th grade: 898
  • 5th and 6th grade: 1,960
  • 7th and 8th grade: 496
  • 9th grade: 2,270
  • 10th grade: 362
  • 11th grade: 920
  • 12th grade, no diploma: 1,366
  • High school graduate (or equivalency): 6,682
  • Less than 1 year of college: 2,545
  • Some college more than 1 year, no degree: 3,696
  • Associate degree: 1,909
  • Bachelor's degree: 4,320
  • Master's degree: 2,826
  • Professional school degree: 276
  • Doctorate degree: 115
Educational Attainment for Females
Indio marital status for males
Indio marital status for females

Housing units in structures:

  • One, detached: 23,665
  • One, attached: 1,602
  • Two: 261
  • 3 or 4: 4,298
  • 5 to 9: 1,247
  • 10 to 19: 263
  • 20 to 49: 140
  • 50 or more: 760
  • Mobile homes: 4,751
  • Boats, RVs, vans, etc.: 136

Median worth of mobile homes: $76,000

Housing units lacking complete plumbing facilities in 2022: 0.9%

Housing units lacking complete kitchen facilities in 2022: 0.7%

House/condo owner moved in on average 9 years ago

Renter moved in on average 5 years ago

Year householders moved into residence in Indio
Houses and condos Apartments
Most commonly used house heating fuel in houses and condos in Indio, CA
  • 62.1%Utility gas
  • 34.3%Electricity
  • 2.0%Bottled, tank, or LP gas
  • 1.0%No fuel used
  • 0.4%Solar energy
Most commonly used house heating fuel in apartments in Indio, CA
  • 54.1%Electricity
  • 43.1%Utility gas
  • 1.1%Bottled, tank, or LP gas
  • 0.8%Solar energy
  • 0.6%No fuel used
  • 0.2%Other fuel
  • 0.1%Fuel oil, kerosene, etc.

Private vs. public school enrollment:

Students in private schools in grades 1 to 8 (elementary and middle school): 619
Here:

5.7%
California:

10.5%

Students in private schools in grades 9 to 12 (high school): 270
Here:

4.2%
California:

8.5%

Students in private undergraduate colleges: 464
Here:

12.5%
California:

15.9%
School Enrollment by Level of School for Male Students
School Enrollment by Level of School for Female Students
Age and Sex of Sensory-Disabled Noninstitutionalized Residents
Age and Sex of Physically-Disabled Noninstitutionalized Residents
Age and Sex of Mentally-Disabled Noninstitutionalized Residents
Age and Sex of Self-Care Disabled Noninstitutionalized Residents
Age and Sex of Go-Outside-Home Disabled Noninstitutionalized Residents
Age and Sex of Noninstitutionalized Residents with Employment Disability