Irwindale, CA (California) Houses and Residents
| Irwindale: | $663,338 |
| California: | $715,900 |
Total population: 1,431 (All urban)
Houses: 457 (448 occupied: 364 owner occupied, 85 renter occupied)
| % of renters here: | 19% |
| State: | 44% |
Housing density: 49 houses/condos per square mile
Median price asked for vacant for-sale houses and condos in 2022 in this county: $1,291,802.
Median contract rent in 2022: $1,453 (lower quartile is $378, upper quartile is over $2,000)
Median gross rent in Irwindale, CA in 2022: $1,600
Housing units in Irwindale with a mortgage: 236 (2 second mortgage, 0 home equity loan, 0 both second mortgage and home equity loan)
Houses without a mortgage: 0
Median household income for houses/condos with a mortgage: $124,877
Median household income for apartments without a mortgage: $68,026
Median monthly housing costs: $1,506
Compare current foreclosures near Irwindale, CA:
| Photo | Address | Area | Beds / Baths | Price | Details |
|---|---|---|---|---|---|

|
#1
Millbury Ave
Baldwin Park, CA 91706
|
1,632 sq. feet
|
2 baths 4 beds |
$850,000
|
show details |

|
#2
E Norma Ave
West Covina, CA 91791
|
1,134 sq. feet
|
2 baths 3 beds |
$599,000
|
show details |

|
#3
E Holton St
West Covina, CA 91791
|
- sq. feet
|
2 baths 3 beds |
$450,000
|
show details |

|
#4
And 6111 Northside Drive
Los Angeles, CA 90022
|
1,329 sq. feet
|
4 baths 3 beds |
show details | |

|
#5
Bohlig Rd Apt 45
Los Angeles, CA 90032
|
813 sq. feet
|
2 baths 2 beds |
show details | |

|
#6
Shoemaker Ave
Whittier, CA 90605
|
1,700 sq. feet
|
2 baths 3 beds |
show details | |

|
#7
Ocana Ave
Bellflower, CA 90706
|
1,218 sq. feet
|
2 baths 3 beds |
show details | |

|
#8
Leland Ave
Whittier, CA 90605
|
1,080 sq. feet
|
1 baths 3 beds |
show details | |

|
#9
Curtis And King Rd
Norwalk, CA 90650
|
1,947 sq. feet
|
2 baths 3 beds |
show details | |

|
#10
Downey Ave
Downey, CA 90241
|
3,162 sq. feet
|
4 baths 8 beds |
show details |
| Photo | Address | Area | Beds / Baths | Price | Details |
|---|---|---|---|---|---|

|
#11
N Charter Dr
Covina, CA 91724
|
1,387 sq. feet
|
2 baths 4 beds |
show details | |

|
#12
Oak St
South Pasadena, CA 91030
|
2,510 sq. feet
|
1 baths 5 beds |
show details | |

|
#13
Dittmar Dr
Whittier, CA 90603
|
1,094 sq. feet
|
1 baths 3 beds |
show details | |

|
#14
Fernbank Ave
Monterey Park, CA 91754
|
1,310 sq. feet
|
2 baths 3 beds |
show details | |

|
#15
Pamela Ln
La Habra, CA 90631
|
2,848 sq. feet
|
3 baths 5 beds |
show details | |

|
#16
N Gordon St
Pomona, CA 91768
|
1,653 sq. feet
|
2 baths 3 beds |
show details | |

|
#17
Main St.
West Covina, CA 91790
|
- sq. feet
|
- baths - beds |
$575,000
|
show details |

|
#18
Arlee Ave
Norwalk, CA 90650
|
872 sq. feet
|
1 baths 2 beds |
show details | |

|
#19
Mitony Ave
Whittier, CA 90605
|
1,561 sq. feet
|
2 baths 3 beds |
show details | |

|
#20
S Towne Ave
Pomona, CA 91766
|
1,980 sq. feet
|
3 baths 3 beds |
show details |
| Photo | Address | Area | Beds / Baths | Price | Details |
|---|---|---|---|---|---|

|
#21
Neff Ave
La Puente, CA 91744
|
2,339 sq. feet
|
2 baths 4 beds |
show details | |

|
#22
E Benbow St
Covina, CA 91722
|
1,514 sq. feet
|
2 baths 4 beds |
show details | |

|
#23
Lemoran Ave
Pico Rivera, CA 90660
|
1,633 sq. feet
|
2 baths 3 beds |
show details | |

|
#24
Deodar St
Montclair, CA 91763
|
1,095 sq. feet
|
2 baths 3 beds |
show details | |

|
#25
& 5917a Everett Ave
Huntington Park, CA 90255
|
- sq. feet
|
1 baths 2 beds |
show details | |

|
#26
E 54th St
Maywood, CA 90270
|
1,066 sq. feet
|
1 baths 2 beds |
show details | |

|
#27
Granby Pl
Rowland Heights, CA 91748
|
2,358 sq. feet
|
3 baths 5 beds |
show details | |

|
#28
Molette St
Norwalk, CA 90650
|
1,082 sq. feet
|
1 baths 4 beds |
show details | |

|
#29
Gifford Ave
Huntington Park, CA 90255
|
858 sq. feet
|
1 baths 2 beds |
show details | |

|
#30
Skyview Cir
Pomona, CA 91766
|
2,060 sq. feet
|
3 baths 4 beds |
show details |
| Photo | Address | Area | Beds / Baths | Price | Details |
|---|---|---|---|---|---|

|
#31
Coachwood St
La Habra, CA 90631
|
2,121 sq. feet
|
2 baths 4 beds |
show details | |

|
#32
Angeles Crest Hwy
La Canada Flintridge, CA 91011
|
2,043 sq. feet
|
2 baths 3 beds |
show details | |

|
#33
Hunter Rd
Chino Hills, CA 91709
|
2,360 sq. feet
|
2 baths 3 beds |
show details | |

|
#34
Bequette Ave
Pico Rivera, CA 90660
|
2,766 sq. feet
|
2 baths 3 beds |
show details | |

|
#35
N Everett St
Glendale, CA 91206
|
724 sq. feet
|
1 baths 2 beds |
show details | |

|
#36
Tate St
Pomona, CA 91767
|
1,656 sq. feet
|
1 baths 3 beds |
show details | |

|
#37
S Pintado Dr
Diamond Bar, CA 91765
|
1,465 sq. feet
|
2 baths 4 beds |
show details | |

|
#38
Nassau Ave
Los Angeles, CA 90063
|
1,036 sq. feet
|
1 baths 3 beds |
show details | |

|
#39
Flintridge Dr
Glendale, CA 91206
|
2,648 sq. feet
|
3 baths 5 beds |
show details | |

|
#40
E Edna Pl
Covina, CA 91722
|
1,440 sq. feet
|
2 baths 4 beds |
show details |
| Photo | Address | Area | Beds / Baths | Price | Details |
|---|---|---|---|---|---|

|
#41
Basetdale Ave
La Puente, CA 91746
|
1,328 sq. feet
|
2 baths 4 beds |
show details | |

|
#42
Lemoran Ave
Downey, CA 90240
|
824 sq. feet
|
1 baths 2 beds |
show details | |

|
#43
Boer Ave
Whittier, CA 90606
|
864 sq. feet
|
1 baths 2 beds |
show details | |

|
#44
Meadow Grove St
La Canada Flintridge, CA 91011
|
8,618 sq. feet
|
8 baths 7 beds |
show details | |

|
#45
N Towne Ave
Pomona, CA 91767
|
2,177 sq. feet
|
2 baths 5 beds |
show details | |

|
#46
Avila Way
Buena Park, CA 90621
|
1,303 sq. feet
|
2 baths 3 beds |
show details | |

|
#47
W Washington Blvd
Pasadena, CA 91103
|
1,608 sq. feet
|
2 baths 4 beds |
show details | |

|
#48
Tacoma Ave
Los Angeles, CA 90065
|
2,047 sq. feet
|
2 baths 3 beds |
show details | |

|
#49
W Tudor St
Covina, CA 91722
|
1,745 sq. feet
|
2 baths 4 beds |
show details | |

|
Check over 1 million property listings on Foreclosure.com!
|
browse all offers | |||

Latest news about housing in Irwindale, CA collected exclusively by city-data.com from local newspapers, TV, and radio stations

 | Commuting to Pasadena- Better from East or West? (12 replies) |
| Yet another reason NOT to live in Irwindale (2 replies) |
| Moving to Irwindale, CA from Charlotte, NC (20 replies) |
| Raider's Owner Al Davis and The City of Irwindale (7 replies) |
| Moving to LA --> Rosemead-Irwindale (16 replies) |
| What is the worst place to live in California? (133 replies) |

Median year apartment built: 1979
Household type by relationship:
Households: 1,313- Male householders: 205 (42 living alone), Female householders: 227 (87 living alone)
162 spouses (162 opposite-sex spouses), 15 unmarried partners, (15 opposite-sex unmarried partners), 411 children (393 natural, 0 adopted, 18 stepchildren), 85 grandchildren, 18 brothers or sisters, 39 parents, 10 foster children, 86 other relatives, 50 non-relatives
Size of family households: 67 2-persons, 67 3-persons, 80 4-persons, 55 5-persons, 8 6-persons, 19 7-or-more-persons.
Size of nonfamily households: 138 1-person, 3 2-persons, 7 3-persons.
133 married couples with children.
38 single-parent households (24 men, 14 women).
44.6% of residents of Irwindale speak English at home.
55.1% of residents speak Spanish at home (65% speak English very well, 12% speak English well, 17% speak English not well, 7% don't speak English at all).
0.4% of residents speak Asian or Pacific Island language at home (100% speak English very well).
Foreign born population: 267 (20.3%)
(44.2% of them are naturalized citizens)
| Here: | 5.8 |
| State: | 6.0 |
| Here: | 4.7 |
| State: | 3.9 |

- Bedrooms in owner-occupied houses and condos in Irwindale, California
- 0no bedroom
- 01 bedroom
- 192 bedrooms
- 1743 bedrooms
- 1634 bedrooms
- 95+ bedrooms

- Bedrooms in renter-occupied apartments in Irwindale, California
- 2no bedroom
- 251 bedroom
- 112 bedrooms
- 333 bedrooms
- 144 bedrooms
- 05+ bedrooms

- Cars and other vehicles available in Irwindale in owner-occupied houses/condos
- 24no vehicle
- 771 vehicle
- 782 vehicles
- 873 vehicles
- 604 vehicles
- 385+ vehicles

- Cars and other vehicles available in Irwindale in renter-occupied apartments
- 11no vehicle
- 161 vehicle
- 212 vehicles
- 193 vehicles
- 154 vehicles
- 25+ vehicles

- Rooms in owner-occupied houses in Irwindale, California
- 01 room
- 02 rooms
- 03 rooms
- 484 rooms
- 935 rooms
- 1006 rooms
- 667 rooms
- 268 rooms
- 319+ rooms

- Rooms in renter-occupied apartments in Irwindale, California
- 21 room
- 02 rooms
- 263 rooms
- 104 rooms
- 255 rooms
- 216 rooms
- 07 rooms
- 08 rooms
- 09+ rooms


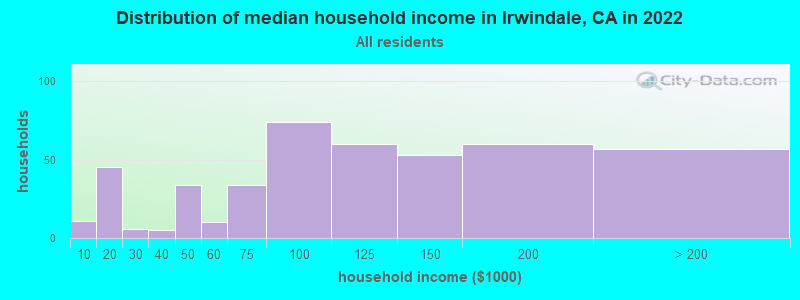
Irwindale, CA household income distribution

- 11Less than $10,000
- 45$10,000 to $19,999
- 6$20,000 to $29,999
- 5$30,000 to $39,999
- 34$40,000 to $49,999
- 10$50,000 to $59,999
- 34$60,000 to $74,999
- 74$75,000 to $99,999
- 60$100,000 to $124,999
- 53$125,000 to $149,999
- 60$150,000 to $199,999
- 57$200,000 or more
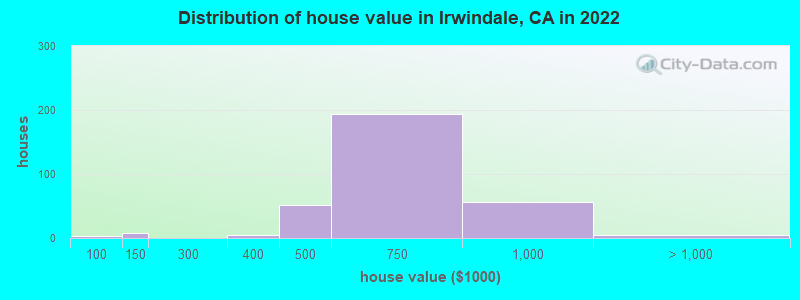
Home value of owner - occupied houses in 2022 in Irwindale, CA
-
- 2$50,000 to $59,999
- 7$100,000 to $124,999
- 4$300,000 to $399,999
- 52$400,000 to $499,999
- 193$500,000 to $749,999
- 56$750,000 to $999,999
- 3$1,500,000 to $1,999,999
Rent paid by renters in 2022 in Irwindale, CA
-
- 10$250 to $299
- 1$300 to $349
- 10$350 to $399
- 3$600 to $649
- 1$750 to $799
- 13$1,250 to $1,499
- 1$1,500 to $1,999
- 24$2,000 to $2,499
- 13$2,500 to $2,999
- 2No cash rent


Percentage of workers working in this county: 88.9%
Number of people working at home: 64 (9.3% of all workers)
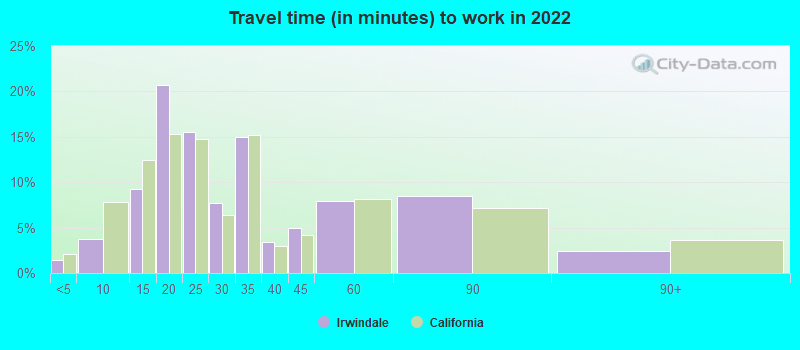
Travel time to work (commute)
- Less than 5 minutes: 27
- 5 to 9 minutes: 97
- 10 to 14 minutes: 63
- 15 to 19 minutes: 54
- 20 to 24 minutes: 74
- 25 to 29 minutes: 45
- 30 to 34 minutes: 78
- 35 to 39 minutes: 4
- 40 to 44 minutes: 5
- 45 to 59 minutes: 90
- 60 to 89 minutes: 69
- 90 or more minutes: 1
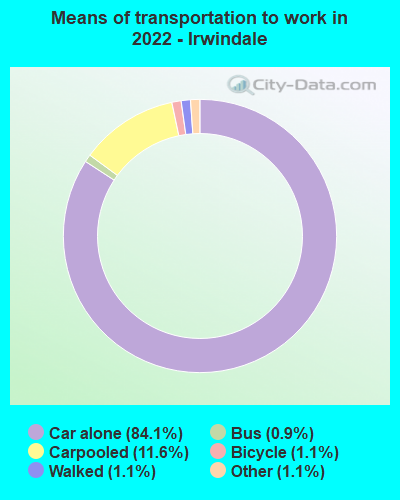
Means of transportation to work:
- Drove a car alone: 10,940 (79.5%)
- Carpooled: 1,667 (12.1%)
- Bus: 109 (0.8%)
- Subway or elevated rail: 5 (0.0%)
- Taxi: 157 (1.1%)
- Bicycle: 142 (1.0%)
- Walked: 159 (1.2%)
- Worked at home: 64 (0.5%)

- Unemployment by race in 2022
- Unemployment rate for other race residents
- 7.2%Males
- 7.0%Females
- Unemployment rate for two or more race residents
- 4.5%Males
- Unemployment rate for Hispanic or Latino residents
- 5.3%Males
- 3.2%Females

- Year of entry for the foreign-born population in Irwindale, California
- 302010 or later
- 802000 to 2009
- 491990 to 1999
- 1761980 to 1989
- 251970 to 1979
- 97Before 1970

First ancestries reported:
- Italian: 15 (2.1%)
- Irish: 10 (1.4%)
- Norwegian: 2 (0.3%)
Most common places of birth for foreign-born residents (%):
| Irwindale: | 79.8% (213) |
| California: | 37.2% (3,881,193) |
| Irwindale: | 12.7% (34) |
| California: | 4.2% (440,287) |
| Irwindale: | 3.4% (9) |
| California: | 0.6% (58,161) |
Place of birth for U.S.-born residents:
- This state: 980
- Other state: 32
- Northeast: 8
- Midwest: 3
- South: 5
- West: 13
96.5% of Irwindale residents lived in the same house 1 years ago.
Out of people who lived in different houses, 47.0% lived in this county.
Out of people who lived in different counties, 100.0% lived in California.
| Irwindale: | 96.5% |
| State average: | 88.9% |
Education attainment for males 25 years and older:
- No schooling: 23
- Nursery to 4th grade: 6
- 5th and 6th grade: 0
- 7th and 8th grade: 5
- 9th grade: 4
- 10th grade: 10
- 11th grade: 2
- 12th grade, no diploma: 32
- High school graduate (or equivalency): 139
- Less than 1 year of college: 36
- Some college more than 1 year, no degree: 79
- Associate degree: 54
- Bachelor's degree: 59
- Master's degree: 1
- Professional school degree: 0
- Doctorate degree: 0

Education attainment for females 25 years and older:
- No schooling: 31
- Nursery to 4th grade: 0
- 5th and 6th grade: 0
- 7th and 8th grade: 2
- 9th grade: 5
- 10th grade: 9
- 11th grade: 24
- 12th grade, no diploma: 6
- High school graduate (or equivalency): 129
- Less than 1 year of college: 18
- Some college more than 1 year, no degree: 64
- Associate degree: 44
- Bachelor's degree: 89
- Master's degree: 35
- Professional school degree: 3
- Doctorate degree: 0


Housing units in structures:
- One, detached: 417
- One, attached: 3
- 3 or 4: 5
- 5 to 9: 7
- 20 to 49: 17
- Mobile homes: 7
Housing units lacking complete kitchen facilities in 2022: 2.4%
House/condo owner moved in on average 21 years ago
Renter moved in on average 7 years ago

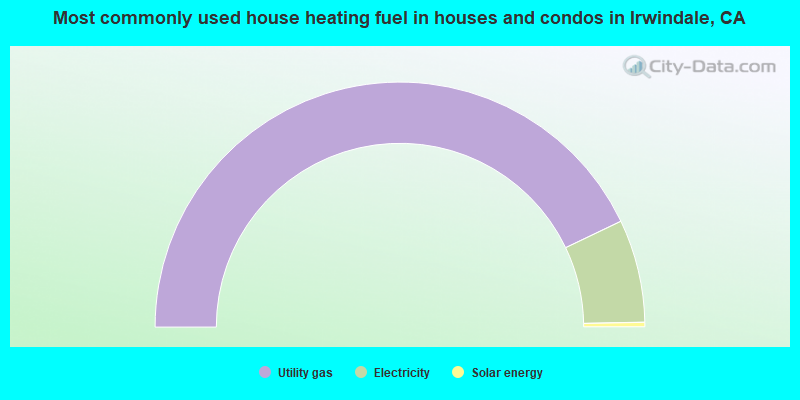
- 85.8%Utility gas
- 13.6%Electricity
- 0.6%Solar energy
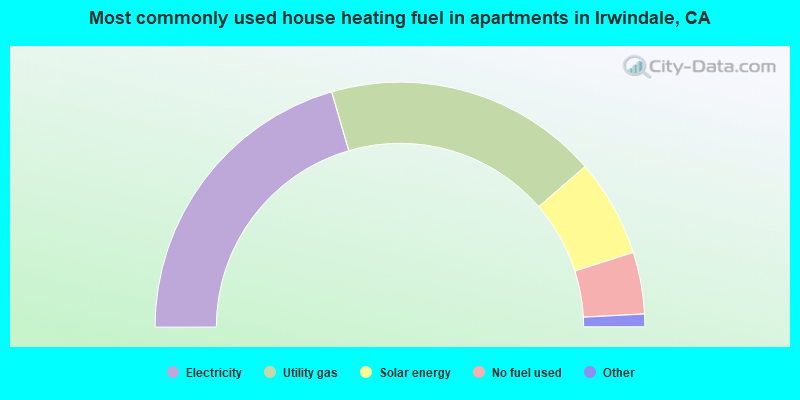
- 41.7%Electricity
- 36.9%Utility gas
- 13.1%Solar energy
- 8.3%No fuel used
Private vs. public school enrollment:
| Here: | 0.0% |
| California: | 10.5% |
| Here: | 0.0% |
| California: | 8.5% |
| Here: | 19.3% |
| California: | 15.9% |


