Issaquah, WA (Washington) Houses and Residents
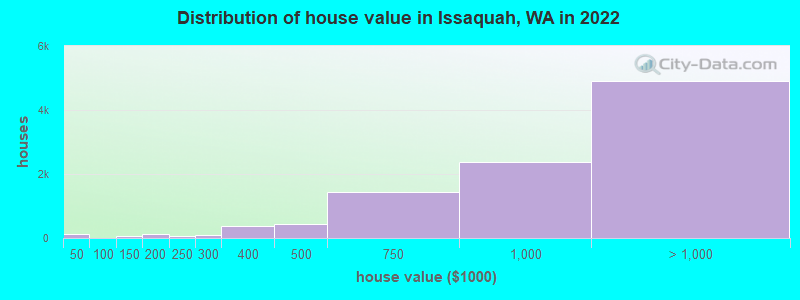
Estimated median house or condo value in 2022: $1,009,391 (it was $254,400 in 2000 )
Issaquah:
$1,009,391Washington:
$569,500
Lower value quartile - upper value quartile: $664,970 - $1,410,881Mean price in 2022: Detached houses: $1,487,969 Here:
$1,487,969State:
$734,307
Townhouses or other attached units: $770,647 Here:
$770,647State:
$657,697
In 2-unit structures: $568,138 Here:
$568,138State:
$534,634
In 3-to-4-unit structures: $701,928 Here:
$701,928State:
$510,239
In 5-or-more-unit structures: $463,060 Here:
$463,060State:
$503,183
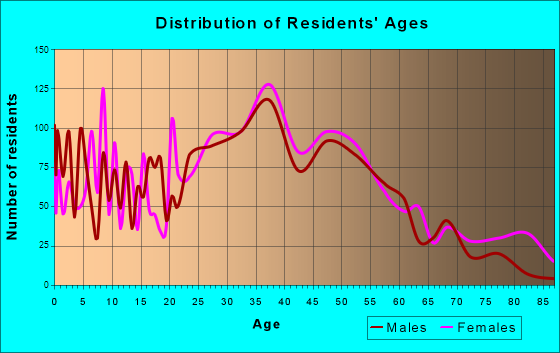
Total population: 34,056 (Urban population: 10,673, Rural population: 532 (all nonfarm) )
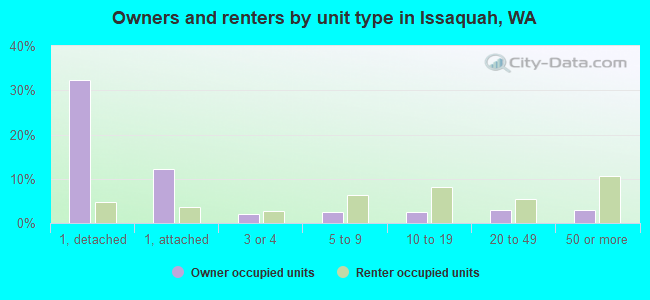
Houses: 17,549 (16,953 occupied: 9,790 owner occupied, 7,140 renter occupied )
% of renters here:
42%State:
36%
Housing density: 2,083 houses/condos per square mile
Median price asked for vacant for-sale houses and condos in 2022: $680,320.
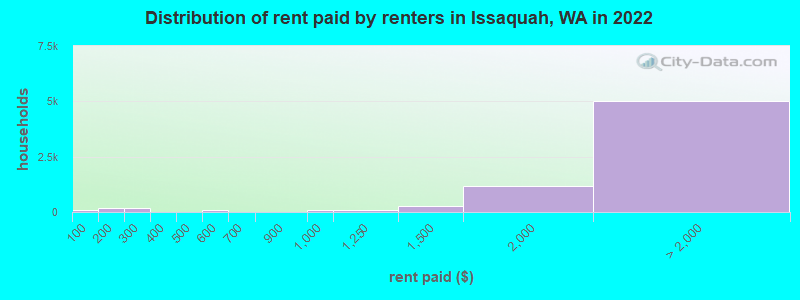
Median contract rent in 2022: over $2,000 (lower quartile is $1,853, upper quartile is over $2,000)
Median rent asked for vacant for-rent units in 2022: $3,180
Median gross rent in Issaquah, WA in 2022: over $2,000
Housing units in Issaquah with a mortgage: 6,797 (526 second mortgage, 38 home equity loan, 477 both second mortgage and home equity loan )Houses without a mortgage: 63
Median household income for houses/condos with a mortgage: $212,312
Median household income for apartments without a mortgage: $121,535
Median monthly housing costs: $2,483
Data:
Median house or condo value ($)
Median house or condo value ($ change since 2000)
Median house or condo value ($) - White
Median house or condo value ($) - Black or African American
Median house or condo value ($) - Asian
Median house or condo value ($) - Hispanic or Latino
Median house or condo value ($) - American Indian and Alaska Native
Median house or condo value ($) - Multirace
Median house or condo value ($) - Other Race
Median price asked for mobile homes ($)
Household density (households per square mile)
Mean house or condo value by units in structure - 1, detached ($)
Mean house or condo value by units in structure - 1, attached ($)
Mean house or condo value by units in structure - 2 ($)
Mean house or condo value by units in structure by units in structure - 3 or 4 ($)
Mean house or condo value by units in structure - 5 or more ($)
Mean house or condo value by units in structure - Boat, RV, van, etc. ($)
Mean house or condo value by units in structure - Mobile home ($)
Median contract rent ($)
Median contract rent - Lower quartile ($)
Median contract rent - Upper quartile ($)
Median gross rent ($)
Urban houses (%)
Rural houses (%)
Houses occupied (%)
Houses occupied (% change since 2000)
Houses owner occupied (%)
Houses owner occupied (% change since 2000)
Houses renter occupied (%)
Houses renter occupied (% change since 2000)
Vacant housing units - For rent (%)
Vacant housing units - For rent (% change since 2000)
Vacant housing units - For sale only (%)
Vacant housing units - For sale only (% change since 2000)
Vacant housing units - Rented or sold, not occupied (%)
Vacant housing units - Rented or sold, not occupied (% change since 2000)
Vacant housing units - For seasonal, recreational, or occasional use (%)
Vacant housing units - For seasonal, recreational, or occasional use (% change since 2000)
Vacant housing units - For migrant workers (%)
Vacant housing units - For migrant workers (% change since 2000)
Vacant housing units - Other vacant (%)
Vacant housing units - Other vacant (% change since 2000)
Median monthly housing costs ($)
Median household income for houses/condos with a mortgage ($)
Median household income for houses/condos without a mortgage ($)
Median household income ($)
Median household income ($) - White
Median household income ($) - Black or African American
Median household income ($) - Asian
Median household income ($) - Hispanic or Latino
Median household income ($) - American Indian and Alaska Native
Median household income ($) - Multirace
Median household income ($) - Other Race
Mortgage status - with mortgage (%)
Mortgage status - with second mortgage (%)
Mortgage status - with home equity loan (%)
Mortgage status - with both second mortgage and home equity loan (%)
Mortgage status - without a mortgage (%)
Median year house/condo built
Median year apartment built
Household type by relationship - Male householder living alone (%)
Household type by relationship - Male householder not living alone (%)
Household type by relationship - Female householder living alone (%)
Household type by relationship - Female householder not living alone (%)
Household type by relationship - Opposite-Sex spouse (%)
Household type by relationship - Same-Sex spouse (%)
Household type by relationship - Opposite-Sex unmarried partner (%)
Household type by relationship - Same-Sex unmarried partner (%)
Household type by relationship - In group quarters (%)
Size of family households - 2-person household (%)
Size of family households - 3-person household (%)
Size of family households - 4-person household (%)
Size of family households - 5-person household (%)
Size of family households - 6-person household (%)
Size of family households - 7-or-more-person household (%)
Size of nonfamily households - 1-person household (%)
Size of nonfamily households - 2-person household (%)
Size of nonfamily households - 3-person household (%)
Size of nonfamily households - 4-person household (%)
Size of nonfamily households - 5-person household (%)
Size of nonfamily households - 6-person household (%)
Size of nonfamily households - 7-or-moreperson household (%)
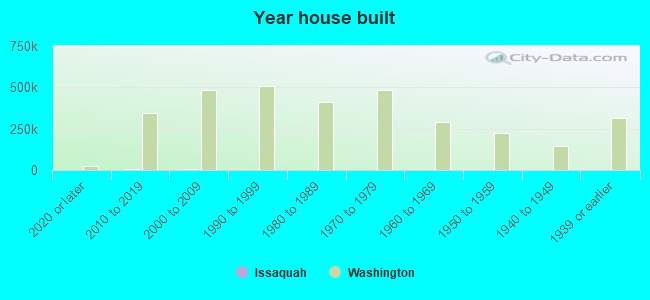
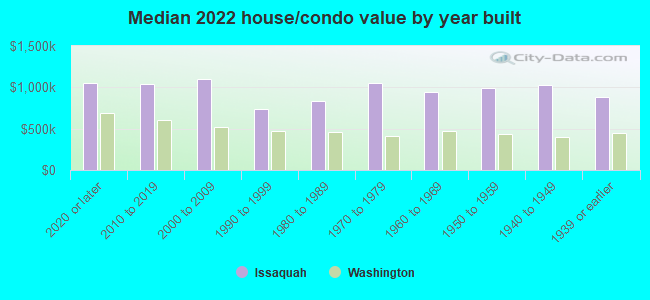
Year house built - Built 2010 or later (%)
Year house built - Built 2000 to 2009 (%)
Year house built - Built 1990 to 1999 (%)
Year house built - Built 1980 to 1989 (%)
Year house built - Built 1970 to 1979 (%)
Year house built - Built 1960 to 1969 (%)
Year house built - Built 1950 to 1959 (%)
Year house built - Built 1940 to 1949 (%)
Year house built - Built 1939 or earlier (%)
Median number of rooms in houses and condos
Median number of rooms in apartments
Median number of bedrooms in owner occupied houses
Mean number of bedrooms in owner occupied houses
Median number of bedrooms in renter occupied houses
Mean number of bedrooms in renter occupied houses
Median number of vehichles in owner occupied houses
Mean number of vehichles in owner occupied houses
Median number of vehichles in renter occupied houses
Mean number of vehichles in renter occupied houses
Rooms in owner-occupied houses - 1 room (%)
Rooms in owner-occupied houses - 2 rooms (%)
Rooms in owner-occupied houses - 3 rooms (%)
Rooms in owner-occupied houses - 4 rooms (%)
Rooms in owner-occupied houses - 5 rooms (%)
Rooms in owner-occupied houses - 6 rooms (%)
Rooms in owner-occupied houses - 7 rooms (%)
Rooms in owner-occupied houses - 8 rooms (%)
Rooms in owner-occupied houses - 9+ rooms (%)
Rooms in renter-occupied houses - 1 room (%)
Rooms in renter-occupied houses - 2 rooms (%)
Rooms in renter-occupied houses - 3 rooms (%)
Rooms in renter-occupied houses - 4 rooms (%)
Rooms in renter-occupied houses - 5 rooms (%)
Rooms in renter-occupied houses - 6 rooms (%)
Rooms in renter-occupied houses - 7 rooms (%)
Rooms in renter-occupied houses - 8 rooms (%)
Rooms in renter-occupied houses - 9+ rooms (%)
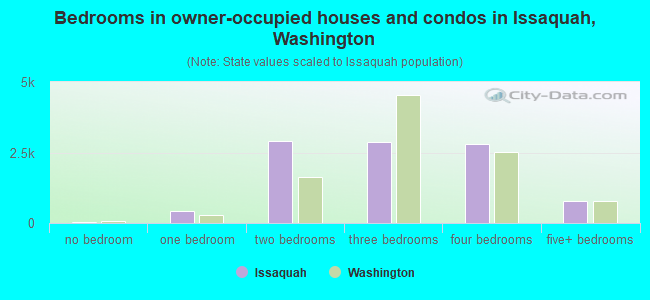
Bedrooms in owner-occupied houses - no bedrooms (%)
Bedrooms in owner-occupied houses - 1 bedroom (%)
Bedrooms in owner-occupied houses - 2 bedrooms (%)
Bedrooms in owner-occupied houses - 3 bedrooms (%)
Bedrooms in owner-occupied houses - 4 bedrooms (%)
Bedrooms in owner-occupied houses - 5+ bedrooms (%)
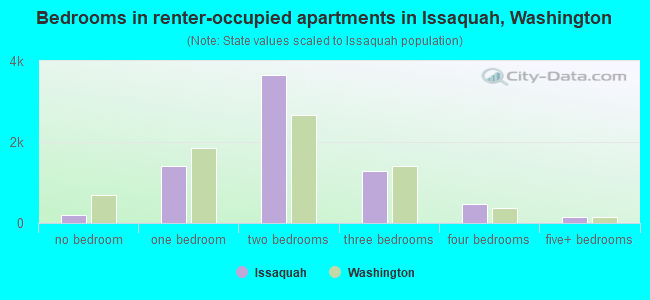
Bedrooms in renter-occupied houses - no bedrooms (%)
Bedrooms in renter-occupied houses - 1 bedroom (%)
Bedrooms in renter-occupied houses - 2 bedrooms (%)
Bedrooms in renter-occupied houses - 3 bedrooms (%)
Bedrooms in renter-occupied houses - 4 bedrooms (%)
Bedrooms in renter-occupied houses - 5+ bedrooms (%)
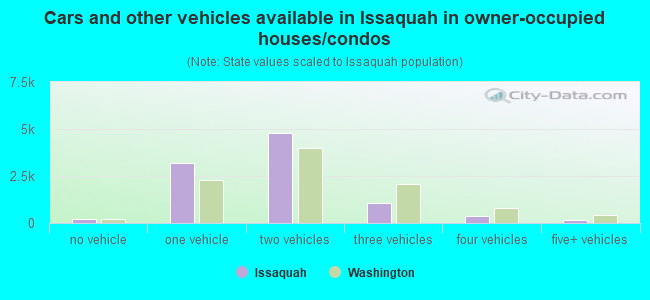
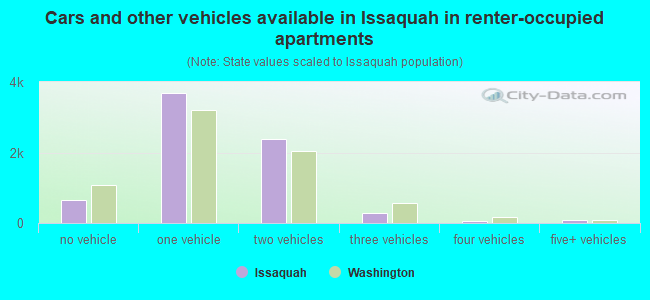
Vehicles available in owner-occupied houses - no vehicle available (%)
Vehicles available in owner-occupied houses - 1 vehicle available(%)
Vehicles available in owner-occupied houses - 2 Vehicles available (%)
Vehicles available in owner-occupied houses - 3 Vehicles available (%)
Vehicles available in owner-occupied houses - 4 Vehicles available (%)
Vehicles available in owner-occupied houses - 5+ Vehicles available (%)
Vehicles available in renter-occupied houses - no vehicle available (%)
Vehicles available in renter-occupied houses - 1 vehicle available (%)
Vehicles available in renter-occupied houses - 2 Vehicles available (%)
Vehicles available in renter-occupied houses - 3 Vehicles available (%)
Vehicles available in renter-occupied houses - 4 Vehicles available (%)
Vehicles available in renter-occupied houses - 5+ Vehicles available (%)
Housing units in structures - 1, detached (%)
Housing units in structures - 1, attached (%)
Housing units in structures - 2 (%)
Housing units in structures - 3 or 4 (%)
Housing units in structures - 5 to 9 (%)
Housing units in structures - 10 to 19 (%)
Housing units in structures - 20 to 49 (%)
Housing units in structures - 50 or more (%)
Housing units in structures - Mobile home (%)
Housing units in structures - Boat, RV, van, etc. (%)
Housing units in structures - Owners - 1, detached (%)
Housing units in structures - Owners - 1, attached (%)
Housing units in structures - Owners - 2 (%)
Housing units in structures - Owners - 3 or 4 (%)
Housing units in structures - Owners - 5 to 9 (%)
Housing units in structures - Owners - 10 to 19 (%)
Housing units in structures - Owners - 20 to 49 (%)
Housing units in structures - Owners - 50 or more (%)
Housing units in structures - Owners - Mobile home (%)
Housing units in structures - Owners - Boat, RV, van, etc. (%)
Housing units in structures - Renters - 1, detached (%)
Housing units in structures - Renters - 1, attached (%)
Housing units in structures - Renters - 2 (%)
Housing units in structures - Renters - 3 or 4 (%)
Housing units in structures - Renters - 5 to 9 (%)
Housing units in structures - Renters - 10 to 19 (%)
Housing units in structures - Renters - 20 to 49 (%)
Housing units in structures - Renters - 50 or more (%)
Housing units in structures - Renters - Mobile home (%)
Housing units in structures - Renters - Boat, RV, van, etc. (%)
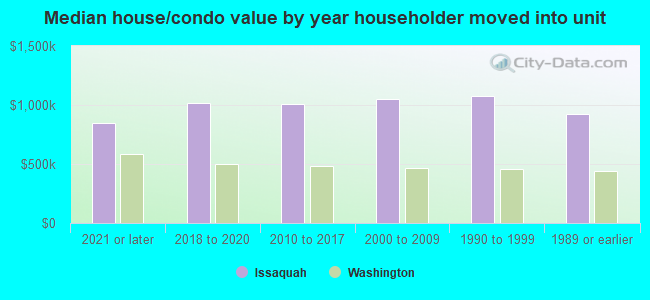
House/condo owner moved in on average (years ago)
Renter moved in on average (years ago)
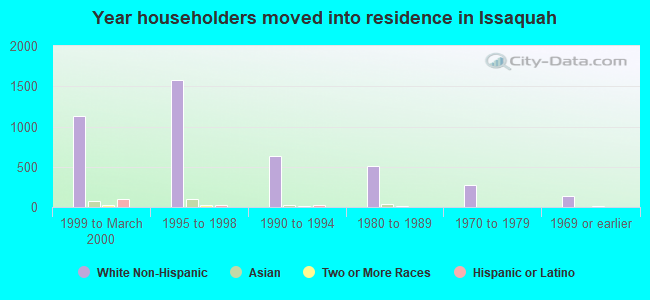
Year householder moved into unit - Moved in 1999 to March 2000 (%)
Year householder moved into unit - Moved in 1999 to March 2000 (%) - White
Year householder moved into unit - Moved in 1999 to March 2000 (%) - Black or African American
Year householder moved into unit - Moved in 1999 to March 2000 (%) - Asian
Year householder moved into unit - Moved in 1999 to March 2000 (%) - Hispanic or Latino
Year householder moved into unit - Moved in 1999 to March 2000 (%) - American Indian and Alaska Native
Year householder moved into unit - Moved in 1999 to March 2000 (%) - Multirace
Year householder moved into unit - Moved in 1999 to March 2000 (%) - Other Race
Year householder moved into unit - Moved in 1995 to 1998 (%)
Year householder moved into unit - Moved in 1995 to 1998 (%) - White
Year householder moved into unit - Moved in 1995 to 1998 (%) - Black or African American
Year householder moved into unit - Moved in 1995 to 1998 (%) - Asian
Year householder moved into unit - Moved in 1995 to 1998 (%) - Hispanic or Latino
Year householder moved into unit - Moved in 1995 to 1998 (%) - American Indian and Alaska Native
Year householder moved into unit - Moved in 1995 to 1998 (%) - Multirace
Year householder moved into unit - Moved in 1995 to 1998 (%) - Other Race
Year householder moved into unit - Moved in 1990 to 1994 (%)
Year householder moved into unit - Moved in 1990 to 1994 (%) - White
Year householder moved into unit - Moved in 1990 to 1994 (%) - Black or African American
Year householder moved into unit - Moved in 1990 to 1994 (%) - Asian
Year householder moved into unit - Moved in 1990 to 1994 (%) - Hispanic or Latino
Year householder moved into unit - Moved in 1990 to 1994 (%) - American Indian and Alaska Native
Year householder moved into unit - Moved in 1990 to 1994 (%) - Multirace
Year householder moved into unit - Moved in 1990 to 1994 (%) - Other Race
Year householder moved into unit - Moved in 1980 to 1989 (%)
Year householder moved into unit - Moved in 1980 to 1989 (%) - White
Year householder moved into unit - Moved in 1980 to 1989 (%) - Black or African American
Year householder moved into unit - Moved in 1980 to 1989 (%) - Asian
Year householder moved into unit - Moved in 1980 to 1989 (%) - Hispanic or Latino
Year householder moved into unit - Moved in 1980 to 1989 (%) - American Indian and Alaska Native
Year householder moved into unit - Moved in 1980 to 1989 (%) - Multirace
Year householder moved into unit - Moved in 1980 to 1989 (%) - Other Race
Year householder moved into unit - Moved in 1970 to 1979 (%)
Year householder moved into unit - Moved in 1970 to 1979 (%) - White
Year householder moved into unit - Moved in 1970 to 1979 (%) - Black or African American
Year householder moved into unit - Moved in 1970 to 1979 (%) - Asian
Year householder moved into unit - Moved in 1970 to 1979 (%) - Hispanic or Latino
Year householder moved into unit - Moved in 1970 to 1979 (%) - American Indian and Alaska Native
Year householder moved into unit - Moved in 1970 to 1979 (%) - Multirace
Year householder moved into unit - Moved in 1970 to 1979 (%) - Other Race
Year householder moved into unit - Moved in 1969 or earlier (%)
Year householder moved into unit - Moved in 1969 or earlier (%) - White
Year householder moved into unit - Moved in 1969 or earlier (%) - Black or African American
Year householder moved into unit - Moved in 1969 or earlier (%) - Asian
Year householder moved into unit - Moved in 1969 or earlier (%) - Hispanic or Latino
Year householder moved into unit - Moved in 1969 or earlier (%) - American Indian and Alaska Native
Year householder moved into unit - Moved in 1969 or earlier (%) - Multirace
Year householder moved into unit - Moved in 1969 or earlier (%) - Other Race
Housing units lacking complete plumbing facilities (%)
Housing units lacking complete kitchen facilities (%)
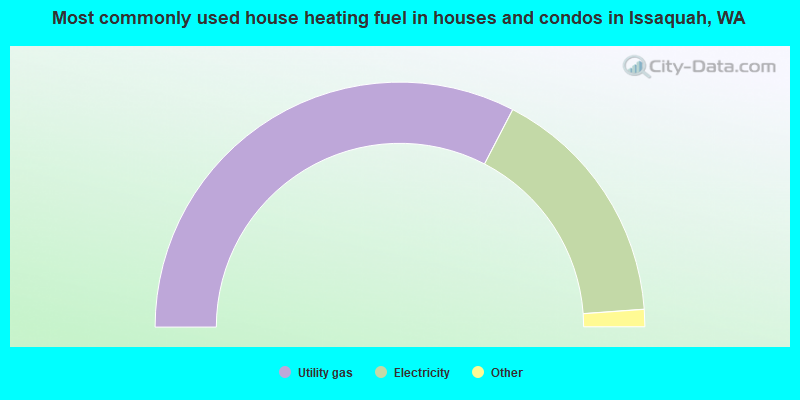
House heating fuel used in houses and condos - Utility gas (%)
House heating fuel used in houses and condos - Bottled, tank, or LP gas (%)
House heating fuel used in houses and condos - Electricity (%)
House heating fuel used in houses and condos - Fuel oil, kerosene, etc. (%)
House heating fuel used in houses and condos - Coal or coke (%)
House heating fuel used in houses and condos - Wood (%)
House heating fuel used in houses and condos - Solar energy (%)
House heating fuel used in houses and condos - Other fuel (%)
House heating fuel used in houses and condos - No fuel used (%)
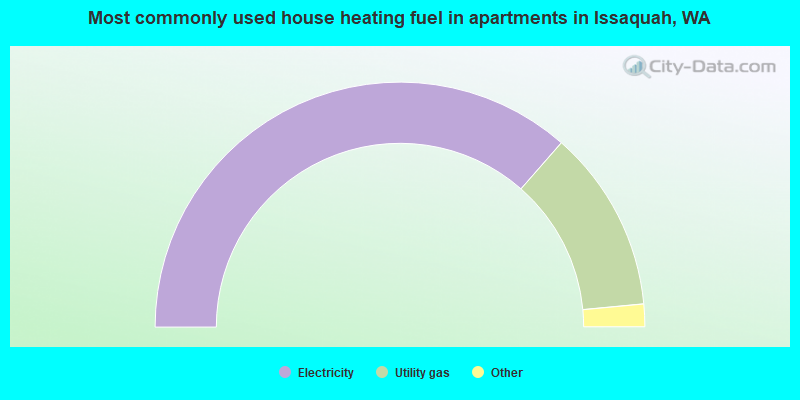
House heating fuel used in apartments - Utility gas (%)
House heating fuel used in apartments - Bottled, tank, or LP gas (%)
House heating fuel used in apartments - Electricity (%)
House heating fuel used in apartments - Fuel oil, kerosene, etc. (%)
House heating fuel used in apartments - Coal or coke (%)
House heating fuel used in apartments - Wood (%)
House heating fuel used in apartments - Solar energy (%)
House heating fuel used in apartments - Other fuel (%)
House heating fuel used in apartments - No fuel used (%)
Latest news about housing in Issaquah, WA collected exclusively by city-data.com from local newspapers, TV, and radio stations
Median year house/condo built: 2001Median year apartment built: 2007Household type by relationship:
Households: 39,617
Male householders: 9,052 (1,533 living alone ), Female householders: 7,452 (2,528 living alone )8,797 spouses (8,688 opposite-sex spouses ), 1,594 unmarried partners , (1,457 opposite-sex unmarried partners ), 10,330 children (9,909 natural , 301 adopted , 119 stepchildren ), 121 grandchildren , 224 brothers or sisters , 261 parents , 0 foster children , 302 other relatives , 1,102 non-relatives In group quarters: 377
Size of family households: 4,989 2-persons , 2,419 3-persons , 2,348 4-persons , 604 5-persons , 72 6-persons , 42 7-or-more-persons .
Size of nonfamily households: 4,367 1-person , 1,952 2-persons , 42 3-persons , 56 4-persons .
6,637 married couples with children. single-parent households (300 men , 1,013 women ).
65.8% of residents of Issaquah speak English at home. of residents speak Spanish at home (77% speak English very well , 18% speak English well , 3% speak English not well , 2% don't speak English at all ).of residents speak other Indo-European language at home (86% speak English very well , 11% speak English well , 3% speak English not well ).of residents speak Asian or Pacific Island language at home (70% speak English very well , 20% speak English well , 9% speak English not well , 1% don't speak English at all ).of residents speak other language at home (53% speak English very well , 37% speak English well , 8% speak English not well , 1% don't speak English at all ).
Foreign born population: 12,160 (30.7%)of them are naturalized citizens )
Median number of rooms in houses and condos:
Median number of rooms in apartments
Owner-occupied Renter-occupied
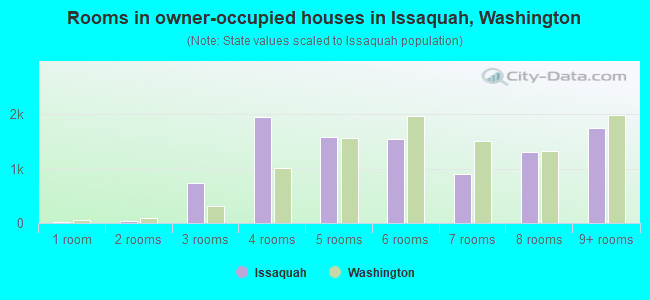
Rooms in owner-occupied houses in Issaquah, Washington
24 1 room 39 2 rooms 731 3 rooms 1,940 4 rooms 1,576 5 rooms 1,545 6 rooms 894 7 rooms 1,297 8 rooms 1,743 9+ rooms
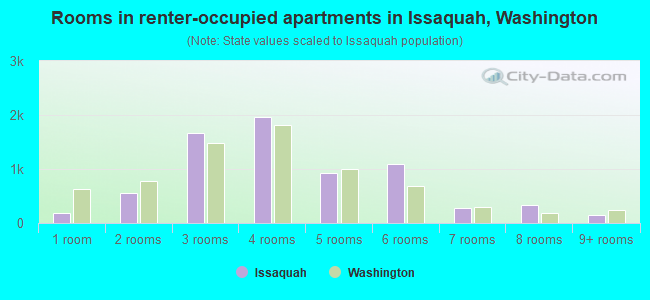
Rooms in renter-occupied apartments in Issaquah, Washington
188 1 room 550 2 rooms 1,673 3 rooms 1,967 4 rooms 930 5 rooms 1,084 6 rooms 281 7 rooms 326 8 rooms 142 9+ rooms
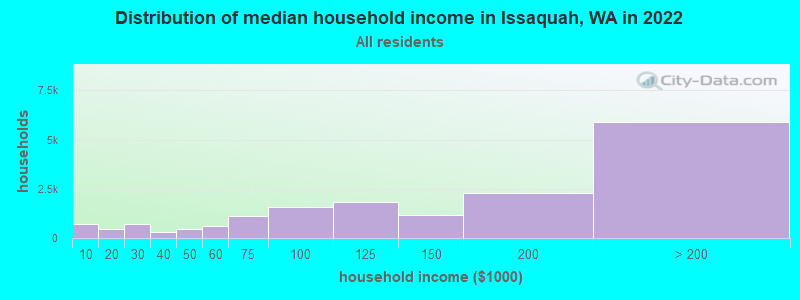
Issaquah, WA household income distribution 712 Less than $10,000439 $10,000 to $19,999699 $20,000 to $29,999300 $30,000 to $39,999463 $40,000 to $49,999586 $50,000 to $59,9991,098 $60,000 to $74,9991,558 $75,000 to $99,9991,814 $100,000 to $124,9991,165 $125,000 to $149,9992,267 $150,000 to $199,9995,891 $200,000 or more
Home value of owner - occupied houses in 2022 in Issaquah, WA 120 Less than $10,00015 $100,000 to $124,99950 $125,000 to $149,999125 $175,000 to $199,99973 $200,000 to $249,999100 $250,000 to $299,999372 $300,000 to $399,999431 $400,000 to $499,9991,448 $500,000 to $749,9992,382 $750,000 to $999,9992,322 $1,000,000 to $1,499,9991,909 $1,500,000 to $1,999,999683 $2,000,000 or moreRent paid by renters in 2022 in Issaquah, WA 73 Less than $100183 $100 to $14918 $150 to $19913 $200 to $249159 $250 to $2998 $350 to $39989 $500 to $54918 $600 to $64975 $900 to $999103 $1,000 to $1,249290 $1,250 to $1,4991,177 $1,500 to $1,9991,994 $2,000 to $2,4991,547 $2,500 to $2,999744 $3,000 to $3,499590 $3,500 or more130 No cash rent
Percentage of workers working in this county: 98.4%Number of people working at home: 8,834 (39.1% of all workers )
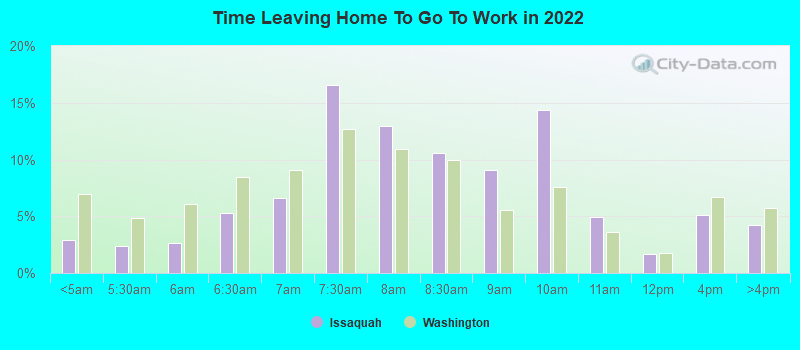
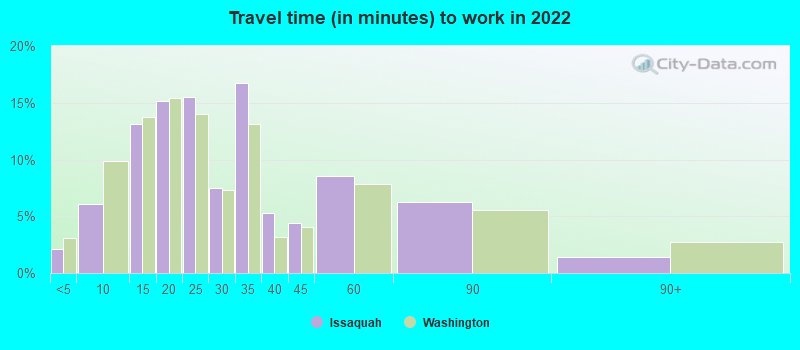
Travel time to work (commute)
Less than 5 minutes: 4495 to 9 minutes: 88410 to 14 minutes: 1,72315 to 19 minutes: 1,74920 to 24 minutes: 2,13025 to 29 minutes: 1,59830 to 34 minutes: 2,17335 to 39 minutes: 31940 to 44 minutes: 68545 to 59 minutes: 1,74160 to 89 minutes: 81190 or more minutes: 181
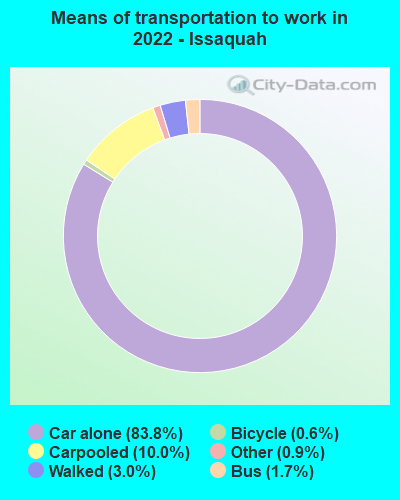
Means of transportation to work:
Drove a car alone: 18,517 (62.8%)Carpooled: 2,124 (7.2%)Bus : 225 (0.8%)Taxi: 184 (0.6%)Bicycle: 115 (0.4%)Walked: 595 (2.0%)Worked at home: 8,834 (30.0%)
Unemployment by race in 2022
Unemployment rate for White non-Hispanic residents 3.1% Males2.4% FemalesUnemployment rate for Black residents 1.9% MalesUnemployment rate for American Indian and Alaska Native residents 26.8% MalesUnemployment rate for Asian residents 1.4% Males4.2% FemalesUnemployment rate for other race residents 15.2% FemalesUnemployment rate for two or more race residents 0.6% Males1.4% FemalesUnemployment rate for Hispanic or Latino residents 1.8% Males6.2% Females
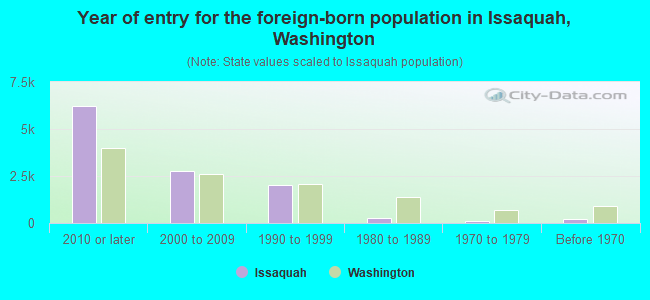
Year of entry for the foreign-born population in Issaquah, Washington
6,230 2010 or later 2,786 2000 to 2009 2,013 1990 to 1999 292 1980 to 1989 126 1970 to 1979 214 Before 1970
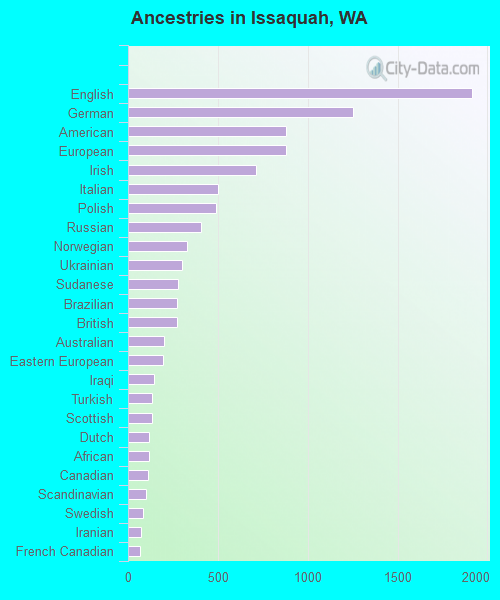
First ancestries reported:
English: 1,913 (8.4%)
German: 1,251 (5.5%)
American: 881 (3.9%)
European: 879 (3.9%)
Irish: 710 (3.1%)
Italian: 502 (2.2%)
Polish: 491 (2.2%)
Russian: 404 (1.8%)
Norwegian: 329 (1.4%)
Ukrainian: 303 (1.3%)
Sudanese: 280 (1.2%)
Brazilian: 273 (1.2%)
British: 271 (1.2%)
Australian: 202 (0.9%)
Eastern European: 197 (0.9%)
Iraqi: 142 (0.6%)
Turkish: 134 (0.6%)
Scottish: 133 (0.6%)
Dutch: 119 (0.5%)
African: 116 (0.5%)
Canadian: 112 (0.5%)
Scandinavian: 101 (0.4%)
Swedish: 82 (0.4%)
Iranian: 70 (0.3%)
French Canadian: 69 (0.3%)
Scotch-Irish: 51 (0.2%)
Egyptian: 50 (0.2%)
Lithuanian: 48 (0.2%)
Swiss: 46 (0.2%)
Northern European: 44 (0.2%)
Czechoslovakian: 42 (0.2%)
Danish: 40 (0.2%)
Romanian: 39 (0.2%)
Portuguese: 36 (0.2%)
French: 33 (0.1%)
Welsh: 32 (0.1%)
Greek: 31 (0.1%)
Croatian: 30 (0.1%)
Latvian: 19 (0.08%)
Czech: 17 (0.07%)
Slavic: 14 (0.06%)
Hungarian: 14 (0.06%)
Arab: 11 (0.05%)
Finnish: 8 (0.04%)
Bulgarian: 6 (0.03%) Most common places of birth for foreign-born residents (%): India Issaquah:
24.8% (3,013)Washington:
8.9% (101,353)
China, excluding Hong Kong and Taiwan Issaquah:
21.5% (2,618)Washington:
7.4% (84,470)
Korea Issaquah:
6.6% (808)Washington:
4.3% (48,886)
Russia Issaquah:
6.4% (779)Washington:
1.9% (21,540)
Mexico Issaquah:
5.1% (617)Washington:
21.1% (241,655)
Canada Issaquah:
3.4% (418)Washington:
4.1% (47,238)
Brazil Issaquah:
2.9% (349)Washington:
0.8% (9,359)
Taiwan Issaquah:
2.0% (242)Washington:
1.5% (16,607)
Other Eastern Africa Issaquah:
1.9% (229)Washington:
0.1% (1,599)
Vietnam Issaquah:
1.9% (226)Washington:
5.4% (62,003)
Ukraine Issaquah:
1.7% (211)Washington:
3.1% (35,872)
Hong Kong Issaquah:
1.7% (209)Washington:
0.8% (8,785)
England Issaquah:
1.7% (205)Washington:
0.8% (9,457)
Australia Issaquah:
1.7% (205)Washington:
0.4% (4,499)
Place of birth for U.S.-born residents:
This state: 12,185Other state: 14,760Northeast: 1,958Midwest: 3,747South: 2,709West: 6,351 81.0% of Issaquah residents lived in the same house 1 years ago.
Out of people who lived in different houses, 40.6% lived in this county.
Out of people who lived in different counties, 18.6% lived in Washington.
Issaquah:
81.0%State average:
85.2%
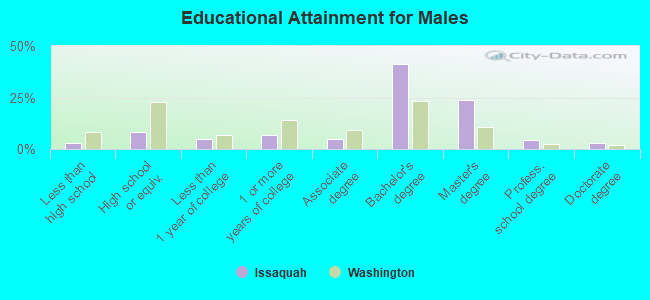
Education attainment for males 25 years and older:
No schooling: 185Nursery to 4th grade: 175th and 6th grade: 267th and 8th grade: 269th grade: 010th grade: 3411th grade: 8712th grade, no diploma: 51High school graduate (or equivalency): 1,201Less than 1 year of college: 702Some college more than 1 year, no degree: 1,046Associate degree: 717Bachelor's degree: 6,180Master's degree: 3,570Professional school degree: 627Doctorate degree: 451
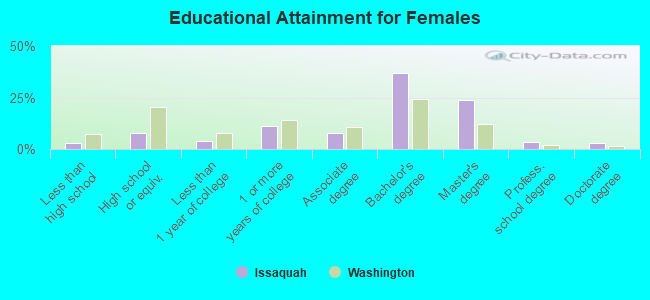
Education attainment for females 25 years and older:
No schooling: 241Nursery to 4th grade: 05th and 6th grade: 307th and 8th grade: 589th grade: 1710th grade: 811th grade: 012th grade, no diploma: 50High school graduate (or equivalency): 1,142Less than 1 year of college: 576Some college more than 1 year, no degree: 1,615Associate degree: 1,118Bachelor's degree: 5,440Master's degree: 3,491Professional school degree: 466Doctorate degree: 430
Housing units in structures:
One, detached: 6,572One, attached: 2,594Two: 3613 or 4: 8145 to 9: 1,56310 to 19: 1,95020 to 49: 1,51450 or more: 2,177Housing units lacking complete plumbing facilities in 2022: 0.5%Housing units lacking complete kitchen facilities in 2022: 0.8%House/condo owner moved in on average 8 years ago
Renter moved in on average 3 years ago
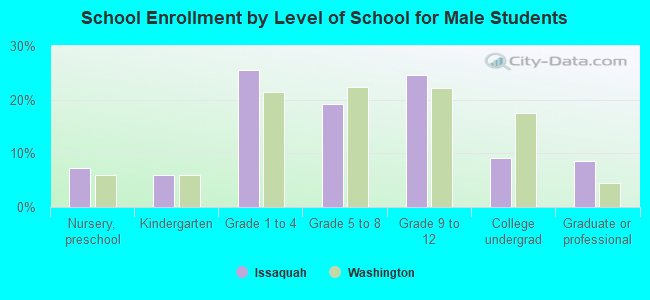
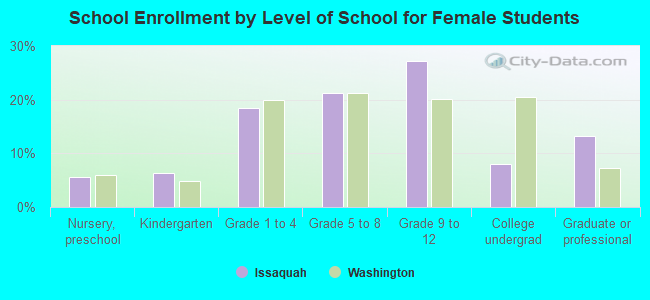
Private vs. public school enrollment:
Students in private schools in grades 1 to 8 (elementary and middle school): 376 Here:
10.1%Washington:
12.4%
Students in private schools in grades 9 to 12 (high school): 109 Students in private undergraduate colleges: 176 Here:
23.3%Washington:
16.5%