Ivins, UT (Utah) Houses and Residents
| Ivins: | $574,986 |
| Utah: | $499,500 |
Mean price in 2022:
Detached houses: $663,640
Here: $663,640 State: $607,750 Townhouses or other attached units: $486,159
Here: $486,159 State: $444,505 Mobile homes: $332,420
Here: $332,420 State: $113,475
Total population: 7,665 (Urban population: 3,838, Rural population: 592 (8 farm, 584 nonfarm))
Houses: 4,578 (4,101 occupied: 3,377 owner occupied, 837 renter occupied)
| % of renters here: | 20% |
| State: | 29% |
Housing density: 449 houses/condos per square mile
Median price asked for vacant for-sale houses and condos in 2022 in this county: $769,750.
Median contract rent in 2022: $1,561 (lower quartile is $1,325, upper quartile is $1,873)
Median rent asked for vacant for-rent units in 2022: $1,433
Median gross rent in Ivins, UT in 2022: $1,740
Housing units in Ivins with a mortgage: 2,188 (276 second mortgage, 0 home equity loan, 252 both second mortgage and home equity loan)
Houses without a mortgage: 19
Median household income for houses/condos with a mortgage: $82,446
Median household income for apartments without a mortgage: $58,646
Median monthly housing costs: $1,441
Compare current foreclosures near Ivins, UT:
| Photo | Address | Area | Beds / Baths | Price | Details |
|---|---|---|---|---|---|

|
#1
E 100 N
Ivins, UT 84738
|
1,137 sq. feet
|
2 baths 3 beds |
show details | |

|
#2
E 60 S
Ivins, UT 84738
|
1,503 sq. feet
|
2 baths 3 beds |
show details | |

|
#3
Tuacahn Dr Unit 36
Ivins, UT 84738
|
2,936 sq. feet
|
3 baths 7 beds |
show details | |

|
#4
E 710 S
Ivins, UT 84738
|
1,415 sq. feet
|
2 baths 3 beds |
show details | |

|
#5
S 320 E
Ivins, UT 84738
|
1,108 sq. feet
|
2 baths 3 beds |
show details | |

|
#6
E 100 S
Ivins, UT 84738
|
- sq. feet
|
- baths - beds |
show details | |

|
#7
W Old Highway 91 # 11
Ivins, UT 84738
|
- sq. feet
|
- baths - beds |
show details | |

|
#8
E 800 S
Ivins, UT 84738
|
- sq. feet
|
- baths - beds |
show details | |

|
#9
W Big Horn Way
Ivins, UT 84738
|
- sq. feet
|
- baths - beds |
show details | |

|
#10
W 2440 S
Hurricane, UT 84737
|
2,513 sq. feet
|
3 baths 5 beds |
show details |
| Photo | Address | Area | Beds / Baths | Price | Details |
|---|---|---|---|---|---|

|
#11
N 1900 W
Saint George, UT 84770
|
1,504 sq. feet
|
1 baths 3 beds |
show details | |

|
#12
W Blue Mountain Rd
Washington, UT 84780
|
4,177 sq. feet
|
3 baths 4 beds |
show details | |

|
#13
Goldenrod Cir
Saint George, UT 84790
|
2,644 sq. feet
|
2 baths 2 beds |
show details | |

|
#14
E 700 N
Saint George, UT 84790
|
1,424 sq. feet
|
2 baths 3 beds |
show details | |

|
#15
N 2270 East Cir
Saint George, UT 84790
|
1,139 sq. feet
|
2 baths 3 beds |
show details | |

|
#16
Aztec Rd
Saint George, UT 84790
|
1,737 sq. feet
|
2 baths 3 beds |
show details | |

|
#17
E Riverside Dr Unit 22
Saint George, UT 84790
|
1,324 sq. feet
|
2 baths 3 beds |
show details | |

|
#18
Quail Ridge Dr
Washington, UT 84780
|
1,354 sq. feet
|
2 baths 3 beds |
show details | |

|
#19
E 700 S, Apt 55
Saint George, UT 84770
|
1,443 sq. feet
|
2 baths 3 beds |
show details | |

|
#20
Escalante Dr
Saint George, UT 84790
|
3,592 sq. feet
|
3 baths 6 beds |
show details |
| Photo | Address | Area | Beds / Baths | Price | Details |
|---|---|---|---|---|---|

|
#21
S River Rd Unit 13
Saint George, UT 84790
|
1,774 sq. feet
|
2 baths 3 beds |
show details | |

|
#22
Escalante Dr
Saint George, UT 84790
|
1,794 sq. feet
|
2 baths 3 beds |
show details | |

|
#23
E 400 S, Unit 31
Saint George, UT 84790
|
1,382 sq. feet
|
2 baths 3 beds |
show details | |

|
#24
W 300 S
Saint George, UT 84770
|
1,082 sq. feet
|
1 baths 2 beds |
show details | |

|
#25
W 300 N
Saint George, UT 84770
|
2,918 sq. feet
|
3 baths 5 beds |
show details | |

|
#26
W Indian Hills Dr Unit 38
Saint George, UT 84770
|
1,482 sq. feet
|
2 baths 3 beds |
show details | |

|
#27
W 600 N
Saint George, UT 84770
|
1,276 sq. feet
|
1 baths 2 beds |
show details | |

|
#28
S Golda Dr
Saint George, UT 84790
|
2,618 sq. feet
|
3 baths 3 beds |
show details | |

|
#29
S Hidden Valley Dr Unit 174
Saint George, UT 84790
|
1,430 sq. feet
|
2 baths 3 beds |
show details | |

|
#30
Manzanita Rd Apt 8
Saint George, UT 84790
|
4,508 sq. feet
|
3 baths 2 beds |
show details |
| Photo | Address | Area | Beds / Baths | Price | Details |
|---|---|---|---|---|---|

|
#31
Bluff View Dr Unit 96
Washington, UT 84780
|
1,868 sq. feet
|
3 baths 3 beds |
show details | |

|
#32
W 40 N
Hurricane, UT 84737
|
1,289 sq. feet
|
2 baths 3 beds |
show details | |

|
#33
W 2440 S
Hurricane, UT 84737
|
2,513 sq. feet
|
3 baths 5 beds |
show details | |

|
#34
E Sweetwater Springs Dr
Washington, UT 84780
|
1,442 sq. feet
|
2 baths 3 beds |
show details | |

|
#35
N Ocotillo Dr
Washington, UT 84780
|
2,120 sq. feet
|
3 baths 5 beds |
show details | |

|
#36
E Telegraph St Lot 64
Washington, UT 84780
|
408 sq. feet
|
1 baths 1 beds |
show details | |

|
#37
S White Sands Dr
Washington, UT 84780
|
2,330 sq. feet
|
2 baths 3 beds |
show details | |

|
#38
S River Rd Unit 8
Saint George, UT 84790
|
1,460 sq. feet
|
2 baths 3 beds |
show details | |

|
#39
S River Rd # 9
Saint George, UT 84790
|
2,309 sq. feet
|
2 baths 3 beds |
show details | |

|
#40
Latonia Cir
Saint George, UT 84790
|
1,952 sq. feet
|
2 baths 3 beds |
show details |
| Photo | Address | Area | Beds / Baths | Price | Details |
|---|---|---|---|---|---|

|
#41
S 2300 E
Saint George, UT 84790
|
4,732 sq. feet
|
4 baths 7 beds |
show details | |

|
#42
Jeffs Dr
Washington, UT 84780
|
1,219 sq. feet
|
2 baths 3 beds |
show details | |

|
#43
W Washington Palms Way
Washington, UT 84780
|
1,733 sq. feet
|
2 baths 3 beds |
show details | |

|
#44
Palmetto Cir
Saint George, UT 84790
|
3,328 sq. feet
|
3 baths 5 beds |
show details | |

|
#45
S Hidden Valley Dr Unit 203
Saint George, UT 84790
|
1,430 sq. feet
|
2 baths 3 beds |
show details | |

|
#46
Ridge Rim Way
Saint George, UT 84770
|
1,200 sq. feet
|
2 baths 3 beds |
show details | |

|
#47
Desert Rose Dr
Saint George, UT 84790
|
1,015 sq. feet
|
2 baths 2 beds |
show details | |

|
#48
Alamosa Dr
Washington, UT 84780
|
1,749 sq. feet
|
3 baths 5 beds |
show details | |

|
#49
S 1250 W
Saint George, UT 84770
|
1,392 sq. feet
|
2 baths 3 beds |
show details | |

|
Check over 1 million property listings on Foreclosure.com!
|
browse all offers | |||

Latest news about housing in Ivins, UT collected exclusively by city-data.com from local newspapers, TV, and radio stations

 | Ivins City Municipal Elections....The Growth Issue (1 reply) |
| Bought a home in St George.. (19 replies) |
| Moving to St George area (6 replies) |
| Nuances of Washington vs Ivins vs St. George (2 replies) |
| Livable wage? (52 replies) |
| Water other than sand hollow within an hour? (16 replies) |

Median year apartment built: 2003
Household type by relationship:
Households: 9,893- Male householders: 1,927 (422 living alone), Female householders: 2,128 (603 living alone)
2,410 spouses (2,396 opposite-sex spouses), 194 unmarried partners, (148 opposite-sex unmarried partners), 2,839 children (2,417 natural, 323 adopted, 98 stepchildren), 70 grandchildren, 45 brothers or sisters, 7 parents, 0 foster children, 157 other relatives, 61 non-relatives
- In group quarters: 51
Size of family households: 1,912 2-persons, 520 3-persons, 199 4-persons, 188 5-persons, 129 6-persons, 73 7-or-more-persons.
Size of nonfamily households: 1,041 1-person, 165 2-persons.
1,433 married couples with children.
396 single-parent households (87 men, 309 women).
93.9% of residents of Ivins speak English at home.
3.8% of residents speak Spanish at home (52% speak English very well, 41% speak English well, 7% speak English not well).
1.8% of residents speak other Indo-European language at home (92% speak English very well, 8% speak English well).
1.6% of residents speak Asian or Pacific Island language at home (69% speak English very well, 31% speak English well).
Foreign born population: 320 (3.2%)
(41.9% of them are naturalized citizens)
| Here: | 6.5 |
| State: | 7.6 |
| Here: | 5.4 |
| State: | 4.3 |

- Bedrooms in owner-occupied houses and condos in Ivins, Utah
- 0no bedroom
- 01 bedroom
- 2052 bedrooms
- 1,9343 bedrooms
- 9214 bedrooms
- 3175+ bedrooms

- Bedrooms in renter-occupied apartments in Ivins, Utah
- 0no bedroom
- 151 bedroom
- 1582 bedrooms
- 5023 bedrooms
- 1624 bedrooms
- 05+ bedrooms

- Cars and other vehicles available in Ivins in owner-occupied houses/condos
- 0no vehicle
- 1,0351 vehicle
- 1,4522 vehicles
- 4953 vehicles
- 3154 vehicles
- 805+ vehicles

- Cars and other vehicles available in Ivins in renter-occupied apartments
- 69no vehicle
- 3141 vehicle
- 2012 vehicles
- 2353 vehicles
- 184 vehicles
- 05+ vehicles

- Rooms in owner-occupied houses in Ivins, Utah
- 01 room
- 02 rooms
- 183 rooms
- 2454 rooms
- 6795 rooms
- 8546 rooms
- 5117 rooms
- 5328 rooms
- 5389+ rooms

- Rooms in renter-occupied apartments in Ivins, Utah
- 01 room
- 02 rooms
- 313 rooms
- 824 rooms
- 4385 rooms
- 1366 rooms
- 647 rooms
- 868 rooms
- 09+ rooms


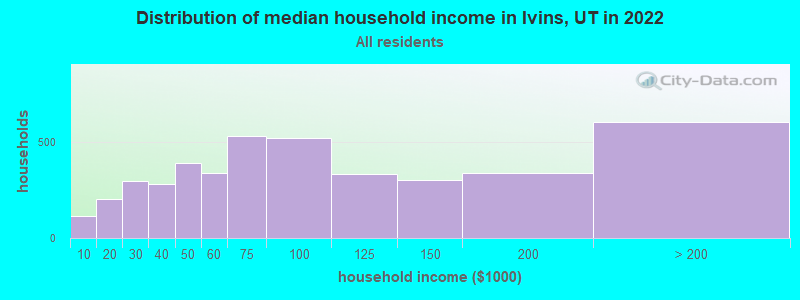
Ivins, UT household income distribution

- 117Less than $10,000
- 204$10,000 to $19,999
- 297$20,000 to $29,999
- 280$30,000 to $39,999
- 390$40,000 to $49,999
- 341$50,000 to $59,999
- 531$60,000 to $74,999
- 521$75,000 to $99,999
- 332$100,000 to $124,999
- 303$125,000 to $149,999
- 340$150,000 to $199,999
- 606$200,000 or more
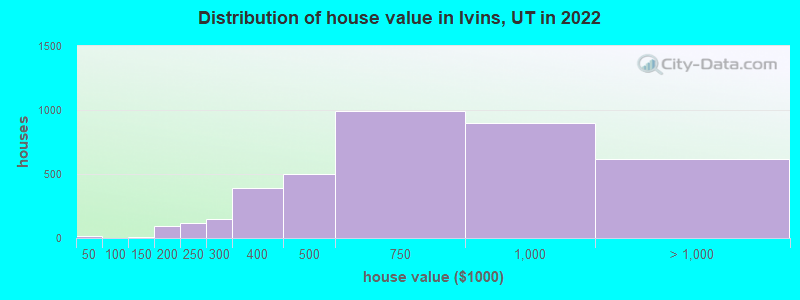
Home value of owner - occupied houses in 2022 in Ivins, UT
-
- 13$30,000 to $34,999
- 7$125,000 to $149,999
- 11$150,000 to $174,999
- 83$175,000 to $199,999
- 120$200,000 to $249,999
- 144$250,000 to $299,999
- 389$300,000 to $399,999
- 501$400,000 to $499,999
- 990$500,000 to $749,999
- 900$750,000 to $999,999
- 452$1,000,000 to $1,499,999
- 15$1,500,000 to $1,999,999
- 149$2,000,000 or more
Rent paid by renters in 2022 in Ivins, UT
-
- 16$500 to $549
- 36$550 to $599
- 43$900 to $999
- 185$1,000 to $1,249
- 177$1,250 to $1,499
- 213$1,500 to $1,999
- 17$2,000 to $2,499
- 16$3,500 or more
- 76No cash rent


Percentage of workers working in this county: 94.8%
Number of people working at home: 966 (25.4% of all workers)
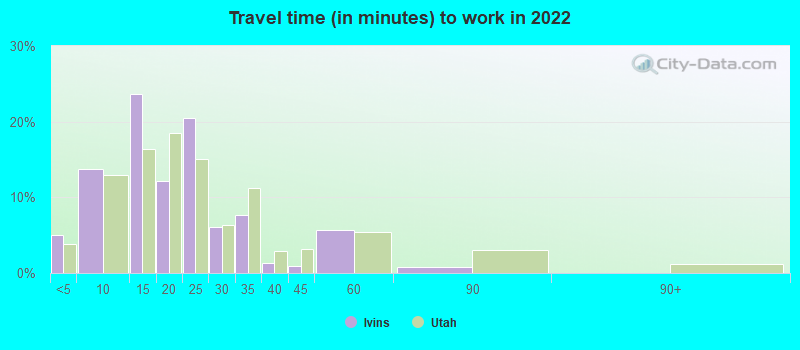
Travel time to work (commute)
- Less than 5 minutes: 128
- 5 to 9 minutes: 342
- 10 to 14 minutes: 313
- 15 to 19 minutes: 615
- 20 to 24 minutes: 707
- 25 to 29 minutes: 235
- 30 to 34 minutes: 408
- 35 to 39 minutes: 18
- 40 to 44 minutes: 0
- 45 to 59 minutes: 51
- 60 to 89 minutes: 0
- 90 or more minutes: 73
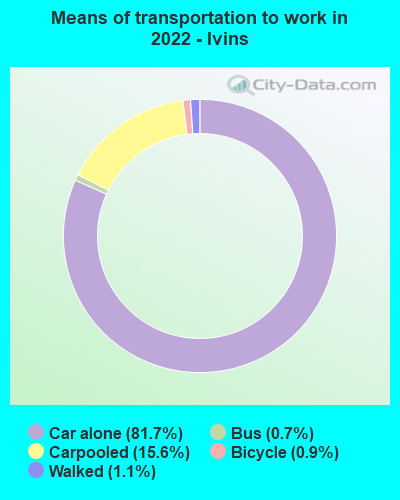
Means of transportation to work:
- Drove a car alone: 1,427 (53.7%)
- Carpooled: 292 (11.0%)
- Bus: 11 (0.4%)
- Bicycle: 18 (0.7%)
- Walked: 24 (0.9%)
- Worked at home: 966 (36.4%)

- Unemployment by race in 2022
- Unemployment rate for White non-Hispanic residents
- 1.6%Males
- 5.1%Females
- Unemployment rate for Asian residents
- 43.5%Females
- Unemployment rate for Hispanic or Latino residents
- 45.7%Females

- Year of entry for the foreign-born population in Ivins, Utah
- 422010 or later
- 1202000 to 2009
- 401990 to 1999
- 231980 to 1989
- 231970 to 1979
- 47Before 1970

First ancestries reported:
- English: 1,246 (27.8%)
- American: 819 (18.3%)
- German: 501 (11.2%)
- Norwegian: 278 (6.2%)
- Ukrainian: 174 (3.9%)
- Irish: 123 (2.7%)
- European: 101 (2.3%)
- Scandinavian: 101 (2.3%)
- Dutch: 86 (1.9%)
- Swedish: 83 (1.9%)
- French: 47 (1.0%)
- Italian: 42 (0.9%)
- Scottish: 31 (0.7%)
- Danish: 28 (0.6%)
- Northern European: 27 (0.6%)
- Haitian: 26 (0.6%)
- Serbian: 25 (0.6%)
- Swiss: 23 (0.5%)
- Slovak: 18 (0.4%)
- Romanian: 12 (0.3%)
- Greek: 11 (0.2%)
- British: 9 (0.2%)
- Eastern European: 9 (0.2%)
- Hungarian: 8 (0.2%)
Most common places of birth for foreign-born residents (%):
| Ivins: | 33.6% (93) |
| Utah: | 36.1% (99,740) |
| Ivins: | 22.0% (61) |
| Utah: | 0.5% (1,315) |
| Ivins: | 20.6% (57) |
| Utah: | 1.6% (4,524) |
| Ivins: | 14.4% (40) |
| Utah: | 1.3% (3,479) |
| Ivins: | 8.7% (24) |
| Utah: | 2.3% (6,468) |
| Ivins: | 6.1% (17) |
| Utah: | 0.1% (389) |
| Ivins: | 5.4% (15) |
| Utah: | 2.8% (7,644) |
| Ivins: | 4.7% (13) |
| Utah: | 3.0% (8,341) |
Place of birth for U.S.-born residents:
- This state: 5,264
- Other state: 4,265
- Northeast: 268
- Midwest: 657
- South: 659
- West: 2,647
82.0% of Ivins residents lived in the same house 1 years ago.
Out of people who lived in different houses, 36.5% lived in this county.
Out of people who lived in different counties, 33.2% lived in Utah.
| Ivins: | 82.0% |
| State average: | 85.7% |
Education attainment for males 25 years and older:
- No schooling: 28
- Nursery to 4th grade: 10
- 5th and 6th grade: 0
- 7th and 8th grade: 0
- 9th grade: 0
- 10th grade: 49
- 11th grade: 0
- 12th grade, no diploma: 69
- High school graduate (or equivalency): 512
- Less than 1 year of college: 138
- Some college more than 1 year, no degree: 640
- Associate degree: 259
- Bachelor's degree: 1,556
- Master's degree: 332
- Professional school degree: 219
- Doctorate degree: 145

Education attainment for females 25 years and older:
- No schooling: 0
- Nursery to 4th grade: 7
- 5th and 6th grade: 0
- 7th and 8th grade: 5
- 9th grade: 6
- 10th grade: 0
- 11th grade: 51
- 12th grade, no diploma: 0
- High school graduate (or equivalency): 669
- Less than 1 year of college: 312
- Some college more than 1 year, no degree: 551
- Associate degree: 311
- Bachelor's degree: 1,029
- Master's degree: 486
- Professional school degree: 62
- Doctorate degree: 34


Housing units in structures:
- One, detached: 4,162
- One, attached: 153
- 3 or 4: 19
- 5 to 9: 39
- 20 to 49: 16
- 50 or more: 14
- Mobile homes: 173
Median worth of mobile homes: $256,607
House/condo owner moved in on average 7 years ago
Renter moved in on average 1 years ago

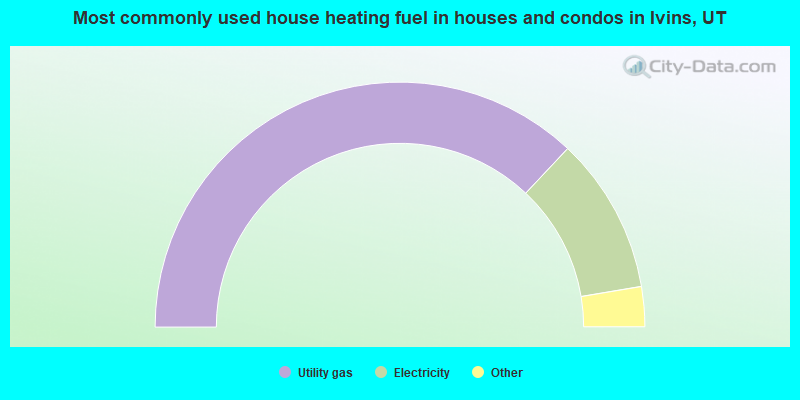
- 74.1%Utility gas
- 20.7%Electricity
- 3.6%Solar energy
- 0.9%Wood
- 0.5%Bottled, tank, or LP gas
- 0.2%Fuel oil, kerosene, etc.
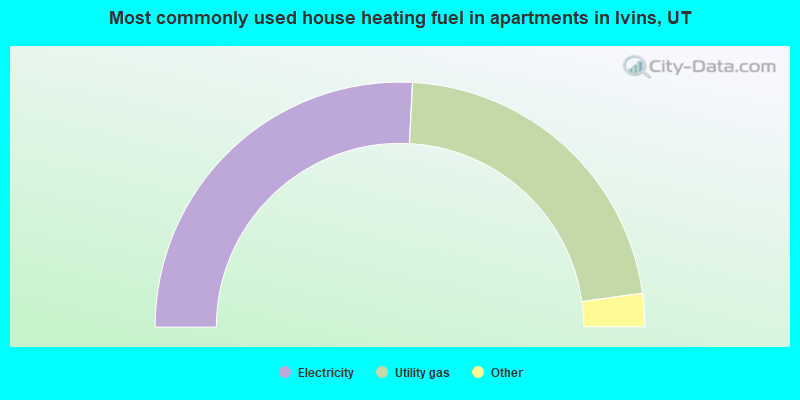
- 51.7%Electricity
- 44.0%Utility gas
- 2.4%Solar energy
- 1.9%No fuel used
Private vs. public school enrollment:
| Here: | 3.4% |
| Utah: | 7.2% |
| Here: | 0.0% |
| Utah: | 5.3% |
| Here: | 3.7% |
| Utah: | 26.7% |


