Jacksonville, AR (Arkansas) Houses and Residents
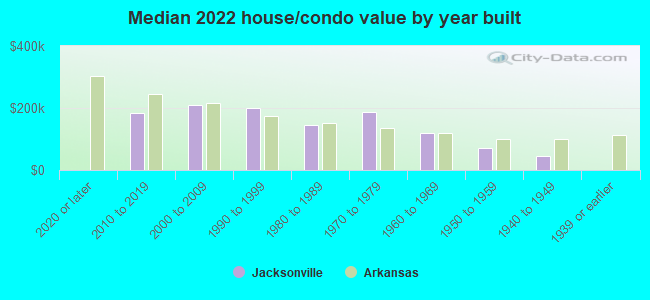
| Jacksonville: | $161,511 |
| Arkansas: | $179,800 |
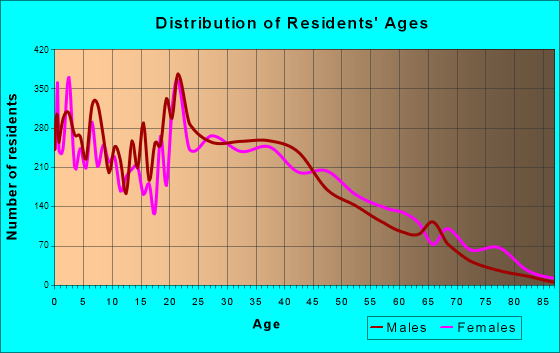
Total population: 28,808 (Urban population: 28,391, Rural population: 1,396 (all nonfarm))
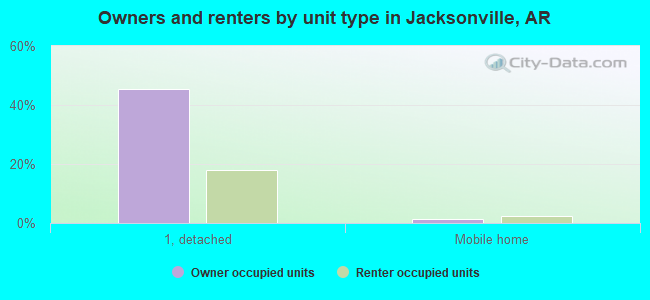
Houses: 13,580 (11,836 occupied: 5,895 owner occupied, 6,241 renter occupied)
| % of renters here: | 51% |
| State: | 34% |
Housing density: 515 houses/condos per square mile
Median price asked for vacant for-sale houses and condos in 2022: $113,725.
Median contract rent in 2022: $650 (lower quartile is $524, upper quartile is $945)
Median rent asked for vacant for-rent units in 2022: $663
Median gross rent in Jacksonville, AR in 2022: $831
Housing units in Jacksonville with a mortgage: 3,591 (361 second mortgage, 33 home equity loan, 191 both second mortgage and home equity loan)
Houses without a mortgage: 206
Median household income for houses/condos with a mortgage: $80,057
Median household income for apartments without a mortgage: $58,982
Median monthly housing costs: $822
Compare current foreclosures in Jacksonville, AR:
| Photo | Address | Area | Beds / Baths | Price | Details |
|---|---|---|---|---|---|

|
#1
Steeple Chase Dr
Jacksonville, AR 72076
|
2,160 sq. feet
|
2 baths 3 beds |
show details | |

|
#2
Lee St
Jacksonville, AR 72076
|
1,358 sq. feet
|
2 baths 3 beds |
show details | |

|
#3
Sorrells Dr
Jacksonville, AR 72076
|
1,728 sq. feet
|
2 baths 3 beds |
show details | |

|
#4
John Shelton Rd
Jacksonville, AR 72076
|
1,373 sq. feet
|
2 baths 3 beds |
show details | |

|
#5
South Highway 161
Jacksonville, AR 72076
|
1,422 sq. feet
|
2 baths 2 beds |
show details | |

|
#6
N Jeff Davis St
Jacksonville, AR 72076
|
1,501 sq. feet
|
2 baths 3 beds |
show details | |

|
#7
Ellis St
Jacksonville, AR 72076
|
984 sq. feet
|
1 baths - beds |
show details | |

|
#8
Caddo Trl
Jacksonville, AR 72076
|
2,331 sq. feet
|
2 baths - beds |
show details | |

|
#9
Batesville Pike
Jacksonville, AR 72076
|
1,344 sq. feet
|
2 baths - beds |
show details | |

|
#10
Randall Dr
Jacksonville, AR 72076
|
1,320 sq. feet
|
1 baths - beds |
show details |
| Photo | Address | Area | Beds / Baths | Price | Details |
|---|---|---|---|---|---|

|
#11
S Jp Wright Loop Rd
Jacksonville, AR 72076
|
936 sq. feet
|
1 baths - beds |
show details | |

|
#12
Harold St
Jacksonville, AR 72076
|
1,365 sq. feet
|
1 baths - beds |
show details | |

|
#13
Mcarthur Dr
Jacksonville, AR 72076
|
1,036 sq. feet
|
1 baths - beds |
show details | |

|
#14
Harris Rd
Jacksonville, AR 72076
|
1,843 sq. feet
|
2 baths - beds |
show details | |

|
#15
Stevenson St
Jacksonville, AR 72076
|
936 sq. feet
|
1 baths - beds |
show details | |

|
#16
Adams Dr
Jacksonville, AR 72076
|
2,754 sq. feet
|
2 baths - beds |
show details | |

|
#17
Southern St
Jacksonville, AR 72076
|
1,002 sq. feet
|
1 baths - beds |
show details | |

|
#18
Quapaw Trl
Jacksonville, AR 72076
|
2,504 sq. feet
|
2 baths - beds |
show details | |

|
#19
Troop Ct
Jacksonville, AR 72076
|
1,923 sq. feet
|
2 baths - beds |
show details | |

|
#20
Northeastern Ave
Jacksonville, AR 72076
|
1,868 sq. feet
|
2 baths - beds |
show details |
| Photo | Address | Area | Beds / Baths | Price | Details |
|---|---|---|---|---|---|

|
#21
Collins Rd
Jacksonville, AR 72076
|
1,224 sq. feet
|
2 baths - beds |
show details | |

|
#22
Pike Ave
Jacksonville, AR 72076
|
775 sq. feet
|
1 baths - beds |
show details | |

|
#23
Gibson Rd
Jacksonville, AR 72076
|
1,704 sq. feet
|
2 baths - beds |
show details | |

|
#24
W Valentine Rd
Jacksonville, AR 72076
|
800 sq. feet
|
1 baths - beds |
show details | |

|
#25
N Ridge Dr
Jacksonville, AR 72076
|
2,176 sq. feet
|
2 baths - beds |
show details | |

|
#26
Gail Ct
Jacksonville, AR 72076
|
1,112 sq. feet
|
1 baths - beds |
show details | |

|
#27
Gregory St
Jacksonville, AR 72076
|
1,962 sq. feet
|
2 baths - beds |
show details | |

|
#28
Wells Fargo Trl
Jacksonville, AR 72076
|
1,347 sq. feet
|
2 baths - beds |
show details | |

|
#29
Paul Pl
Jacksonville, AR 72076
|
1,076 sq. feet
|
1 baths - beds |
show details | |

|
#30
N Gray St
Jacksonville, AR 72076
|
1,634 sq. feet
|
1 baths - beds |
show details |
| Photo | Address | Area | Beds / Baths | Price | Details |
|---|---|---|---|---|---|

|
#31
Foxhunt Cv
Jacksonville, AR 72076
|
2,045 sq. feet
|
2 baths - beds |
show details | |

|
#32
N Bailey Blvd
Jacksonville, AR 72076
|
1,650 sq. feet
|
1 baths - beds |
show details | |

|
#33
Oneida St
Jacksonville, AR 72076
|
1,762 sq. feet
|
2 baths - beds |
show details | |

|
#34
Nina St
Jacksonville, AR 72076
|
1,104 sq. feet
|
1 baths - beds |
show details | |

|
#35
Glade Rd
Jacksonville, AR 72076
|
1,577 sq. feet
|
2 baths - beds |
show details | |

|
#36
Karen Cv
Jacksonville, AR 72076
|
1,181 sq. feet
|
1 baths - beds |
show details | |

|
#37
Haley Ct
Jacksonville, AR 72076
|
1,181 sq. feet
|
2 baths - beds |
show details | |

|
#38
Boston St
Jacksonville, AR 72076
|
1,263 sq. feet
|
2 baths - beds |
show details | |

|
#39
Flight Ct
Jacksonville, AR 72076
|
1,704 sq. feet
|
2 baths - beds |
show details | |

|
#40
Sherman Hills Rd
Jacksonville, AR 72076
|
2,250 sq. feet
|
2 baths - beds |
show details |
| Photo | Address | Area | Beds / Baths | Price | Details |
|---|---|---|---|---|---|

|
#41
Collins Rd
Jacksonville, AR 72076
|
1,224 sq. feet
|
1 baths - beds |
show details | |

|
#42
Cole Dr
Jacksonville, AR 72076
|
1,152 sq. feet
|
2 baths - beds |
show details | |

|
#43
Pike Ave
Jacksonville, AR 72076
|
972 sq. feet
|
1 baths - beds |
show details | |

|
#44
Park Dr
Jacksonville, AR 72076
|
1,385 sq. feet
|
1 baths - beds |
show details | |

|
#45
Yellow Oak Dr
Jacksonville, AR 72076
|
2,562 sq. feet
|
2 baths - beds |
show details | |

|
#46
Red Wing Rd
Jacksonville, AR 72076
|
1,818 sq. feet
|
2 baths - beds |
show details | |

|
#47
South Rd
Jacksonville, AR 72076
|
1,690 sq. feet
|
3 baths - beds |
show details | |

|
#48
Smart St
Jacksonville, AR 72076
|
1,002 sq. feet
|
1 baths - beds |
show details | |

|
#49
Georgeann Cir
Jacksonville, AR 72076
|
1,311 sq. feet
|
2 baths - beds |
show details | |

|
Check over 1 million property listings on Foreclosure.com!
|
browse all offers | |||

Latest news about housing in Jacksonville, AR collected exclusively by city-data.com from local newspapers, TV, and radio stations

 | Ward/Cabot (16 replies) |
| Moving to Jacksonville/Cabot, questions on home purchase (0 replies) |
| Areas to avoid in NLR/Sherwood (5 replies) |
| jacksonville, Ar neighborhoods (0 replies) |
| Moving from upstate NY to LR, advice? (7 replies) |
| Looking for a home (16 replies) |
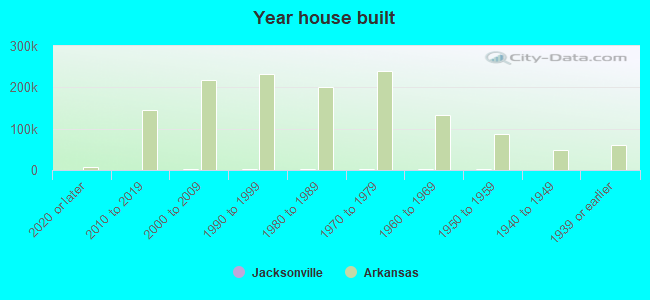
Median year apartment built: 1979
Household type by relationship:
Households: 29,392- Male householders: 5,333 (1,918 living alone), Female householders: 6,350 (1,877 living alone)
4,707 spouses (4,606 opposite-sex spouses), 710 unmarried partners, (632 opposite-sex unmarried partners), 8,682 children (8,134 natural, 213 adopted, 334 stepchildren), 802 grandchildren, 236 brothers or sisters, 296 parents, 51 foster children, 426 other relatives, 932 non-relatives
- In group quarters: 860
Size of family households: 3,213 2-persons, 1,739 3-persons, 867 4-persons, 515 5-persons, 234 6-persons, 117 7-or-more-persons.
Size of nonfamily households: 4,484 1-person, 704 2-persons, 67 3-persons, 19 4-persons, 25 5-persons.
3,567 married couples with children.
2,463 single-parent households (377 men, 2,086 women).
93.6% of residents of Jacksonville speak English at home.
2.7% of residents speak Spanish at home (54% speak English very well, 23% speak English well, 12% speak English not well, 11% don't speak English at all).
1.6% of residents speak other Indo-European language at home (97% speak English very well, 1% speak English well, 2% speak English not well).
1.7% of residents speak Asian or Pacific Island language at home (52% speak English very well, 34% speak English well, 8% speak English not well, 6% don't speak English at all).
0.1% of residents speak other language at home (100% speak English very well).
Foreign born population: 1,056 (3.6%)
(80.8% of them are naturalized citizens)
| Here: | 6.4 |
| State: | 6.1 |
| Here: | 4.6 |
| State: | 4.3 |
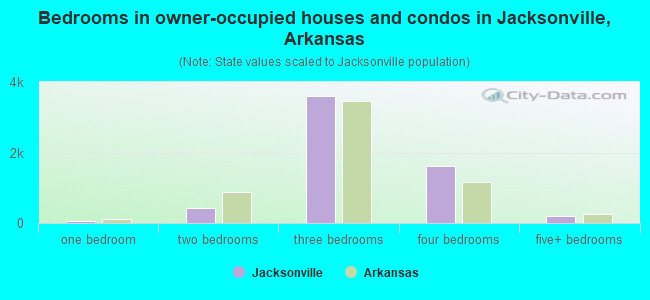
- Bedrooms in owner-occupied houses and condos in Jacksonville, Arkansas
- 0no bedroom
- 591 bedroom
- 4322 bedrooms
- 3,5923 bedrooms
- 1,6204 bedrooms
- 1935+ bedrooms
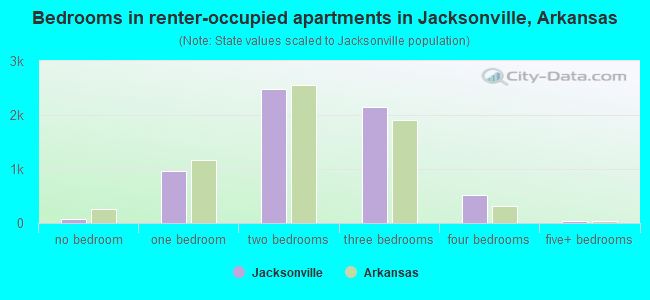
- Bedrooms in renter-occupied apartments in Jacksonville, Arkansas
- 76no bedroom
- 9621 bedroom
- 2,4842 bedrooms
- 2,1563 bedrooms
- 5244 bedrooms
- 415+ bedrooms
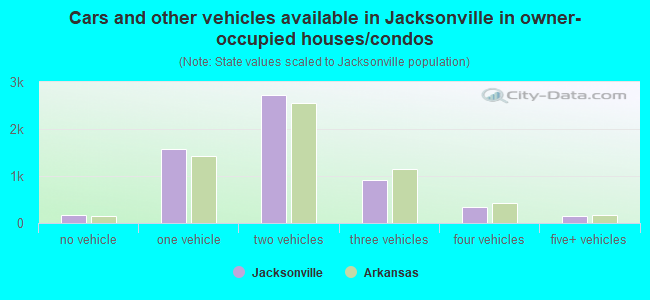
- Cars and other vehicles available in Jacksonville in owner-occupied houses/condos
- 180no vehicle
- 1,5811 vehicle
- 2,7302 vehicles
- 9083 vehicles
- 3424 vehicles
- 1545+ vehicles
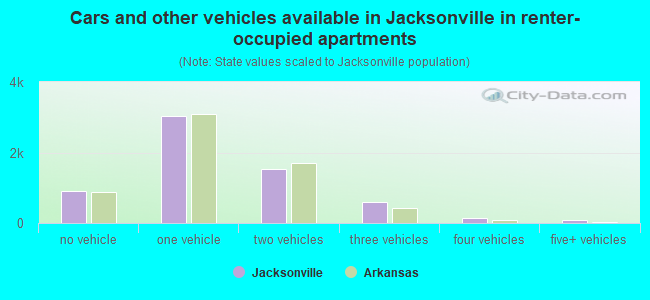
- Cars and other vehicles available in Jacksonville in renter-occupied apartments
- 907no vehicle
- 3,0251 vehicle
- 1,5192 vehicles
- 5853 vehicles
- 1294 vehicles
- 775+ vehicles
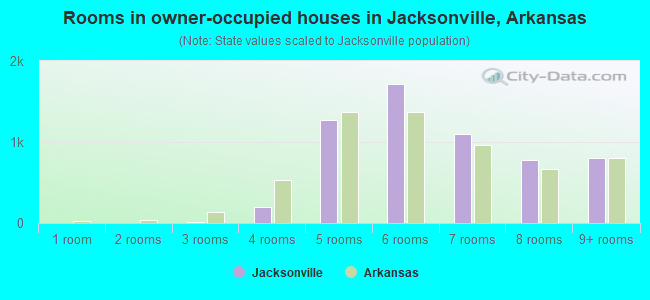
- Rooms in owner-occupied houses in Jacksonville, Arkansas
- 01 room
- 02 rooms
- 143 rooms
- 2014 rooms
- 1,2755 rooms
- 1,7206 rooms
- 1,0967 rooms
- 7838 rooms
- 8089+ rooms
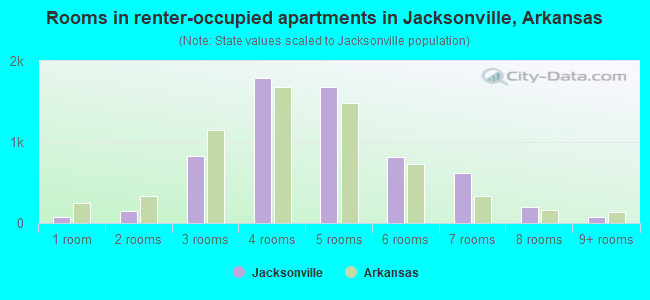
- Rooms in renter-occupied apartments in Jacksonville, Arkansas
- 761 room
- 1522 rooms
- 8213 rooms
- 1,7944 rooms
- 1,6845 rooms
- 8196 rooms
- 6237 rooms
- 1948 rooms
- 779+ rooms
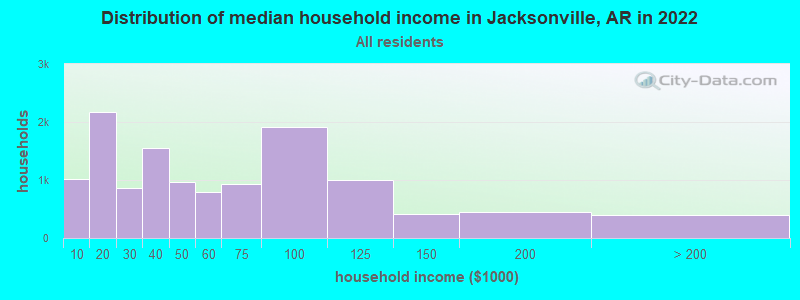
Jacksonville, AR household income distribution

- 1,018Less than $10,000
- 2,172$10,000 to $19,999
- 866$20,000 to $29,999
- 1,550$30,000 to $39,999
- 970$40,000 to $49,999
- 798$50,000 to $59,999
- 931$60,000 to $74,999
- 1,907$75,000 to $99,999
- 1,007$100,000 to $124,999
- 408$125,000 to $149,999
- 440$150,000 to $199,999
- 396$200,000 or more
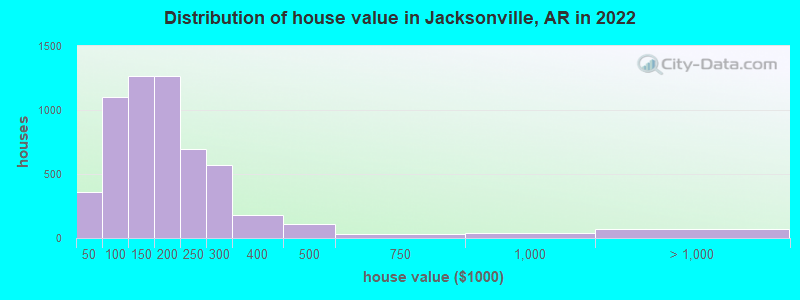
Home value of owner - occupied houses in 2022 in Jacksonville, AR
-
- 87Less than $10,000
- 9$10,000 to $14,999
- 71$15,000 to $19,999
- 14$20,000 to $24,999
- 18$30,000 to $34,999
- 10$35,000 to $39,999
- 148$40,000 to $49,999
- 17$50,000 to $59,999
- 77$60,000 to $69,999
- 358$70,000 to $79,999
- 198$80,000 to $89,999
- 299$90,000 to $99,999
- 780$100,000 to $124,999
- 483$125,000 to $149,999
- 842$150,000 to $174,999
- 422$175,000 to $199,999
- 692$200,000 to $249,999
- 573$250,000 to $299,999
- 179$300,000 to $399,999
- 112$400,000 to $499,999
- 27$500,000 to $749,999
- 35$750,000 to $999,999
- 41$1,000,000 to $1,499,999
- 28$1,500,000 to $1,999,999
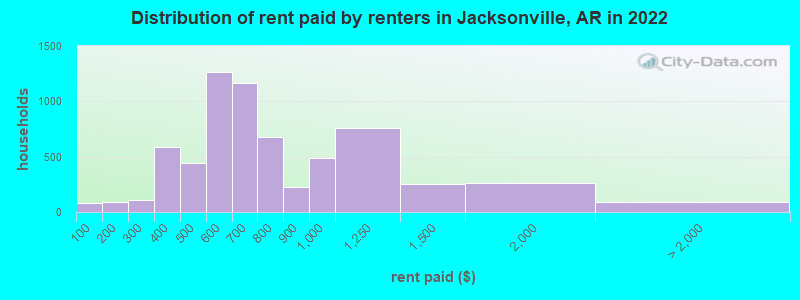
Rent paid by renters in 2022 in Jacksonville, AR
-
- 77Less than $100
- 20$100 to $149
- 66$150 to $199
- 27$200 to $249
- 78$250 to $299
- 102$300 to $349
- 483$350 to $399
- 123$400 to $449
- 314$450 to $499
- 673$500 to $549
- 594$550 to $599
- 679$600 to $649
- 485$650 to $699
- 403$700 to $749
- 277$750 to $799
- 228$800 to $899
- 488$900 to $999
- 760$1,000 to $1,249
- 255$1,250 to $1,499
- 266$1,500 to $1,999
- 89No cash rent
Percentage of workers working in this county: 93.2%
Number of people working at home: 1,278 (9.8% of all workers)
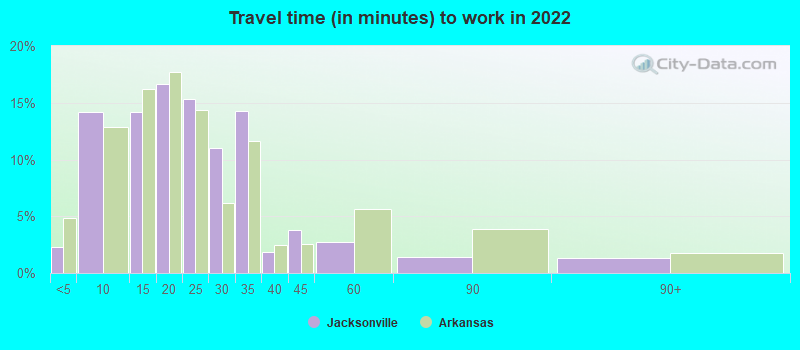
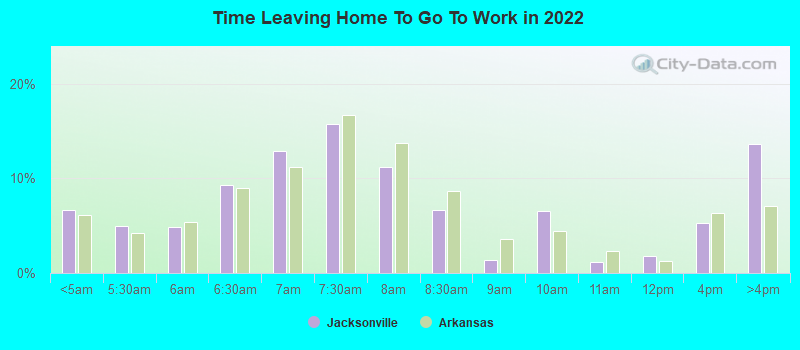
Travel time to work (commute)
- Less than 5 minutes: 299
- 5 to 9 minutes: 1,724
- 10 to 14 minutes: 1,297
- 15 to 19 minutes: 1,961
- 20 to 24 minutes: 1,985
- 25 to 29 minutes: 700
- 30 to 34 minutes: 2,757
- 35 to 39 minutes: 279
- 40 to 44 minutes: 176
- 45 to 59 minutes: 94
- 60 to 89 minutes: 164
- 90 or more minutes: 74
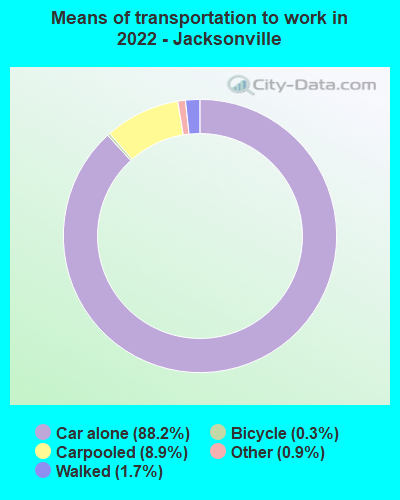
Means of transportation to work:
- Drove a car alone: 11,102 (81.9%)
- Carpooled: 792 (5.8%)
- Bus: 10 (0.1%)
- Taxi: 123 (0.9%)
- Bicycle: 19 (0.1%)
- Walked: 290 (2.1%)
- Worked at home: 1,278 (9.4%)
- Unemployment by race in 2022
- Unemployment rate for White non-Hispanic residents
- 2.5%Males
- 6.3%Females
- Unemployment rate for Black residents
- 10.9%Males
- 10.9%Females
- Unemployment rate for other race residents
- 34.4%Females
- Unemployment rate for two or more race residents
- 9.3%Females
- Unemployment rate for Hispanic or Latino residents
- 24.9%Females
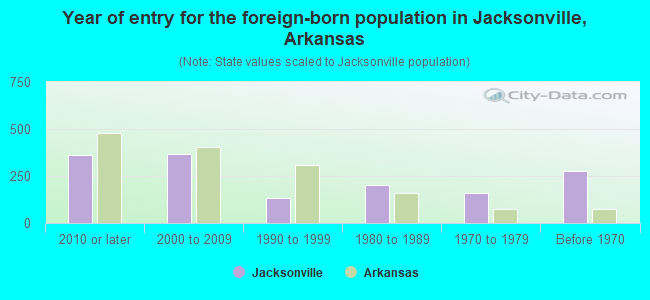
- Year of entry for the foreign-born population in Jacksonville, Arkansas
- 3602010 or later
- 3682000 to 2009
- 1311990 to 1999
- 2041980 to 1989
- 1601970 to 1979
- 274Before 1970
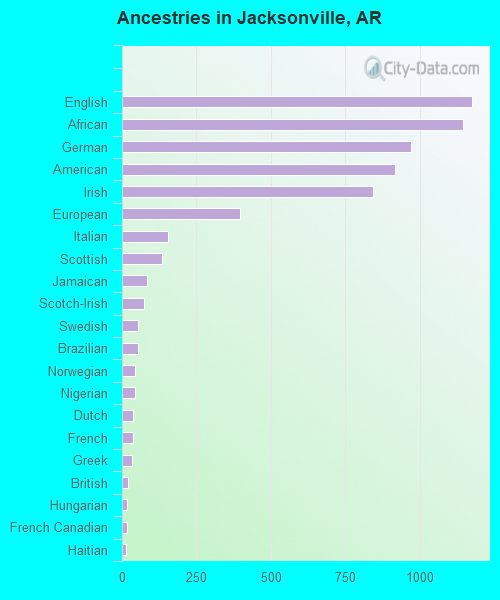
First ancestries reported:
- English: 1,174 (6.3%)
- African: 1,144 (6.2%)
- German: 970 (5.2%)
- American: 917 (4.9%)
- Irish: 844 (4.5%)
- European: 396 (2.1%)
- Italian: 156 (0.8%)
- Scottish: 136 (0.7%)
- Jamaican: 85 (0.5%)
- Scotch-Irish: 75 (0.4%)
- Swedish: 54 (0.3%)
- Brazilian: 53 (0.3%)
- Norwegian: 42 (0.2%)
- Nigerian: 42 (0.2%)
- Dutch: 36 (0.2%)
- French: 36 (0.2%)
- Greek: 34 (0.2%)
- British: 20 (0.1%)
- Hungarian: 18 (0.10%)
- French Canadian: 17 (0.09%)
- Haitian: 12 (0.06%)
- Slovak: 10 (0.05%)
- Lithuanian: 9 (0.05%)
- Trinidadian and Tobagonian: 8 (0.04%)
- Ukrainian: 7 (0.04%)
- Northern European: 5 (0.03%)
Most common places of birth for foreign-born residents (%):
| Jacksonville: | 25.3% (318) |
| Arkansas: | 2.7% (4,128) |
| Jacksonville: | 23.2% (292) |
| Arkansas: | 0.2% (319) |
| Jacksonville: | 12.3% (155) |
| Arkansas: | 40.2% (61,075) |
| Jacksonville: | 5.8% (73) |
| Arkansas: | 0.9% (1,434) |
| Jacksonville: | 5.6% (70) |
| Arkansas: | 1.8% (2,721) |
| Jacksonville: | 4.1% (52) |
| Arkansas: | 2.3% (3,503) |
| Jacksonville: | 3.3% (41) |
| Arkansas: | 0.7% (1,136) |
| Jacksonville: | 3.1% (39) |
| Arkansas: | 1.1% (1,606) |
| Jacksonville: | 1.9% (24) |
| Arkansas: | 1.2% (1,813) |
| Jacksonville: | 1.7% (21) |
| Arkansas: | 0.2% (240) |
| Jacksonville: | 1.6% (20) |
| Arkansas: | 0.3% (439) |
| Jacksonville: | 1.5% (19) |
| Arkansas: | 3.5% (5,376) |
Place of birth for U.S.-born residents:
- This state: 17,301
- Other state: 10,984
- Northeast: 731
- Midwest: 2,274
- South: 5,085
- West: 3,005
82.4% of Jacksonville residents lived in the same house 1 years ago.
Out of people who lived in different houses, 29.4% lived in this county.
Out of people who lived in different counties, 59.8% lived in Arkansas.
| Jacksonville: | 82.4% |
| State average: | 87.0% |
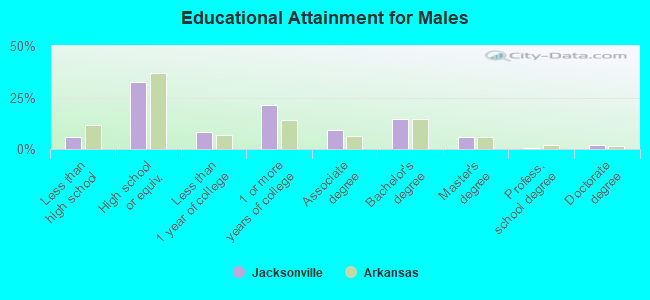
Education attainment for males 25 years and older:
- No schooling: 36
- Nursery to 4th grade: 38
- 5th and 6th grade: 22
- 7th and 8th grade: 38
- 9th grade: 106
- 10th grade: 53
- 11th grade: 43
- 12th grade, no diploma: 158
- High school graduate (or equivalency): 2,719
- Less than 1 year of college: 675
- Some college more than 1 year, no degree: 1,792
- Associate degree: 782
- Bachelor's degree: 1,228
- Master's degree: 492
- Professional school degree: 28
- Doctorate degree: 173
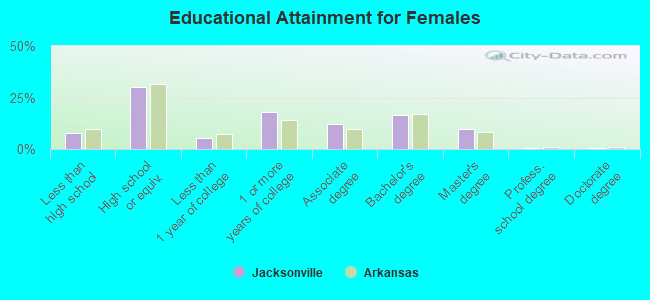
Education attainment for females 25 years and older:
- No schooling: 93
- Nursery to 4th grade: 41
- 5th and 6th grade: 28
- 7th and 8th grade: 69
- 9th grade: 45
- 10th grade: 88
- 11th grade: 121
- 12th grade, no diploma: 293
- High school graduate (or equivalency): 3,079
- Less than 1 year of college: 549
- Some college more than 1 year, no degree: 1,817
- Associate degree: 1,260
- Bachelor's degree: 1,664
- Master's degree: 969
- Professional school degree: 72
- Doctorate degree: 38
Housing units in structures:
- One, detached: 8,675
- One, attached: 666
- Two: 971
- 3 or 4: 490
- 5 to 9: 910
- 10 to 19: 439
- 20 to 49: 336
- 50 or more: 242
- Mobile homes: 846
Housing units lacking complete kitchen facilities in 2022: 5.0%
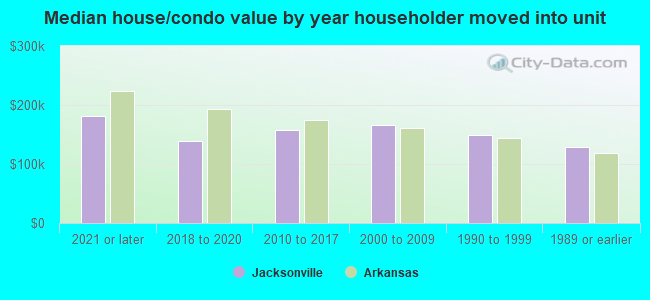
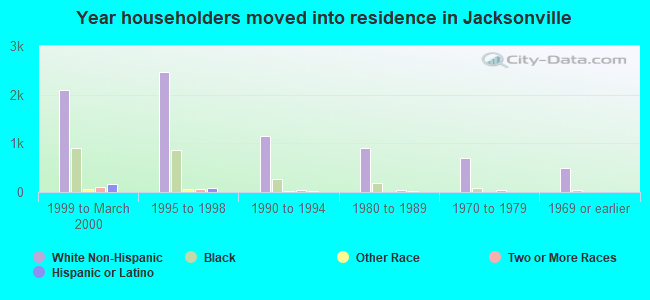
House/condo owner moved in on average 12 years ago
Renter moved in on average 3 years ago
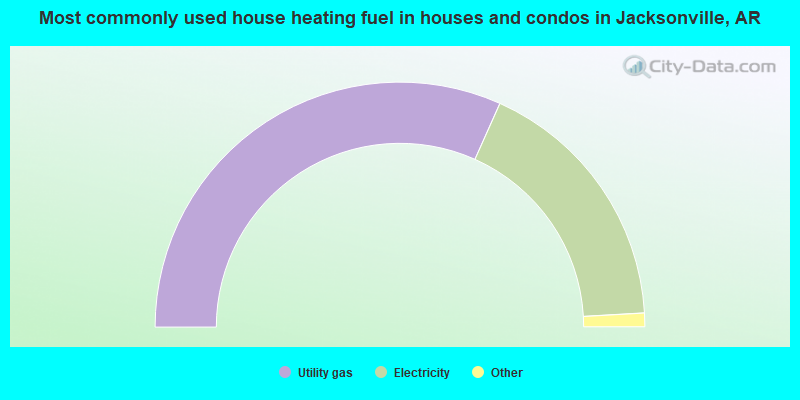
- 63.4%Utility gas
- 34.8%Electricity
- 1.4%Bottled, tank, or LP gas
- 0.2%No fuel used
- 0.2%Wood
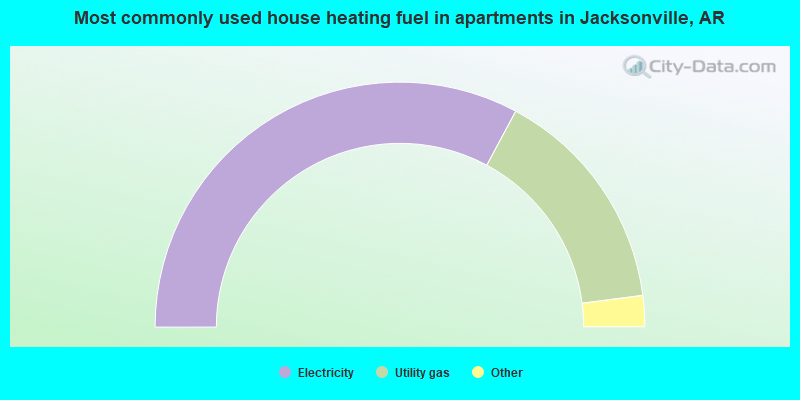
- 65.7%Electricity
- 30.2%Utility gas
- 3.3%No fuel used
- 0.6%Bottled, tank, or LP gas
- 0.3%Other fuel
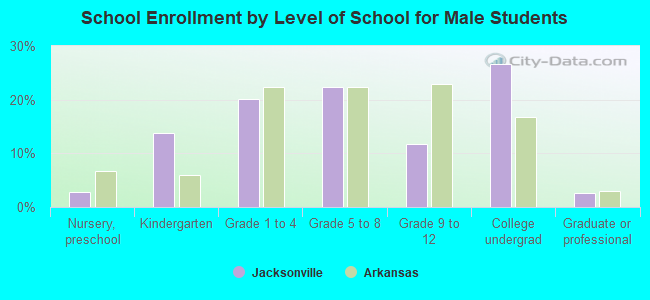
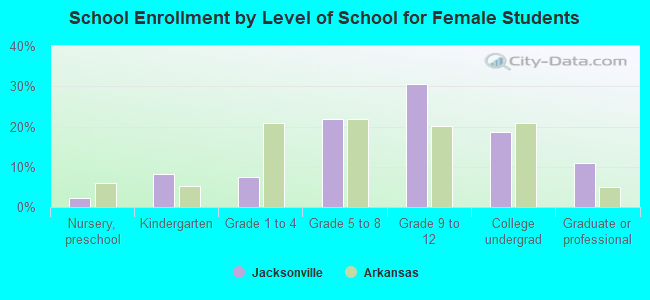
Private vs. public school enrollment:
| Here: | 6.1% |
| Arkansas: | 10.5% |
| Here: | 8.4% |
| Arkansas: | 8.7% |
| Here: | 2.2% |
| Arkansas: | 19.4% |