Jamestown, ND (North Dakota) Houses and Residents
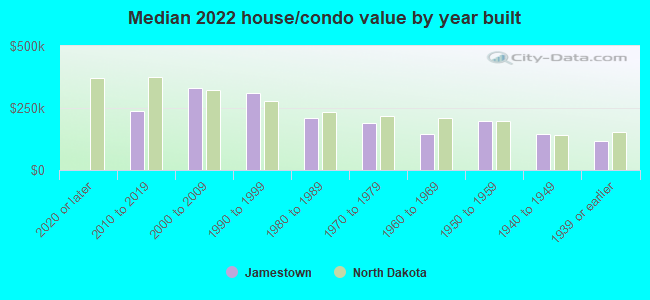
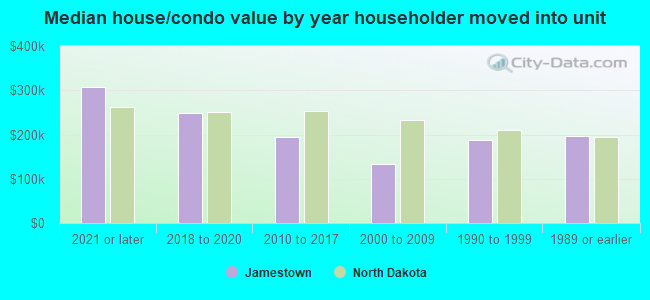
Estimated median house or condo value in 2022: $193,748 (it was $65,500 in 2000 )
Jamestown:
$193,748North Dakota:
$243,100
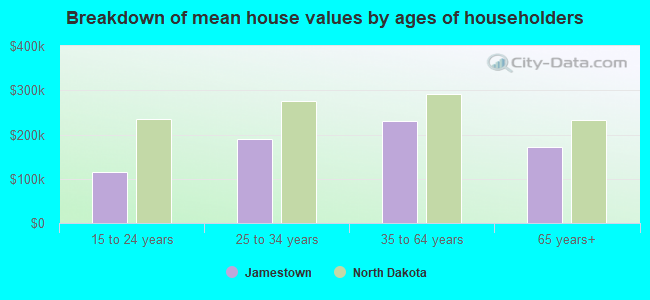
Lower value quartile - upper value quartile: $111,668 - $261,259Mean price in 2022: Detached houses: $241,984 Here:
$241,984State:
$284,144
Townhouses or other attached units: $174,975 Here:
$174,975State:
$250,572
In 3-to-4-unit structures: $151,803 Here:
$151,803State:
$229,360
In 5-or-more-unit structures: $423,715 Here:
$423,715State:
$231,934
Mobile homes: $31,878 Here:
$31,878State:
$85,388
Total population: 15,446 (Urban population: 15,231 (all inside urban clusters), Rural population: 240 (all nonfarm) )
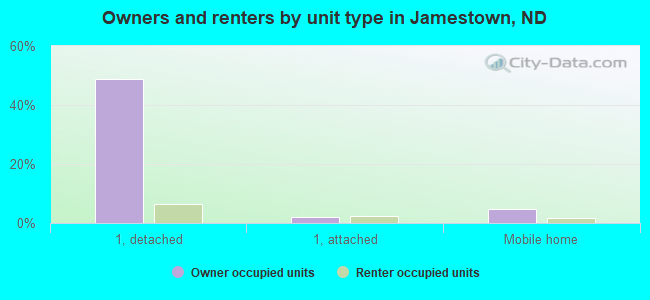
Houses: 7,666 (6,868 occupied: 3,916 owner occupied, 3,096 renter occupied )
% of renters here:
44%State:
35%
Housing density: 616 houses/condos per square mile
Median price asked for vacant for-sale houses and condos in 2022: $292,915.
Median contract rent in 2022: $668 (lower quartile is $515, upper quartile is $771)
Median rent asked for vacant for-rent units in 2022: $873
Median gross rent in Jamestown, ND in 2022: $699
Housing units in Jamestown with a mortgage: 2,203 (243 second mortgage, 0 home equity loan, 187 both second mortgage and home equity loan )Houses without a mortgage: 70
Median household income for houses/condos with a mortgage: $96,407
Median household income for apartments without a mortgage: $55,728
Median monthly housing costs: $727
Data:
Median house or condo value ($)
Median house or condo value ($ change since 2000)
Median house or condo value ($) - White
Median house or condo value ($) - Black or African American
Median house or condo value ($) - Asian
Median house or condo value ($) - Hispanic or Latino
Median house or condo value ($) - American Indian and Alaska Native
Median house or condo value ($) - Multirace
Median house or condo value ($) - Other Race
Median price asked for mobile homes ($)
Household density (households per square mile)
Mean house or condo value by units in structure - 1, detached ($)
Mean house or condo value by units in structure - 1, attached ($)
Mean house or condo value by units in structure - 2 ($)
Mean house or condo value by units in structure by units in structure - 3 or 4 ($)
Mean house or condo value by units in structure - 5 or more ($)
Mean house or condo value by units in structure - Boat, RV, van, etc. ($)
Mean house or condo value by units in structure - Mobile home ($)
Median contract rent ($)
Median contract rent - Lower quartile ($)
Median contract rent - Upper quartile ($)
Median gross rent ($)
Urban houses (%)
Rural houses (%)
Houses occupied (%)
Houses occupied (% change since 2000)
Houses owner occupied (%)
Houses owner occupied (% change since 2000)
Houses renter occupied (%)
Houses renter occupied (% change since 2000)
Vacant housing units - For rent (%)
Vacant housing units - For rent (% change since 2000)
Vacant housing units - For sale only (%)
Vacant housing units - For sale only (% change since 2000)
Vacant housing units - Rented or sold, not occupied (%)
Vacant housing units - Rented or sold, not occupied (% change since 2000)
Vacant housing units - For seasonal, recreational, or occasional use (%)
Vacant housing units - For seasonal, recreational, or occasional use (% change since 2000)
Vacant housing units - For migrant workers (%)
Vacant housing units - For migrant workers (% change since 2000)
Vacant housing units - Other vacant (%)
Vacant housing units - Other vacant (% change since 2000)
Median monthly housing costs ($)
Median household income for houses/condos with a mortgage ($)
Median household income for houses/condos without a mortgage ($)
Median household income ($)
Median household income ($) - White
Median household income ($) - Black or African American
Median household income ($) - Asian
Median household income ($) - Hispanic or Latino
Median household income ($) - American Indian and Alaska Native
Median household income ($) - Multirace
Median household income ($) - Other Race
Mortgage status - with mortgage (%)
Mortgage status - with second mortgage (%)
Mortgage status - with home equity loan (%)
Mortgage status - with both second mortgage and home equity loan (%)
Mortgage status - without a mortgage (%)
Median year house/condo built
Median year apartment built
Household type by relationship - Male householder living alone (%)
Household type by relationship - Male householder not living alone (%)
Household type by relationship - Female householder living alone (%)
Household type by relationship - Female householder not living alone (%)
Household type by relationship - Opposite-Sex spouse (%)
Household type by relationship - Same-Sex spouse (%)
Household type by relationship - Opposite-Sex unmarried partner (%)
Household type by relationship - Same-Sex unmarried partner (%)
Household type by relationship - In group quarters (%)
Size of family households - 2-person household (%)
Size of family households - 3-person household (%)
Size of family households - 4-person household (%)
Size of family households - 5-person household (%)
Size of family households - 6-person household (%)
Size of family households - 7-or-more-person household (%)
Size of nonfamily households - 1-person household (%)
Size of nonfamily households - 2-person household (%)
Size of nonfamily households - 3-person household (%)
Size of nonfamily households - 4-person household (%)
Size of nonfamily households - 5-person household (%)
Size of nonfamily households - 6-person household (%)
Size of nonfamily households - 7-or-moreperson household (%)
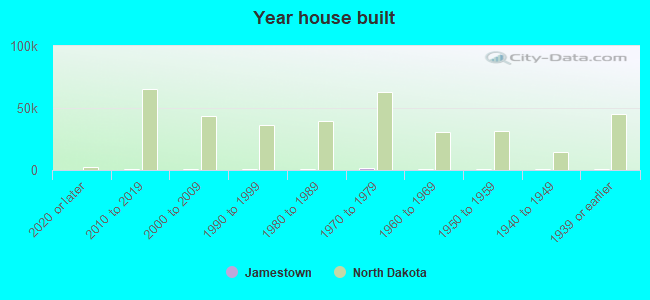
Year house built - Built 2010 or later (%)
Year house built - Built 2000 to 2009 (%)
Year house built - Built 1990 to 1999 (%)
Year house built - Built 1980 to 1989 (%)
Year house built - Built 1970 to 1979 (%)
Year house built - Built 1960 to 1969 (%)
Year house built - Built 1950 to 1959 (%)
Year house built - Built 1940 to 1949 (%)
Year house built - Built 1939 or earlier (%)
Median number of rooms in houses and condos
Median number of rooms in apartments
Median number of bedrooms in owner occupied houses
Mean number of bedrooms in owner occupied houses
Median number of bedrooms in renter occupied houses
Mean number of bedrooms in renter occupied houses
Median number of vehichles in owner occupied houses
Mean number of vehichles in owner occupied houses
Median number of vehichles in renter occupied houses
Mean number of vehichles in renter occupied houses
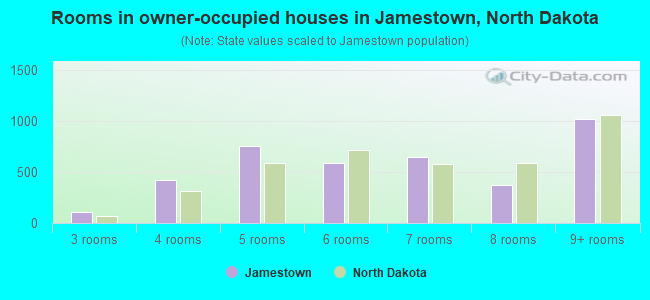
Rooms in owner-occupied houses - 1 room (%)
Rooms in owner-occupied houses - 2 rooms (%)
Rooms in owner-occupied houses - 3 rooms (%)
Rooms in owner-occupied houses - 4 rooms (%)
Rooms in owner-occupied houses - 5 rooms (%)
Rooms in owner-occupied houses - 6 rooms (%)
Rooms in owner-occupied houses - 7 rooms (%)
Rooms in owner-occupied houses - 8 rooms (%)
Rooms in owner-occupied houses - 9+ rooms (%)
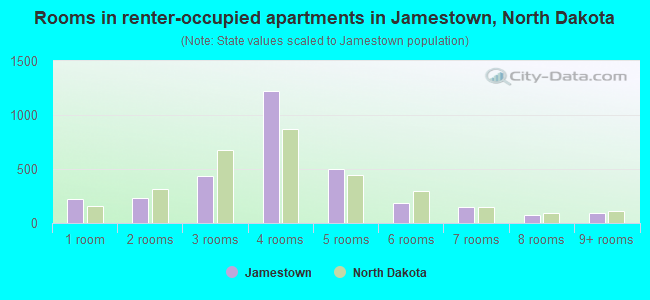
Rooms in renter-occupied houses - 1 room (%)
Rooms in renter-occupied houses - 2 rooms (%)
Rooms in renter-occupied houses - 3 rooms (%)
Rooms in renter-occupied houses - 4 rooms (%)
Rooms in renter-occupied houses - 5 rooms (%)
Rooms in renter-occupied houses - 6 rooms (%)
Rooms in renter-occupied houses - 7 rooms (%)
Rooms in renter-occupied houses - 8 rooms (%)
Rooms in renter-occupied houses - 9+ rooms (%)
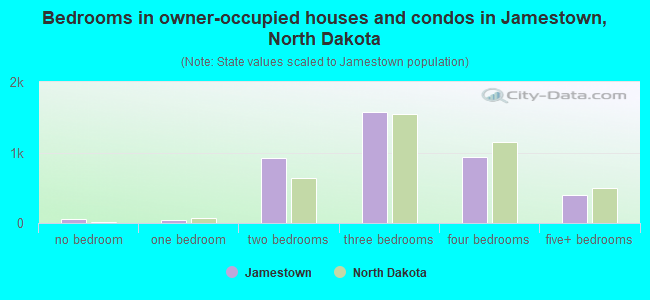
Bedrooms in owner-occupied houses - no bedrooms (%)
Bedrooms in owner-occupied houses - 1 bedroom (%)
Bedrooms in owner-occupied houses - 2 bedrooms (%)
Bedrooms in owner-occupied houses - 3 bedrooms (%)
Bedrooms in owner-occupied houses - 4 bedrooms (%)
Bedrooms in owner-occupied houses - 5+ bedrooms (%)
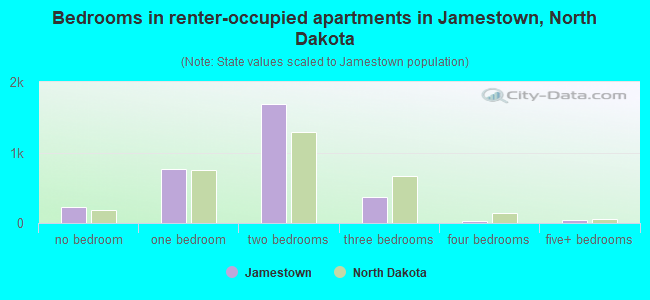
Bedrooms in renter-occupied houses - no bedrooms (%)
Bedrooms in renter-occupied houses - 1 bedroom (%)
Bedrooms in renter-occupied houses - 2 bedrooms (%)
Bedrooms in renter-occupied houses - 3 bedrooms (%)
Bedrooms in renter-occupied houses - 4 bedrooms (%)
Bedrooms in renter-occupied houses - 5+ bedrooms (%)
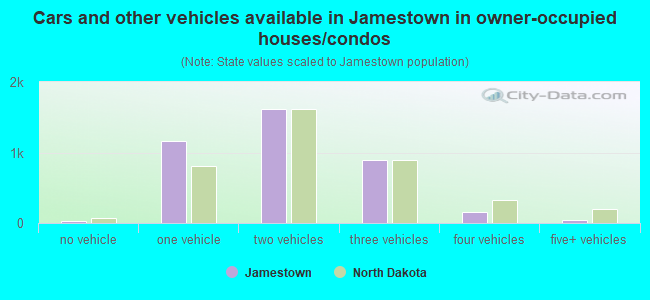
Vehicles available in owner-occupied houses - no vehicle available (%)
Vehicles available in owner-occupied houses - 1 vehicle available(%)
Vehicles available in owner-occupied houses - 2 Vehicles available (%)
Vehicles available in owner-occupied houses - 3 Vehicles available (%)
Vehicles available in owner-occupied houses - 4 Vehicles available (%)
Vehicles available in owner-occupied houses - 5+ Vehicles available (%)
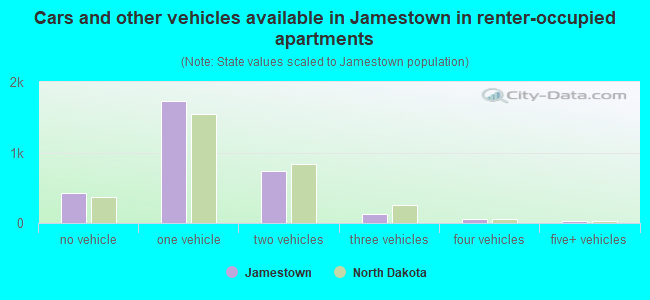
Vehicles available in renter-occupied houses - no vehicle available (%)
Vehicles available in renter-occupied houses - 1 vehicle available (%)
Vehicles available in renter-occupied houses - 2 Vehicles available (%)
Vehicles available in renter-occupied houses - 3 Vehicles available (%)
Vehicles available in renter-occupied houses - 4 Vehicles available (%)
Vehicles available in renter-occupied houses - 5+ Vehicles available (%)
Housing units in structures - 1, detached (%)
Housing units in structures - 1, attached (%)
Housing units in structures - 2 (%)
Housing units in structures - 3 or 4 (%)
Housing units in structures - 5 to 9 (%)
Housing units in structures - 10 to 19 (%)
Housing units in structures - 20 to 49 (%)
Housing units in structures - 50 or more (%)
Housing units in structures - Mobile home (%)
Housing units in structures - Boat, RV, van, etc. (%)
Housing units in structures - Owners - 1, detached (%)
Housing units in structures - Owners - 1, attached (%)
Housing units in structures - Owners - 2 (%)
Housing units in structures - Owners - 3 or 4 (%)
Housing units in structures - Owners - 5 to 9 (%)
Housing units in structures - Owners - 10 to 19 (%)
Housing units in structures - Owners - 20 to 49 (%)
Housing units in structures - Owners - 50 or more (%)
Housing units in structures - Owners - Mobile home (%)
Housing units in structures - Owners - Boat, RV, van, etc. (%)
Housing units in structures - Renters - 1, detached (%)
Housing units in structures - Renters - 1, attached (%)
Housing units in structures - Renters - 2 (%)
Housing units in structures - Renters - 3 or 4 (%)
Housing units in structures - Renters - 5 to 9 (%)
Housing units in structures - Renters - 10 to 19 (%)
Housing units in structures - Renters - 20 to 49 (%)
Housing units in structures - Renters - 50 or more (%)
Housing units in structures - Renters - Mobile home (%)
Housing units in structures - Renters - Boat, RV, van, etc. (%)
House/condo owner moved in on average (years ago)
Renter moved in on average (years ago)
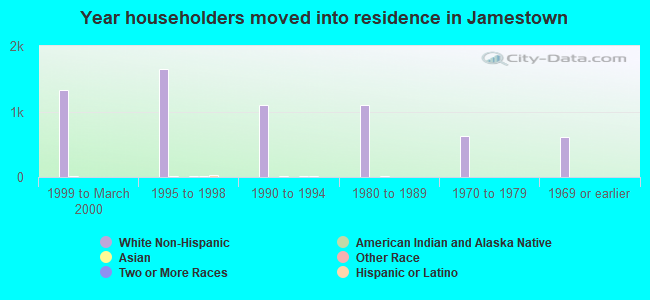
Year householder moved into unit - Moved in 1999 to March 2000 (%)
Year householder moved into unit - Moved in 1999 to March 2000 (%) - White
Year householder moved into unit - Moved in 1999 to March 2000 (%) - Black or African American
Year householder moved into unit - Moved in 1999 to March 2000 (%) - Asian
Year householder moved into unit - Moved in 1999 to March 2000 (%) - Hispanic or Latino
Year householder moved into unit - Moved in 1999 to March 2000 (%) - American Indian and Alaska Native
Year householder moved into unit - Moved in 1999 to March 2000 (%) - Multirace
Year householder moved into unit - Moved in 1999 to March 2000 (%) - Other Race
Year householder moved into unit - Moved in 1995 to 1998 (%)
Year householder moved into unit - Moved in 1995 to 1998 (%) - White
Year householder moved into unit - Moved in 1995 to 1998 (%) - Black or African American
Year householder moved into unit - Moved in 1995 to 1998 (%) - Asian
Year householder moved into unit - Moved in 1995 to 1998 (%) - Hispanic or Latino
Year householder moved into unit - Moved in 1995 to 1998 (%) - American Indian and Alaska Native
Year householder moved into unit - Moved in 1995 to 1998 (%) - Multirace
Year householder moved into unit - Moved in 1995 to 1998 (%) - Other Race
Year householder moved into unit - Moved in 1990 to 1994 (%)
Year householder moved into unit - Moved in 1990 to 1994 (%) - White
Year householder moved into unit - Moved in 1990 to 1994 (%) - Black or African American
Year householder moved into unit - Moved in 1990 to 1994 (%) - Asian
Year householder moved into unit - Moved in 1990 to 1994 (%) - Hispanic or Latino
Year householder moved into unit - Moved in 1990 to 1994 (%) - American Indian and Alaska Native
Year householder moved into unit - Moved in 1990 to 1994 (%) - Multirace
Year householder moved into unit - Moved in 1990 to 1994 (%) - Other Race
Year householder moved into unit - Moved in 1980 to 1989 (%)
Year householder moved into unit - Moved in 1980 to 1989 (%) - White
Year householder moved into unit - Moved in 1980 to 1989 (%) - Black or African American
Year householder moved into unit - Moved in 1980 to 1989 (%) - Asian
Year householder moved into unit - Moved in 1980 to 1989 (%) - Hispanic or Latino
Year householder moved into unit - Moved in 1980 to 1989 (%) - American Indian and Alaska Native
Year householder moved into unit - Moved in 1980 to 1989 (%) - Multirace
Year householder moved into unit - Moved in 1980 to 1989 (%) - Other Race
Year householder moved into unit - Moved in 1970 to 1979 (%)
Year householder moved into unit - Moved in 1970 to 1979 (%) - White
Year householder moved into unit - Moved in 1970 to 1979 (%) - Black or African American
Year householder moved into unit - Moved in 1970 to 1979 (%) - Asian
Year householder moved into unit - Moved in 1970 to 1979 (%) - Hispanic or Latino
Year householder moved into unit - Moved in 1970 to 1979 (%) - American Indian and Alaska Native
Year householder moved into unit - Moved in 1970 to 1979 (%) - Multirace
Year householder moved into unit - Moved in 1970 to 1979 (%) - Other Race
Year householder moved into unit - Moved in 1969 or earlier (%)
Year householder moved into unit - Moved in 1969 or earlier (%) - White
Year householder moved into unit - Moved in 1969 or earlier (%) - Black or African American
Year householder moved into unit - Moved in 1969 or earlier (%) - Asian
Year householder moved into unit - Moved in 1969 or earlier (%) - Hispanic or Latino
Year householder moved into unit - Moved in 1969 or earlier (%) - American Indian and Alaska Native
Year householder moved into unit - Moved in 1969 or earlier (%) - Multirace
Year householder moved into unit - Moved in 1969 or earlier (%) - Other Race
Housing units lacking complete plumbing facilities (%)
Housing units lacking complete kitchen facilities (%)
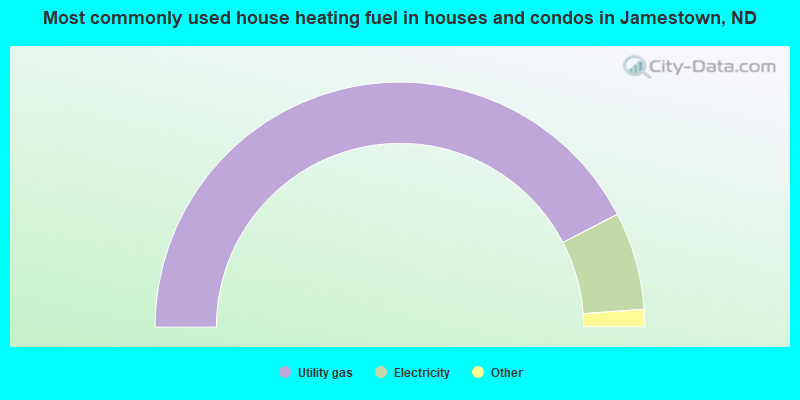
House heating fuel used in houses and condos - Utility gas (%)
House heating fuel used in houses and condos - Bottled, tank, or LP gas (%)
House heating fuel used in houses and condos - Electricity (%)
House heating fuel used in houses and condos - Fuel oil, kerosene, etc. (%)
House heating fuel used in houses and condos - Coal or coke (%)
House heating fuel used in houses and condos - Wood (%)
House heating fuel used in houses and condos - Solar energy (%)
House heating fuel used in houses and condos - Other fuel (%)
House heating fuel used in houses and condos - No fuel used (%)
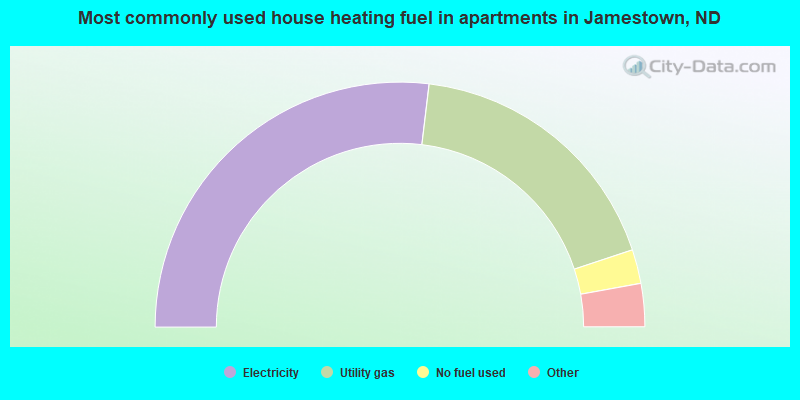
House heating fuel used in apartments - Utility gas (%)
House heating fuel used in apartments - Bottled, tank, or LP gas (%)
House heating fuel used in apartments - Electricity (%)
House heating fuel used in apartments - Fuel oil, kerosene, etc. (%)
House heating fuel used in apartments - Coal or coke (%)
House heating fuel used in apartments - Wood (%)
House heating fuel used in apartments - Solar energy (%)
House heating fuel used in apartments - Other fuel (%)
House heating fuel used in apartments - No fuel used (%)
Latest news about housing in Jamestown, ND collected exclusively by city-data.com from local newspapers, TV, and radio stations
Median year house/condo built: 1971Median year apartment built: 1977Household type by relationship:
Households: 15,898
Male householders: 3,223 (1,302 living alone ), Female householders: 3,567 (1,762 living alone )2,783 spouses (2,753 opposite-sex spouses ), 342 unmarried partners , (342 opposite-sex unmarried partners ), 3,249 children (2,965 natural , 50 adopted , 234 stepchildren ), 40 grandchildren , 127 brothers or sisters , 22 parents , 42 foster children , 337 other relatives , 286 non-relatives In group quarters: 1,875
Size of family households: 2,201 2-persons , 509 3-persons , 518 4-persons , 154 5-persons , 12 6-persons , 67 7-or-more-persons .
Size of nonfamily households: 3,175 1-person , 337 2-persons , 14 3-persons .
1,682 married couples with children. single-parent households (208 men , 525 women ).
95.6% of residents of Jamestown speak English at home. of residents speak Spanish at home (49% speak English very well , 35% speak English well , 15% don't speak English at all ).of residents speak other Indo-European language at home (79% speak English very well , 13% speak English well , 8% speak English not well ).of residents speak Asian or Pacific Island language at home (43% speak English very well , 57% speak English well ).of residents speak other language at home (38% speak English very well , 62% speak English well ).
Foreign born population: 516 (3.2%)of them are naturalized citizens )
Median number of rooms in houses and condos:
Median number of rooms in apartments
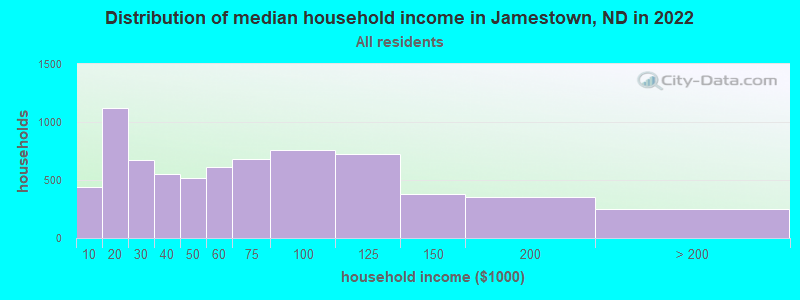
Jamestown, ND household income distribution 438 Less than $10,0001,122 $10,000 to $19,999671 $20,000 to $29,999554 $30,000 to $39,999515 $40,000 to $49,999608 $50,000 to $59,999679 $60,000 to $74,999762 $75,000 to $99,999727 $100,000 to $124,999379 $125,000 to $149,999352 $150,000 to $199,999248 $200,000 or more
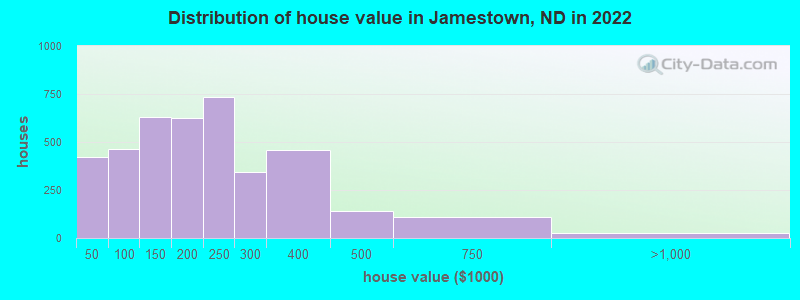
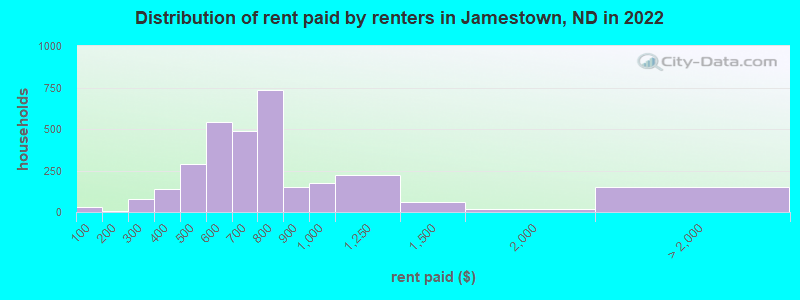
Home value of owner - occupied houses in 2022 in Jamestown, ND 201 Less than $10,00049 $10,000 to $14,9996 $15,000 to $19,99942 $20,000 to $24,99975 $25,000 to $29,99916 $35,000 to $39,99932 $40,000 to $49,99988 $50,000 to $59,99991 $60,000 to $69,999122 $70,000 to $79,99938 $80,000 to $89,99988 $90,000 to $99,999359 $100,000 to $124,999273 $125,000 to $149,999333 $150,000 to $174,999291 $175,000 to $199,999732 $200,000 to $249,999345 $250,000 to $299,999455 $300,000 to $399,999139 $400,000 to $499,999111 $500,000 to $749,99915 $750,000 to $999,99912 $2,000,000 or moreRent paid by renters in 2022 in Jamestown, ND 33 Less than $1004 $150 to $19968 $200 to $2498 $250 to $29912 $300 to $349123 $350 to $39953 $400 to $449237 $450 to $499328 $500 to $549216 $550 to $599200 $600 to $649288 $650 to $699553 $700 to $749180 $750 to $799150 $800 to $899175 $900 to $999220 $1,000 to $1,24958 $1,250 to $1,49916 $1,500 to $1,999125 $3,500 or more27 No cash rent
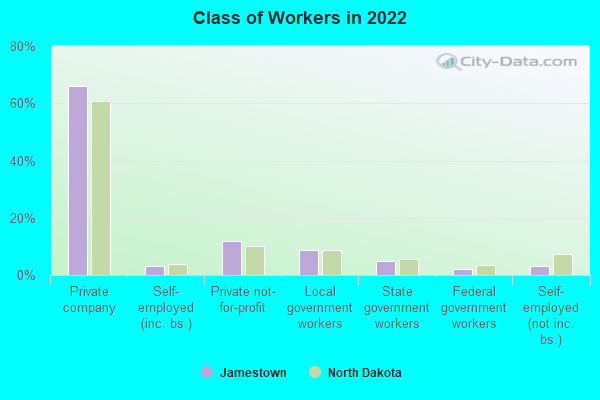
Percentage of workers working in this county: 94.6%Number of people working at home: 315 (4.0% of all workers )
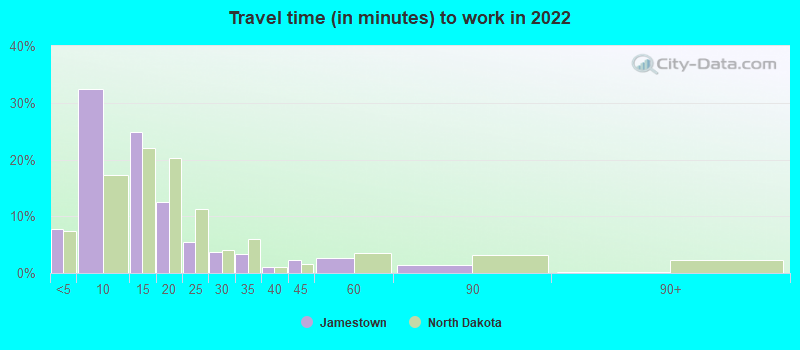
Travel time to work (commute)
Less than 5 minutes: 6035 to 9 minutes: 2,64910 to 14 minutes: 2,14715 to 19 minutes: 94420 to 24 minutes: 9225 to 29 minutes: 15830 to 34 minutes: 14035 to 39 minutes: 040 to 44 minutes: 2945 to 59 minutes: 14560 to 89 minutes: 5890 or more minutes: 224
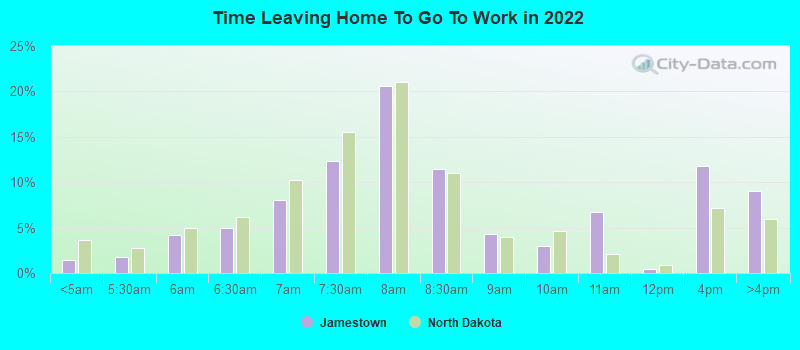
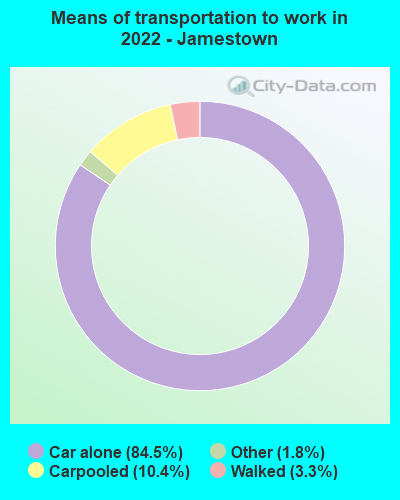
Means of transportation to work:
Drove a car alone: 6,858 (80.5%)Carpooled: 889 (10.4%)Taxi: 119 (1.4%)Walked: 289 (3.4%)Worked at home: 315 (3.7%)
Unemployment by race in 2022
Unemployment rate for White non-Hispanic residents 7.7% Males0.8% FemalesUnemployment rate for two or more race residents 3.9% FemalesUnemployment rate for Hispanic or Latino residents 10.7% Females
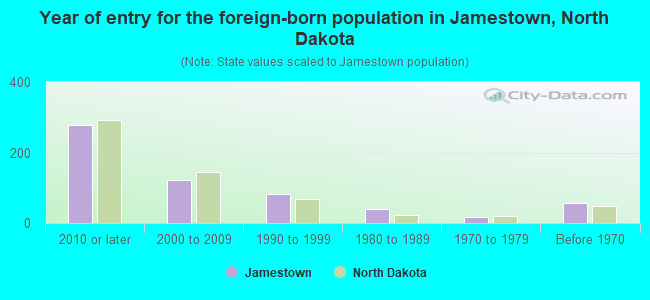
Year of entry for the foreign-born population in Jamestown, North Dakota
277 2010 or later 122 2000 to 2009 81 1990 to 1999 41 1980 to 1989 16 1970 to 1979 56 Before 1970
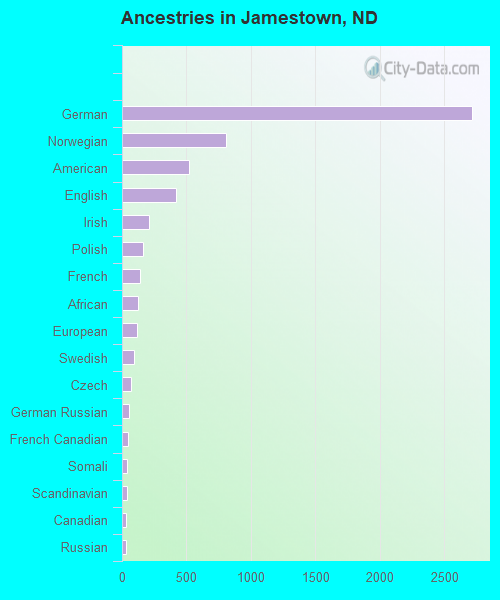
First ancestries reported:
German: 2,713 (41.2%)
Norwegian: 804 (12.2%)
American: 521 (7.9%)
English: 423 (6.4%)
Irish: 208 (3.2%)
Polish: 162 (2.5%)
French: 143 (2.2%)
African: 125 (1.9%)
European: 116 (1.8%)
Swedish: 97 (1.5%)
Czech: 73 (1.1%)
German Russian: 58 (0.9%)
French Canadian: 49 (0.7%)
Somali: 40 (0.6%)
Scandinavian: 37 (0.6%)
Canadian: 34 (0.5%)
Russian: 29 (0.4%)
Italian: 12 (0.2%)
Northern European: 12 (0.2%)
Scottish: 10 (0.2%)
Welsh: 10 (0.2%)
Danish: 8 (0.1%)
South African: 8 (0.1%)
Nigerian: 7 (0.1%)
Ethiopian: 3 (0.05%)
Dutch: 2 (0.03%)
New Zealander: 2 (0.03%) Most common places of birth for foreign-born residents (%): Liberia Jamestown:
24.1% (119)North Dakota:
8.6% (3,094)
Canada Jamestown:
15.8% (78)North Dakota:
8.7% (3,118)
Philippines Jamestown:
9.1% (45)North Dakota:
6.9% (2,472)
Somalia Jamestown:
8.5% (42)North Dakota:
4.2% (1,514)
Japan Jamestown:
8.1% (40)North Dakota:
1.3% (464)
Mexico Jamestown:
5.3% (26)North Dakota:
8.0% (2,889)
Other Australian and New Zealand Subregion Jamestown:
3.2% (16)North Dakota:
0.3% (110)
Spain Jamestown:
3.0% (15)North Dakota:
0.4% (145)
Pakistan Jamestown:
3.0% (15)North Dakota:
1.0% (353)
Korea Jamestown:
2.4% (12)North Dakota:
2.0% (720)
Colombia Jamestown:
2.4% (12)North Dakota:
0.6% (234)
Uzbekistan Jamestown:
1.6% (8)North Dakota:
0.0% (9)
Place of birth for U.S.-born residents:
This state: 10,538Other state: 4,566Northeast: 118Midwest: 2,367South: 528West: 1,542 77.2% of Jamestown residents lived in the same house 1 years ago.
Out of people who lived in different houses, 31.7% lived in this county.
Out of people who lived in different counties, 41.0% lived in North Dakota.
Jamestown:
77.2%State average:
84.2%
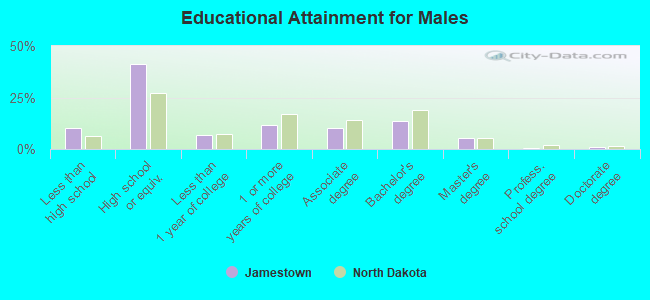
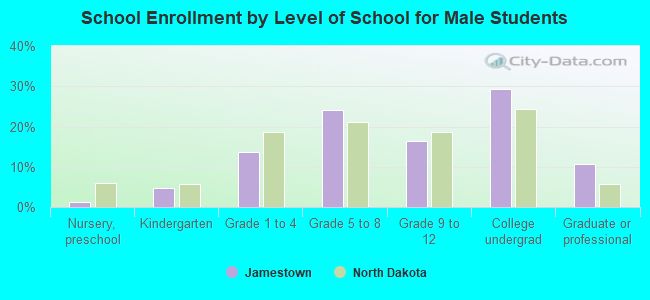
Education attainment for males 25 years and older:
No schooling: 47Nursery to 4th grade: 155th and 6th grade: 557th and 8th grade: 809th grade: 9710th grade: 8711th grade: 7212th grade, no diploma: 102High school graduate (or equivalency): 2,252Less than 1 year of college: 370Some college more than 1 year, no degree: 633Associate degree: 559Bachelor's degree: 735Master's degree: 288Professional school degree: 20Doctorate degree: 48
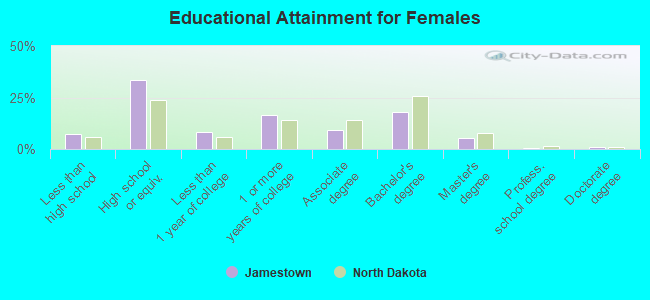
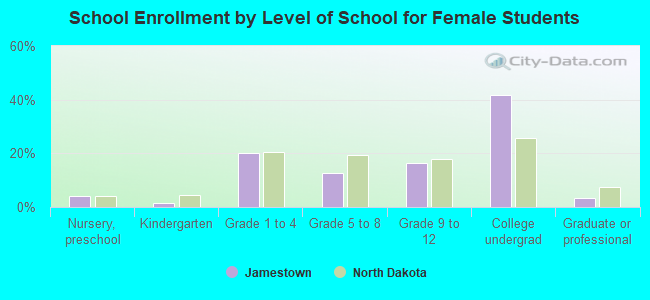
Education attainment for females 25 years and older:
No schooling: 30Nursery to 4th grade: 05th and 6th grade: 457th and 8th grade: 1479th grade: 1010th grade: 1711th grade: 13112th grade, no diploma: 32High school graduate (or equivalency): 1,873Less than 1 year of college: 471Some college more than 1 year, no degree: 935Associate degree: 524Bachelor's degree: 1,021Master's degree: 299Professional school degree: 35Doctorate degree: 43
Housing units in structures:
One, detached: 3,884One, attached: 320Two: 4263 or 4: 3875 to 9: 57610 to 19: 65120 to 49: 57550 or more: 319Mobile homes: 525Median worth of mobile homes: $28,076
Housing units lacking complete plumbing facilities in 2022: 2.6%Housing units lacking complete kitchen facilities in 2022: 3.4%House/condo owner moved in on average 13 years ago
Renter moved in on average 6 years ago
Private vs. public school enrollment:
Students in private schools in grades 1 to 8 (elementary and middle school): 134 Here:
10.4%North Dakota:
8.4%
Students in private schools in grades 9 to 12 (high school): 91 Here:
15.4%North Dakota:
8.2%
Students in private undergraduate colleges: 1,092 Here:
74.5%North Dakota:
14.3%