Jefferson Valley-Yorktown, NY (New York) Houses and Residents
| Jefferson Valley-Yorktown: | $545,169 |
| New York: | $400,400 |
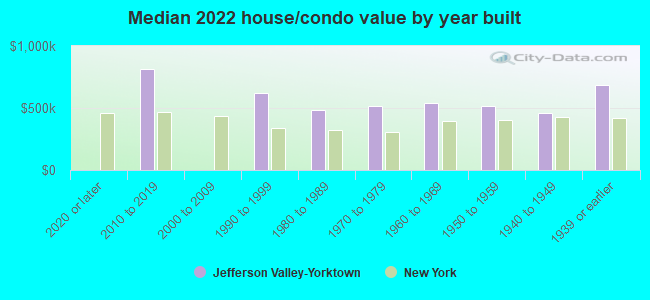
Mean price in 2022:
Detached houses: $615,848
Here: $615,848 State: $476,719 Townhouses or other attached units: $959,911
Here: $959,911 State: $699,270 In 2-unit structures: $201,137
Here: $201,137 State: $713,077 In 3-to-4-unit structures: $327,726
Here: $327,726 State: $764,568 In 5-or-more-unit structures: $299,698
Here: $299,698 State: $912,009
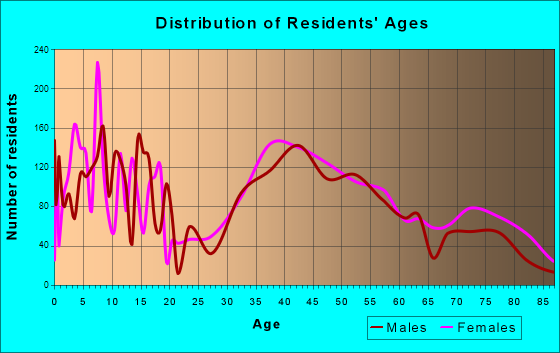
Total population: 14,142 (All urban)
Houses: 5,487 (5,197 occupied: 4,823 owner occupied, 386 renter occupied)
| % of renters here: | 7% |
| State: | 46% |
Housing density: 794 houses/condos per square mile
Median price asked for vacant for-sale houses and condos in 2022: $88,775.
Median contract rent in 2022: $1,720 (lower quartile is $1,483, upper quartile is $1,899)
Median gross rent in Jefferson Valley-Yorktown, NY in 2022: over $2,000
Housing units in Jefferson Valley-Yorktown with a mortgage: 3,008 (316 second mortgage, 0 home equity loan, 311 both second mortgage and home equity loan)
Houses without a mortgage: 151
Median household income for houses/condos with a mortgage: $167,381
Median household income for apartments without a mortgage: $96,902
Median monthly housing costs: $2,488
Compare current foreclosures near Jefferson Valley-Yorktown, NY:
| Photo | Address | Area | Beds / Baths | Price | Details |
|---|---|---|---|---|---|

|
#1
N Riverside Ave
Croton On Hudson, NY 10520
|
1,642 sq. feet
|
2 baths 3 beds |
$585,000
|
show details |

|
#2
Croton Park Rd
Cortlandt Manor, NY 10567
|
658 sq. feet
|
1 baths 1 beds |
$176,900
|
show details |

|
#3
Chalmers Blvd
Amawalk, NY 10501
|
1,072 sq. feet
|
1 baths 1 beds |
$475,000
|
show details |

|
#4
Olcott Way # 122
Ridgefield, CT 06877
|
920 sq. feet
|
1 baths 1 beds |
$364,900
|
show details |

|
#5
Tonetta Lake Rd
Brewster, NY 10509
|
2,383 sq. feet
|
2 baths 3 beds |
$174,900
|
show details |

|
#6
Lenni Lenape Ct
Stony Point, NY 10980
|
3,252 sq. feet
|
3 baths 4 beds |
$699,900
|
show details |

|
#7
Raven Ct
Armonk, NY 10504
|
- sq. feet
|
2 baths 3 beds |
$1,560,000
|
show details |

|
#8
Drew Ave
Highland Falls, NY 10928
|
1,724 sq. feet
|
2 baths 4 beds |
show details | |

|
#9
Ellis Pl
Ossining, NY 10562
|
1,432 sq. feet
|
2 baths 3 beds |
show details | |

|
#10
Walnut Dr
Mahopac, NY 10541
|
2,284 sq. feet
|
2 baths 4 beds |
show details |
| Photo | Address | Area | Beds / Baths | Price | Details |
|---|---|---|---|---|---|

|
#11
Rella Dr
New City, NY 10956
|
3,433 sq. feet
|
3 baths 6 beds |
show details | |

|
#12
Lea Ct
Pomona, NY 10970
|
3,188 sq. feet
|
3 baths 5 beds |
show details | |

|
#13
Echo Rd
Carmel, NY 10512
|
1,368 sq. feet
|
1 baths 3 beds |
show details | |

|
#14
Silver Spring Rd
New Windsor, NY 12553
|
1,800 sq. feet
|
1 baths 5 beds |
show details | |

|
#15
Zarriello Ln
West Haverstraw, NY 10993
|
1,350 sq. feet
|
2 baths 3 beds |
show details | |

|
#16
Deer Ln
Hopewell Junction, NY 12533
|
1,676 sq. feet
|
2 baths 4 beds |
show details | |

|
#17
Captain Shankey Dr
Garnerville, NY 10923
|
981 sq. feet
|
1 baths 2 beds |
show details | |

|
#18
Crompond Rd Apt B6
Peekskill, NY 10566
|
900 sq. feet
|
1 baths 2 beds |
show details | |

|
#19
Kings Hwy
Valley Cottage, NY 10989
|
1,754 sq. feet
|
3 baths 4 beds |
show details | |

|
#20
Rosalind Ave
Pleasantville, NY 10570
|
2,700 sq. feet
|
3 baths 4 beds |
show details |
| Photo | Address | Area | Beds / Baths | Price | Details |
|---|---|---|---|---|---|

|
#21
Grove St
Putnam Valley, NY 10579
|
2,338 sq. feet
|
2 baths 3 beds |
show details | |

|
#22
Ferris Dr
Garrison, NY 10524
|
1,937 sq. feet
|
2 baths 3 beds |
show details | |

|
#23
Corey Ln
Cold Spring, NY 10516
|
1,029 sq. feet
|
1 baths 2 beds |
show details | |

|
#24
Zarriello Ln
West Haverstraw, NY 10993
|
1,350 sq. feet
|
2 baths 3 beds |
show details | |

|
#25
Estates Dr
Ossining, NY 10562
|
3,293 sq. feet
|
3 baths 4 beds |
show details | |

|
#26
John St
Ossining, NY 10562
|
1,536 sq. feet
|
2 baths 4 beds |
show details | |

|
#27
James St
Stony Point, NY 10980
|
1,134 sq. feet
|
1 baths 2 beds |
show details | |

|
#28
William St
Ossining, NY 10562
|
1,160 sq. feet
|
2 baths 3 beds |
show details | |

|
#29
John F. Kennedy Drive
Stony Point, NY 10980
|
1,944 sq. feet
|
2 baths 3 beds |
show details | |

|
#30
Park Ave
Highland Mills, NY 10930
|
2,105 sq. feet
|
1 baths 3 beds |
show details |
| Photo | Address | Area | Beds / Baths | Price | Details |
|---|---|---|---|---|---|

|
#31
S Central Hwy
Garnerville, NY 10923
|
1,224 sq. feet
|
1 baths 3 beds |
show details | |

|
#32
Barnes Dr
Garnerville, NY 10923
|
1,132 sq. feet
|
1 baths 3 beds |
show details | |

|
#33
Chief Nimham Dr
Carmel, NY 10512
|
1,960 sq. feet
|
1 baths 2 beds |
show details | |

|
#34
Zachary Taylor St
Stony Point, NY 10980
|
5,019 sq. feet
|
4 baths 5 beds |
show details | |

|
#35
Ethan Allen Dr
Stony Point, NY 10980
|
1,890 sq. feet
|
1 baths 3 beds |
show details | |

|
#36
Haines Ct
Carmel, NY 10512
|
1,396 sq. feet
|
1 baths 3 beds |
show details | |

|
#37
Woodlake Dr
Thiells, NY 10984
|
2,744 sq. feet
|
3 baths 4 beds |
show details | |

|
#38
Lynch Ct
Garnerville, NY 10923
|
2,597 sq. feet
|
2 baths 5 beds |
show details | |

|
#39
Bridge Ln
Haverstraw, NY 10927
|
2,520 sq. feet
|
3 baths 3 beds |
show details | |

|
#40
Oakley Blvd
Garnerville, NY 10923
|
3,186 sq. feet
|
2 baths 5 beds |
show details |
| Photo | Address | Area | Beds / Baths | Price | Details |
|---|---|---|---|---|---|

|
#41
Sleepy Hollow Rd
Briarcliff Manor, NY 10510
|
2,990 sq. feet
|
2 baths 4 beds |
show details | |

|
#42
Mackey Rd
Garnerville, NY 10923
|
1,128 sq. feet
|
1 baths 4 beds |
show details | |

|
#43
Evergreen Row
Armonk, NY 10504
|
3,900 sq. feet
|
4 baths 4 beds |
show details | |

|
#44
S Lilburn Dr
Garnerville, NY 10923
|
1,960 sq. feet
|
1 baths 5 beds |
show details | |

|
#45
Ridge St
Brewster, NY 10509
|
1,944 sq. feet
|
1 baths 3 beds |
show details | |

|
#46
Blauvelt Ave
West Haverstraw, NY 10993
|
1,528 sq. feet
|
1 baths 3 beds |
show details | |

|
#47
Hurd Ave
Garnerville, NY 10923
|
1,140 sq. feet
|
2 baths 4 beds |
show details | |

|
#48
Captain Shankey Dr
Garnerville, NY 10923
|
1,301 sq. feet
|
1 baths 3 beds |
show details | |

|
#49
Justine Ct
Briarcliff Manor, NY 10510
|
3,678 sq. feet
|
2 baths 4 beds |
show details | |

|
Check over 1 million property listings on Foreclosure.com!
|
browse all offers | |||


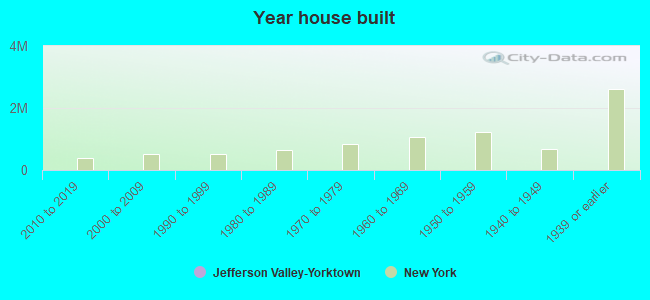
Median year apartment built: 1978
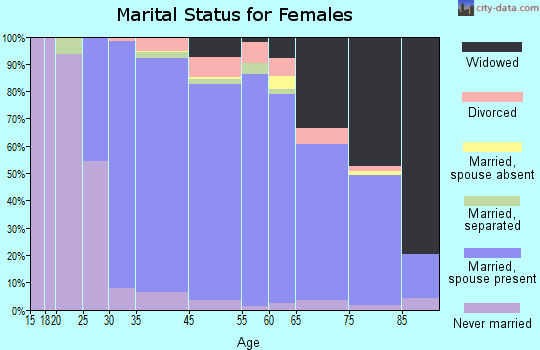
Household type by relationship:
Households: 13,966- Male householders: 2,623 (259 living alone), Female householders: 2,468 (891 living alone)
3,351 spouses (3,347 opposite-sex spouses), 150 unmarried partners, (150 opposite-sex unmarried partners), 4,866 children (4,734 natural, 65 adopted, 66 stepchildren), 53 grandchildren, 25 brothers or sisters, 193 parents, 0 foster children, 119 other relatives, 87 non-relatives
- In group quarters: 26
Size of family households: 1,752 2-persons, 629 3-persons, 950 4-persons, 424 5-persons, 116 6-persons.
Size of nonfamily households: 1,250 1-person, 91 2-persons.
2,425 married couples with children.
439 single-parent households (203 men, 236 women).
82.9% of residents of Jefferson Valley-Yorktown speak English at home.
8.1% of residents speak Spanish at home (62% speak English very well, 31% speak English well, 4% speak English not well, 3% don't speak English at all).
5.4% of residents speak other Indo-European language at home (76% speak English very well, 19% speak English well, 5% speak English not well).
2.8% of residents speak Asian or Pacific Island language at home (63% speak English very well, 33% speak English well, 4% speak English not well).
0.8% of residents speak other language at home (76% speak English very well, 24% speak English not well).
Foreign born population: 2,079 (14.9%)
(69.5% of them are naturalized citizens)
| Here: | 6.7 |
| State: | 6.3 |
| Here: | 4.2 |
| State: | 3.8 |
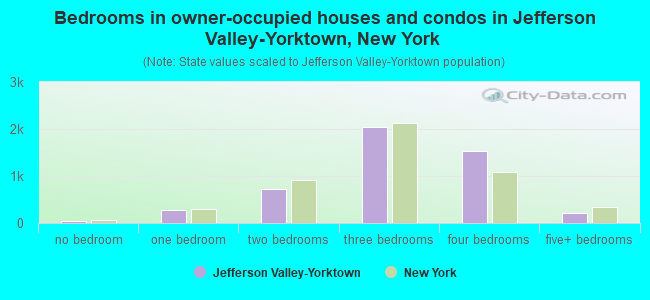
- Bedrooms in owner-occupied houses and condos in Jefferson Valley-Yorktown, New York
- 34no bedroom
- 2841 bedroom
- 7132 bedrooms
- 2,0483 bedrooms
- 1,5294 bedrooms
- 2165+ bedrooms
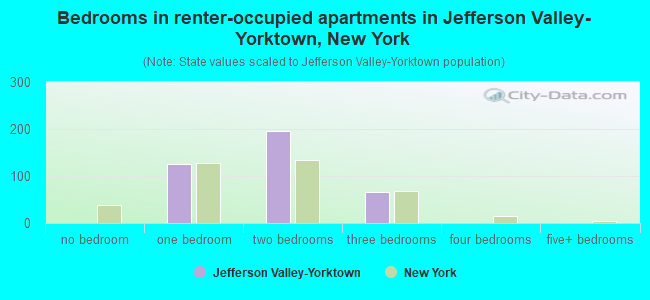
- Bedrooms in renter-occupied apartments in Jefferson Valley-Yorktown, New York
- 0no bedroom
- 1261 bedroom
- 1962 bedrooms
- 653 bedrooms
- 04 bedrooms
- 05+ bedrooms
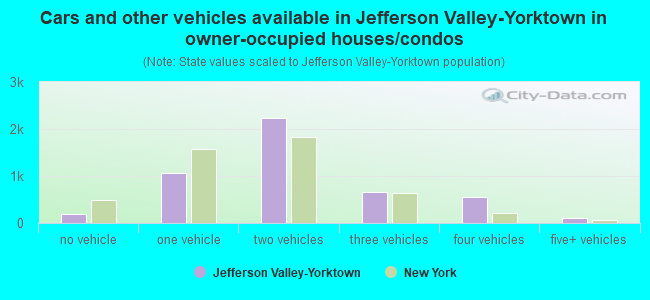
- Cars and other vehicles available in Jefferson Valley-Yorktown in owner-occupied houses/condos
- 189no vehicle
- 1,0741 vehicle
- 2,2332 vehicles
- 6653 vehicles
- 5584 vehicles
- 1055+ vehicles
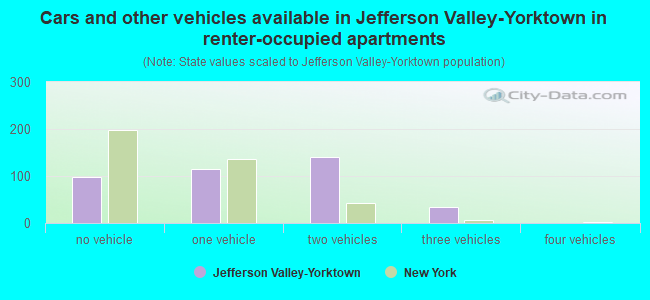
- Cars and other vehicles available in Jefferson Valley-Yorktown in renter-occupied apartments
- 98no vehicle
- 1141 vehicle
- 1412 vehicles
- 353 vehicles
- 04 vehicles
- 05+ vehicles
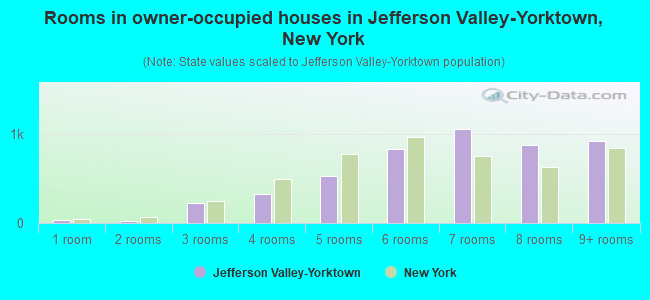
- Rooms in owner-occupied houses in Jefferson Valley-Yorktown, New York
- 341 room
- 232 rooms
- 2303 rooms
- 3314 rooms
- 5255 rooms
- 8316 rooms
- 1,0557 rooms
- 8738 rooms
- 9219+ rooms
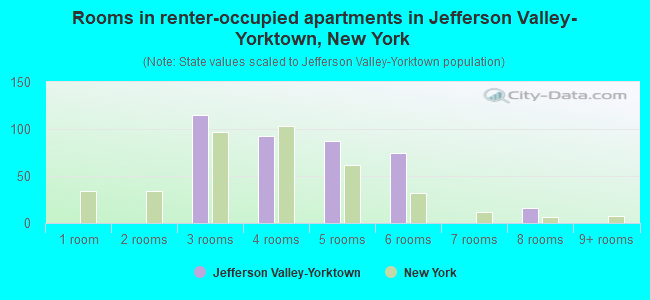
- Rooms in renter-occupied apartments in Jefferson Valley-Yorktown, New York
- 01 room
- 02 rooms
- 1153 rooms
- 934 rooms
- 875 rooms
- 756 rooms
- 07 rooms
- 168 rooms
- 09+ rooms
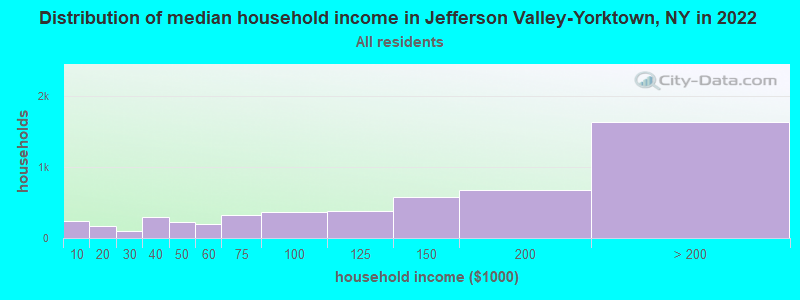
Jefferson Valley-Yorktown, NY household income distribution

- 241Less than $10,000
- 165$10,000 to $19,999
- 98$20,000 to $29,999
- 294$30,000 to $39,999
- 227$40,000 to $49,999
- 199$50,000 to $59,999
- 329$60,000 to $74,999
- 365$75,000 to $99,999
- 374$100,000 to $124,999
- 576$125,000 to $149,999
- 670$150,000 to $199,999
- 1,632$200,000 or more
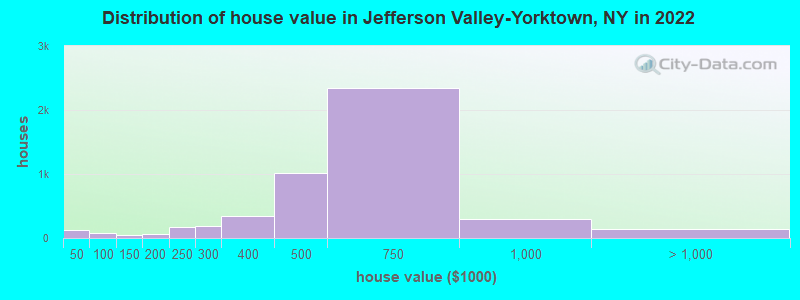
Home value of owner - occupied houses in 2022 in Jefferson Valley-Yorktown, NY
-
- 10Less than $10,000
- 31$25,000 to $29,999
- 13$30,000 to $34,999
- 72$40,000 to $49,999
- 42$100,000 to $124,999
- 39$150,000 to $174,999
- 21$175,000 to $199,999
- 166$200,000 to $249,999
- 181$250,000 to $299,999
- 350$300,000 to $399,999
- 1,011$400,000 to $499,999
- 2,349$500,000 to $749,999
- 300$750,000 to $999,999
- 91$1,000,000 to $1,499,999
- 8$1,500,000 to $1,999,999
- 41$2,000,000 or more
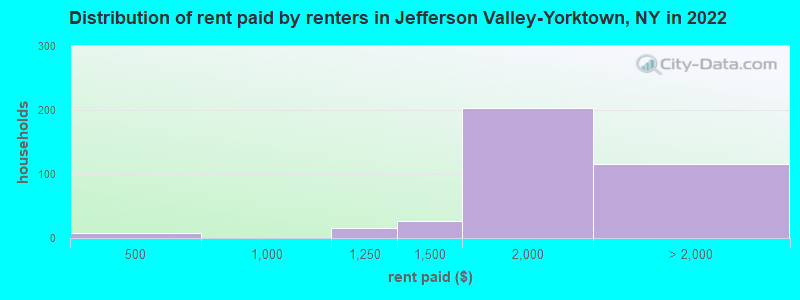
Rent paid by renters in 2022 in Jefferson Valley-Yorktown, NY
-
- 7$400 to $449
- 15$1,000 to $1,249
- 25$1,250 to $1,499
- 203$1,500 to $1,999
- 36$2,500 to $2,999
- 13$3,000 to $3,499
- 65No cash rent
Percentage of workers working in this county: 73.3%
Number of people working at home: 1,195 (18.2% of all workers)
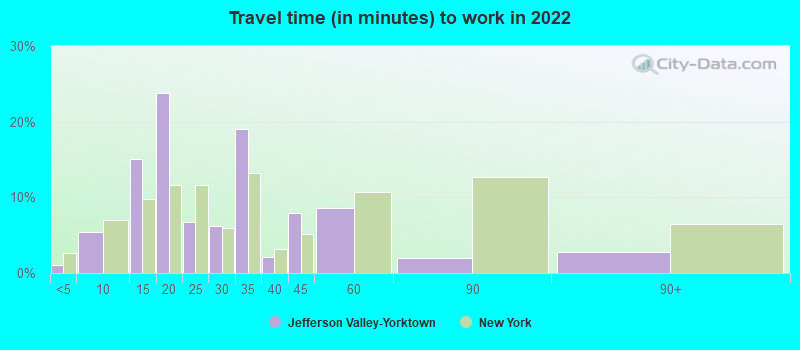
Travel time to work (commute)
- Less than 5 minutes: 42
- 5 to 9 minutes: 211
- 10 to 14 minutes: 464
- 15 to 19 minutes: 461
- 20 to 24 minutes: 568
- 25 to 29 minutes: 267
- 30 to 34 minutes: 737
- 35 to 39 minutes: 308
- 40 to 44 minutes: 191
- 45 to 59 minutes: 912
- 60 to 89 minutes: 749
- 90 or more minutes: 410
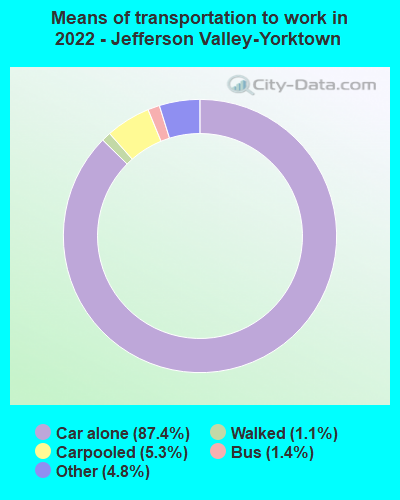
Means of transportation to work:
- Drove a car alone: 2,796 (64.2%)
- Carpooled: 170 (3.9%)
- Bus: 38 (0.9%)
- Taxi: 265 (6.1%)
- Walked: 36 (0.8%)
- Worked at home: 1,195 (27.4%)
- Unemployment by race in 2022
- Unemployment rate for White non-Hispanic residents
- 6.5%Males
- 4.6%Females
- Unemployment rate for Black residents
- 39.8%Females
- Unemployment rate for Asian residents
- 7.6%Females
- Unemployment rate for two or more race residents
- 21.2%Females
- Unemployment rate for Hispanic or Latino residents
- 17.6%Females
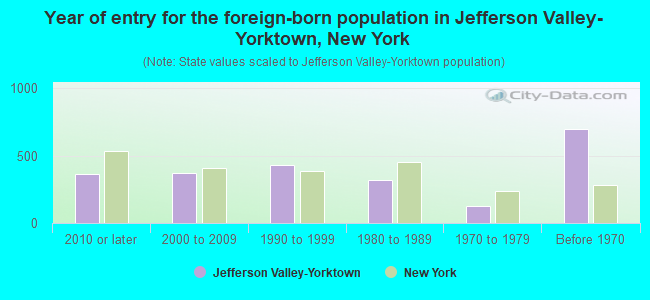
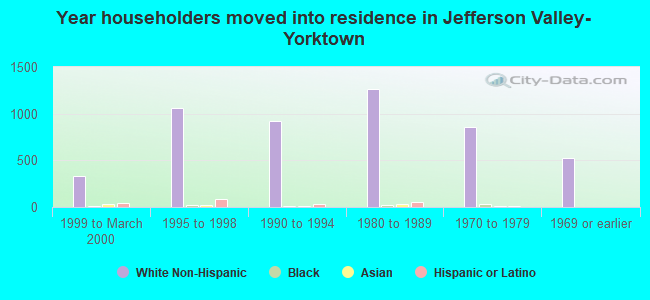
- Year of entry for the foreign-born population in Jefferson Valley-Yorktown, New York
- 3642010 or later
- 3742000 to 2009
- 4271990 to 1999
- 3191980 to 1989
- 1291970 to 1979
- 697Before 1970
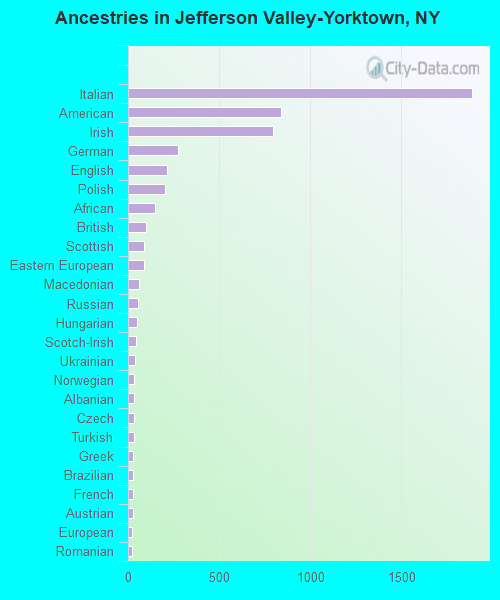
First ancestries reported:
- Italian: 1,887 (26.1%)
- American: 840 (11.6%)
- Irish: 798 (11.1%)
- German: 272 (3.8%)
- English: 212 (2.9%)
- Polish: 201 (2.8%)
- African: 146 (2.0%)
- British: 97 (1.3%)
- Scottish: 86 (1.2%)
- Eastern European: 86 (1.2%)
- Macedonian: 58 (0.8%)
- Russian: 55 (0.8%)
- Hungarian: 49 (0.7%)
- Scotch-Irish: 46 (0.6%)
- Ukrainian: 39 (0.5%)
- Norwegian: 35 (0.5%)
- Albanian: 34 (0.5%)
- Czech: 34 (0.5%)
- Turkish: 33 (0.5%)
- Greek: 29 (0.4%)
- Brazilian: 28 (0.4%)
- French: 27 (0.4%)
- Austrian: 25 (0.3%)
- European: 24 (0.3%)
- Romanian: 23 (0.3%)
- Ghanaian: 21 (0.3%)
- Iranian: 16 (0.2%)
- Swiss: 16 (0.2%)
- West Indian: 14 (0.2%)
- Lithuanian: 13 (0.2%)
- French Canadian: 11 (0.2%)
- Czechoslovakian: 11 (0.2%)
- Slovak: 9 (0.1%)
- Lebanese: 7 (0.10%)
- Armenian: 6 (0.08%)
- Haitian: 2 (0.03%)
Most common places of birth for foreign-born residents (%):
| Jefferson Valley-Yorktown: | 9.8% (201) |
| New York: | 2.5% (111,920) |
| Jefferson Valley-Yorktown: | 8.4% (173) |
| New York: | 3.5% (158,432) |
| Jefferson Valley-Yorktown: | 8.0% (164) |
| New York: | 0.9% (39,058) |
| Jefferson Valley-Yorktown: | 8.0% (164) |
| New York: | 5.0% (227,557) |
| Jefferson Valley-Yorktown: | 5.5% (113) |
| New York: | 0.6% (26,772) |
| Jefferson Valley-Yorktown: | 5.4% (112) |
| New York: | 9.1% (410,910) |
| Jefferson Valley-Yorktown: | 5.2% (108) |
| New York: | 0.1% (5,566) |
| Jefferson Valley-Yorktown: | 4.8% (98) |
| New York: | 0.0% (769) |
| Jefferson Valley-Yorktown: | 4.8% (98) |
| New York: | 0.8% (33,869) |
| Jefferson Valley-Yorktown: | 4.2% (86) |
| New York: | 0.1% (2,334) |
| Jefferson Valley-Yorktown: | 4.0% (83) |
| New York: | 1.4% (65,102) |
| Jefferson Valley-Yorktown: | 4.0% (83) |
| New York: | 0.7% (30,173) |
| Jefferson Valley-Yorktown: | 2.9% (59) |
| New York: | 1.8% (81,374) |
| Jefferson Valley-Yorktown: | 2.8% (58) |
| New York: | 11.1% (501,040) |
| Jefferson Valley-Yorktown: | 2.3% (48) |
| New York: | 0.1% (5,087) |
| Jefferson Valley-Yorktown: | 1.7% (36) |
| New York: | 0.2% (8,026) |
| Jefferson Valley-Yorktown: | 1.7% (35) |
| New York: | 0.1% (4,732) |
| Jefferson Valley-Yorktown: | 1.5% (31) |
| New York: | 0.5% (23,058) |
Place of birth for U.S.-born residents:
- This state: 10,634
- Other state: 1,024
- Northeast: 674
- Midwest: 124
- South: 164
- West: 38
96.2% of Jefferson Valley-Yorktown residents lived in the same house 1 years ago.
Out of people who lived in different houses, 38.3% lived in this county.
Out of people who lived in different counties, 73.8% lived in New York.
| Jefferson Valley-Yorktown: | 96.2% |
| State average: | 89.6% |
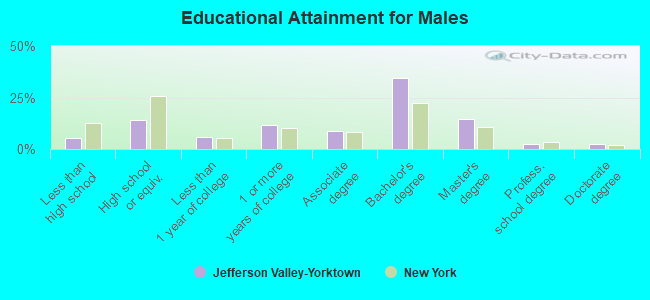
Education attainment for males 25 years and older:
- No schooling: 21
- Nursery to 4th grade: 0
- 5th and 6th grade: 18
- 7th and 8th grade: 0
- 9th grade: 25
- 10th grade: 15
- 11th grade: 22
- 12th grade, no diploma: 165
- High school graduate (or equivalency): 666
- Less than 1 year of college: 284
- Some college more than 1 year, no degree: 548
- Associate degree: 414
- Bachelor's degree: 1,648
- Master's degree: 701
- Professional school degree: 124
- Doctorate degree: 125
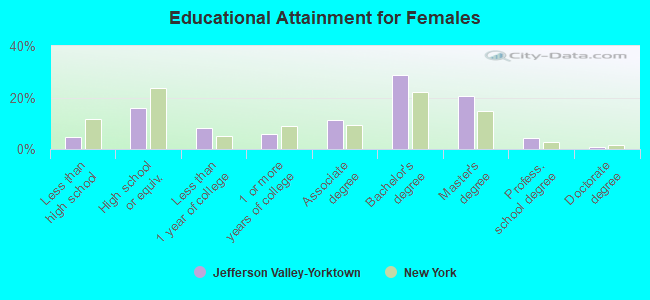
Education attainment for females 25 years and older:
- No schooling: 38
- Nursery to 4th grade: 0
- 5th and 6th grade: 11
- 7th and 8th grade: 57
- 9th grade: 0
- 10th grade: 18
- 11th grade: 50
- 12th grade, no diploma: 63
- High school graduate (or equivalency): 836
- Less than 1 year of college: 427
- Some college more than 1 year, no degree: 307
- Associate degree: 590
- Bachelor's degree: 1,516
- Master's degree: 1,097
- Professional school degree: 233
- Doctorate degree: 48
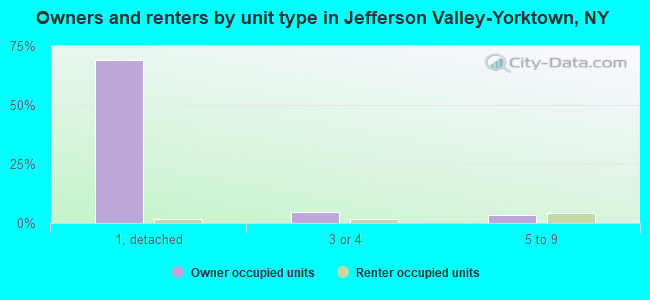
Housing units in structures:
- One, detached: 4,146
- One, attached: 512
- Two: 130
- 3 or 4: 367
- 5 to 9: 261
- 10 to 19: 59
- 20 to 49: 8
Housing units lacking complete kitchen facilities in 2022: 1.4%
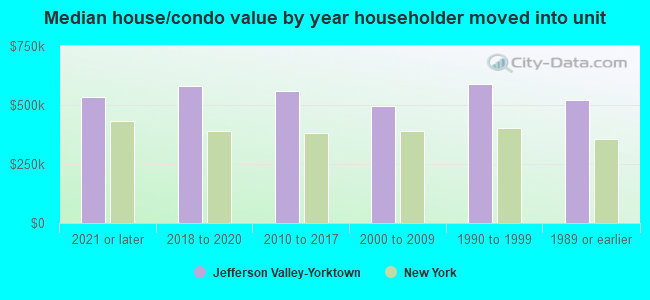
House/condo owner moved in on average 13 years ago
Renter moved in on average 3 years ago
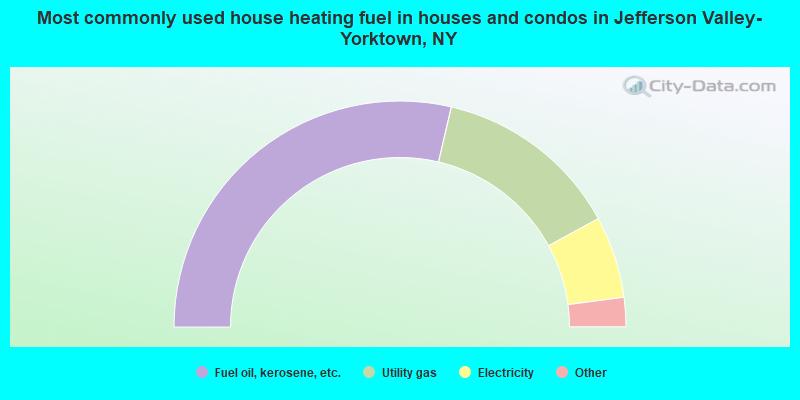
- 57.3%Fuel oil, kerosene, etc.
- 26.8%Utility gas
- 11.7%Electricity
- 4.0%Bottled, tank, or LP gas
- 0.2%No fuel used
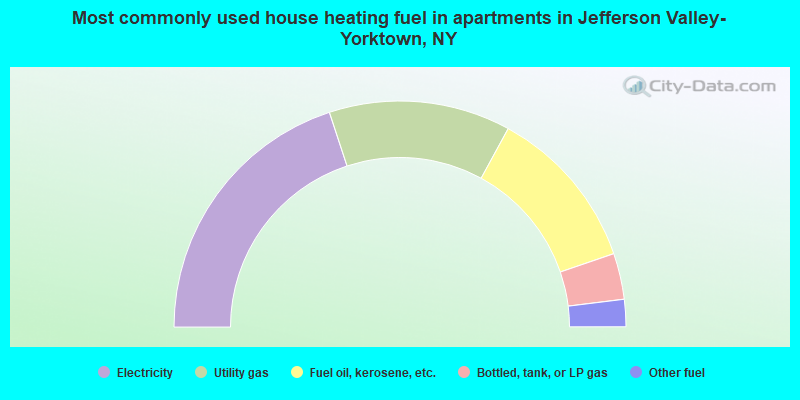
- 39.9%Electricity
- 26.0%Utility gas
- 23.6%Fuel oil, kerosene, etc.
- 6.6%Bottled, tank, or LP gas
- 3.9%Other fuel
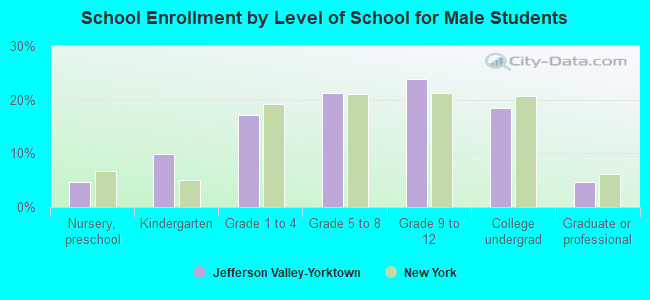
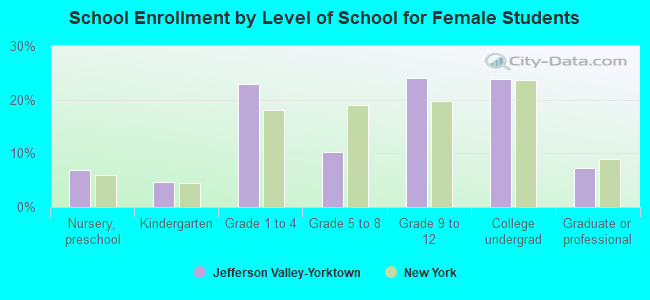
Private vs. public school enrollment:
| Here: | 1.2% |
| New York: | 15.6% |
| Here: | 16.4% |
| New York: | 15.0% |
| Here: | 44.6% |
| New York: | 39.2% |