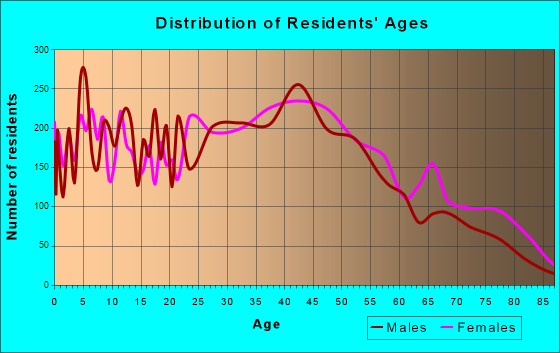
Jeffersonville, IN (Indiana) Houses and Residents
| Jeffersonville: | $210,693 |
| Indiana: | $208,700 |
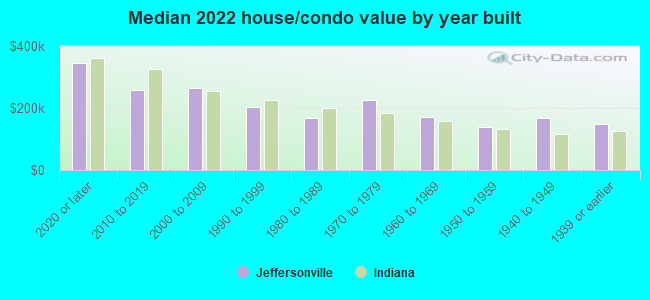
Mean price in 2022:
Detached houses: $231,185
Here: $231,185 State: $257,916 Townhouses or other attached units: $150,051
Here: $150,051 State: $224,114 In 2-unit structures: $385,787
Here: $385,787 State: $175,375 In 3-to-4-unit structures: $60,346
Here: $60,346 State: $151,116 In 5-or-more-unit structures: $197,681
Here: $197,681 State: $200,844 Mobile homes: $29,890
Here: $29,890 State: $67,116
Total population: 46,440 (Urban population: 27,463, Rural population: 0)
Houses: 23,819 (21,410 occupied: 15,753 owner occupied, 6,286 renter occupied)
| % of renters here: | 29% |
| State: | 29% |
Housing density: 1,754 houses/condos per square mile
Median price asked for vacant for-sale houses and condos in 2022: $238,022.
Median contract rent in 2022: $856 (lower quartile is $711, upper quartile is $1,055)
Median rent asked for vacant for-rent units in 2022: $723
Median gross rent in Jeffersonville, IN in 2022: $1,088
Housing units in Jeffersonville with a mortgage: 10,880 (616 second mortgage, 7 home equity loan, 528 both second mortgage and home equity loan)
Houses without a mortgage: 356
Median household income for houses/condos with a mortgage: $87,077
Median household income for apartments without a mortgage: $68,158
Median monthly housing costs: $1,044
Compare current foreclosures in Jeffersonville, IN:
| Photo | Address | Area | Beds / Baths | Price | Details |
|---|---|---|---|---|---|

|
#1
E Park Pl
Jeffersonville, IN 47130
|
1,236 sq. feet
|
1 baths 3 beds |
show details | |

|
#2
Morris Ave
Jeffersonville, IN 47130
|
1,320 sq. feet
|
1 baths 3 beds |
show details | |

|
#3
Rolling Ridge Way
Jeffersonville, IN 47130
|
1,300 sq. feet
|
2 baths 3 beds |
show details | |

|
#4
Wheatfield Blvd
Jeffersonville, IN 47130
|
1,344 sq. feet
|
2 baths 3 beds |
show details | |

|
#5
Hopkins Ln
Jeffersonville, IN 47130
|
888 sq. feet
|
1 baths 3 beds |
show details | |

|
#6
Webster Blvd
Jeffersonville, IN 47130
|
1,983 sq. feet
|
1 baths 3 beds |
show details | |

|
#7
Wooded Way
Jeffersonville, IN 47130
|
1,003 sq. feet
|
1 baths 2 beds |
show details | |

|
#8
Basswood Ct
Jeffersonville, IN 47130
|
2,605 sq. feet
|
2 baths 4 beds |
show details | |

|
#9
Presley Ln
Jeffersonville, IN 47130
|
1,992 sq. feet
|
2 baths 3 beds |
show details | |

|
#10
Nole Dr
Jeffersonville, IN 47130
|
1,366 sq. feet
|
2 baths 3 beds |
show details |
| Photo | Address | Area | Beds / Baths | Price | Details |
|---|---|---|---|---|---|

|
#11
Forest Ct
Jeffersonville, IN 47130
|
1,377 sq. feet
|
2 baths 3 beds |
show details | |

|
#12
Sportsman Dr
Jeffersonville, IN 47130
|
2,244 sq. feet
|
1 baths 4 beds |
show details | |

|
#13
E Court Ave
Jeffersonville, IN 47130
|
1,088 sq. feet
|
1 baths 2 beds |
show details | |

|
#14
E Court Ave
Jeffersonville, IN 47130
|
950 sq. feet
|
1 baths 3 beds |
show details | |

|
#15
Silver Slate Dr
Jeffersonville, IN 47130
|
1,312 sq. feet
|
2 baths 3 beds |
show details | |

|
#16
Luther Cir
Jeffersonville, IN 47130
|
1,948 sq. feet
|
1 baths 2 beds |
show details | |

|
#17
Holmans Ln
Jeffersonville, IN 47130
|
1,438 sq. feet
|
1 baths 3 beds |
show details | |

|
#18
Morris Ave
Jeffersonville, IN 47130
|
1,155 sq. feet
|
1 baths 2 beds |
show details | |

|
#19
Holmans Ln
Jeffersonville, IN 47130
|
1,206 sq. feet
|
1 baths 3 beds |
show details | |

|
#20
Briscoe Dr
Jeffersonville, IN 47130
|
1,091 sq. feet
|
1 baths 2 beds |
show details |
| Photo | Address | Area | Beds / Baths | Price | Details |
|---|---|---|---|---|---|

|
#21
N Walford Dr
Jeffersonville, IN 47130
|
2,080 sq. feet
|
2 baths 3 beds |
show details | |

|
#22
Belmar Dr
Jeffersonville, IN 47130
|
1,153 sq. feet
|
1 baths 3 beds |
show details | |

|
#23
Jackson St
Jeffersonville, IN 47130
|
1,075 sq. feet
|
1 baths 3 beds |
show details | |

|
#24
Penn St
Jeffersonville, IN 47130
|
1,111 sq. feet
|
1 baths 3 beds |
show details | |

|
#25
Brighton Ave
Jeffersonville, IN 47130
|
1,057 sq. feet
|
1 baths 2 beds |
show details | |

|
#26
Cameron Dr
Jeffersonville, IN 47130
|
1,107 sq. feet
|
1 baths 3 beds |
show details | |

|
#27
W Charlestown Ave
Jeffersonville, IN 47130
|
1,026 sq. feet
|
1 baths 3 beds |
show details | |

|
#28
Walnut St
Jeffersonville, IN 47130
|
1,097 sq. feet
|
1 baths 2 beds |
show details | |

|
#29
Gail Dr
Jeffersonville, IN 47130
|
2,235 sq. feet
|
1 baths 3 beds |
show details | |

|
#30
Pennsylvania Ave
Jeffersonville, IN 47130
|
984 sq. feet
|
1 baths 3 beds |
show details |
| Photo | Address | Area | Beds / Baths | Price | Details |
|---|---|---|---|---|---|

|
#31
Bishop Rd
Jeffersonville, IN 47130
|
1,107 sq. feet
|
1 baths 3 beds |
show details | |

|
#32
Holmans Ln
Jeffersonville, IN 47130
|
1,102 sq. feet
|
1 baths 3 beds |
show details | |

|
#33
Willow Dr
Jeffersonville, IN 47130
|
1,053 sq. feet
|
1 baths 3 beds |
show details | |

|
#34
Spring St
Jeffersonville, IN 47130
|
1,222 sq. feet
|
1 baths 3 beds |
show details | |

|
#35
Holly Dr
Jeffersonville, IN 47130
|
1,073 sq. feet
|
1 baths 3 beds |
show details | |

|
#36
Webster Blvd
Jeffersonville, IN 47130
|
1,750 sq. feet
|
1 baths 3 beds |
show details | |

|
#37
Presidential Pl
Jeffersonville, IN 47130
|
1,145 sq. feet
|
2 baths 3 beds |
show details | |

|
#38
Plaza Dr
Jeffersonville, IN 47130
|
1,288 sq. feet
|
2 baths 4 beds |
show details | |

|
#39
Middle Rd
Jeffersonville, IN 47130
|
1,603 sq. feet
|
1 baths 3 beds |
show details | |

|
#40
Nole Dr
Jeffersonville, IN 47130
|
3,229 sq. feet
|
3 baths 3 beds |
show details |
| Photo | Address | Area | Beds / Baths | Price | Details |
|---|---|---|---|---|---|

|
#41
Crums Ln
Jeffersonville, IN 47130
|
2,370 sq. feet
|
1 baths 3 beds |
show details | |

|
#42
Crums Ln
Jeffersonville, IN 47130
|
2,136 sq. feet
|
1 baths 3 beds |
show details | |

|
#43
Huston Dr
Jeffersonville, IN 47130
|
972 sq. feet
|
1 baths 2 beds |
show details | |

|
#44
Ridgetop Cir
Jeffersonville, IN 47130
|
1,610 sq. feet
|
2 baths 3 beds |
show details | |

|
#45
River Heritage Trl
Jeffersonville, IN 47130
|
2,016 sq. feet
|
2 baths 3 beds |
show details | |

|
#46
Burns St
Jeffersonville, IN 47130
|
1,064 sq. feet
|
1 baths 2 beds |
show details | |

|
#47
Meigs Ave
Jeffersonville, IN 47130
|
1,270 sq. feet
|
1 baths 3 beds |
show details | |

|
#48
Wooded Way
Jeffersonville, IN 47130
|
1,200 sq. feet
|
1 baths 3 beds |
show details | |

|
#49
Crimson Point Dr
Jeffersonville, IN 47130
|
1,860 sq. feet
|
2 baths 3 beds |
show details | |

|
Check over 1 million property listings on Foreclosure.com!
|
browse all offers | |||

Latest news about housing in Jeffersonville, IN collected exclusively by city-data.com from local newspapers, TV, and radio stations


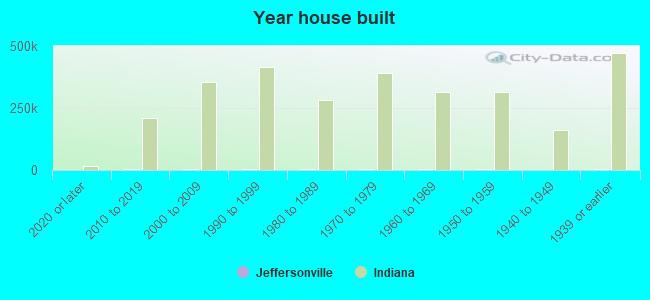
Median year apartment built: 1978
Household type by relationship:
Households: 50,898- Male householders: 9,589 (3,225 living alone), Female householders: 11,284 (3,246 living alone)
9,217 spouses (9,065 opposite-sex spouses), 1,588 unmarried partners, (1,530 opposite-sex unmarried partners), 13,634 children (12,546 natural, 426 adopted, 661 stepchildren), 1,564 grandchildren, 446 brothers or sisters, 544 parents, 113 foster children, 457 other relatives, 1,560 non-relatives
- In group quarters: 898
Size of family households: 5,974 2-persons, 3,692 3-persons, 2,462 4-persons, 724 5-persons, 488 6-persons, 228 7-or-more-persons.
Size of nonfamily households: 7,403 1-person, 1,000 2-persons, 79 3-persons, 40 4-persons.
5,884 married couples with children.
3,285 single-parent households (677 men, 2,608 women).
94.2% of residents of Jeffersonville speak English at home.
3.2% of residents speak Spanish at home (69% speak English very well, 21% speak English well, 8% speak English not well, 2% don't speak English at all).
1.4% of residents speak other Indo-European language at home (86% speak English very well, 14% speak English well).
0.6% of residents speak Asian or Pacific Island language at home (43% speak English very well, 41% speak English well, 16% speak English not well).
0.1% of residents speak other language at home (100% speak English very well).
Foreign born population: 1,928 (3.8%)
(59.2% of them are naturalized citizens)
| Here: | 6.2 |
| State: | 6.6 |
| Here: | 4.0 |
| State: | 4.3 |
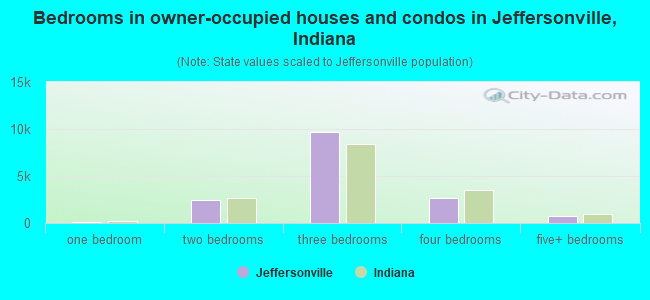
- Bedrooms in owner-occupied houses and condos in Jeffersonville, Indiana
- 12no bedroom
- 1461 bedroom
- 2,4602 bedrooms
- 9,6753 bedrooms
- 2,6934 bedrooms
- 7685+ bedrooms
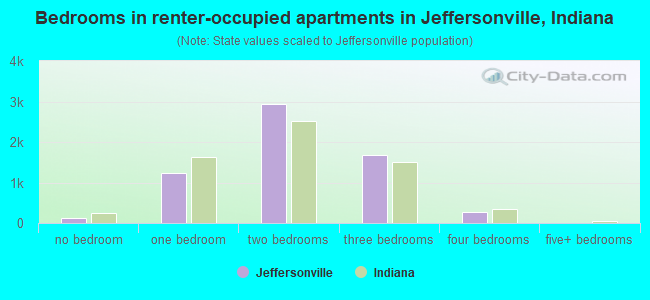
- Bedrooms in renter-occupied apartments in Jeffersonville, Indiana
- 125no bedroom
- 1,2441 bedroom
- 2,9382 bedrooms
- 1,6883 bedrooms
- 2824 bedrooms
- 105+ bedrooms
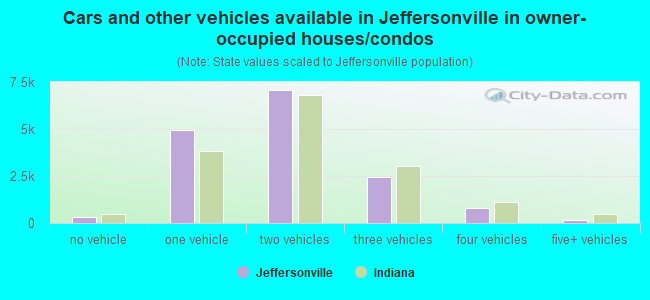
- Cars and other vehicles available in Jeffersonville in owner-occupied houses/condos
- 330no vehicle
- 4,9641 vehicle
- 7,0572 vehicles
- 2,4243 vehicles
- 7984 vehicles
- 1805+ vehicles
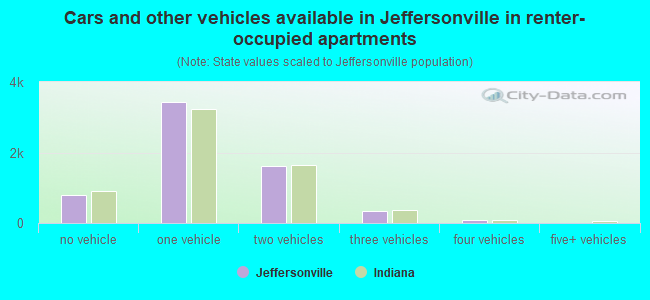
- Cars and other vehicles available in Jeffersonville in renter-occupied apartments
- 792no vehicle
- 3,4441 vehicle
- 1,6312 vehicles
- 3383 vehicles
- 764 vehicles
- 85+ vehicles
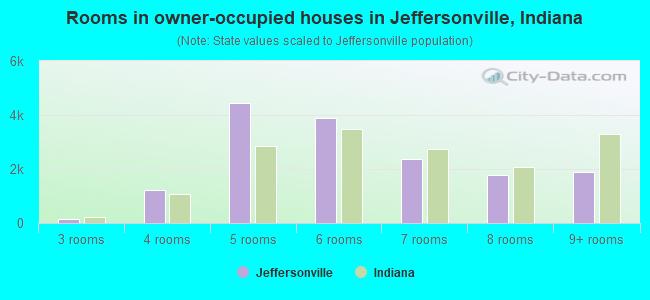
- Rooms in owner-occupied houses in Jeffersonville, Indiana
- 01 room
- 352 rooms
- 1553 rooms
- 1,2084 rooms
- 4,4355 rooms
- 3,8946 rooms
- 2,3707 rooms
- 1,7818 rooms
- 1,8769+ rooms
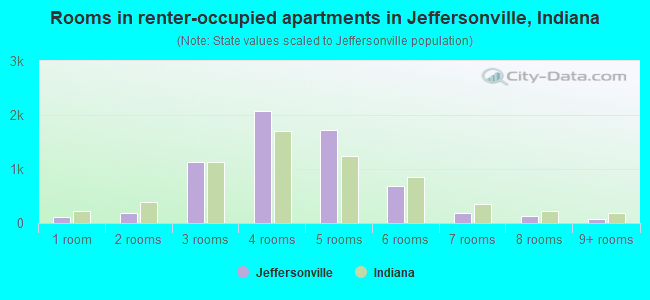
- Rooms in renter-occupied apartments in Jeffersonville, Indiana
- 1121 room
- 1842 rooms
- 1,1363 rooms
- 2,0744 rooms
- 1,7265 rooms
- 6766 rooms
- 1767 rooms
- 1258 rooms
- 789+ rooms
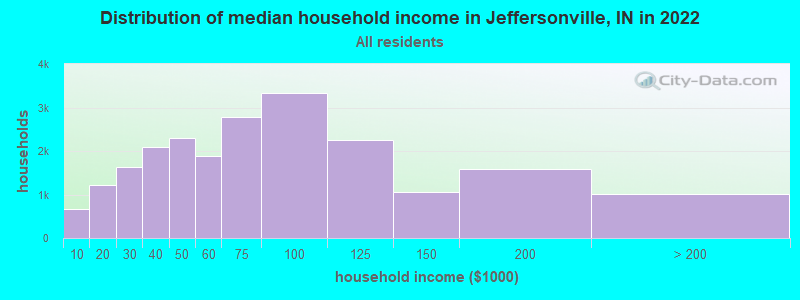
Jeffersonville, IN household income distribution

- 663Less than $10,000
- 1,214$10,000 to $19,999
- 1,639$20,000 to $29,999
- 2,091$30,000 to $39,999
- 2,298$40,000 to $49,999
- 1,880$50,000 to $59,999
- 2,793$60,000 to $74,999
- 3,324$75,000 to $99,999
- 2,243$100,000 to $124,999
- 1,060$125,000 to $149,999
- 1,584$150,000 to $199,999
- 1,009$200,000 or more
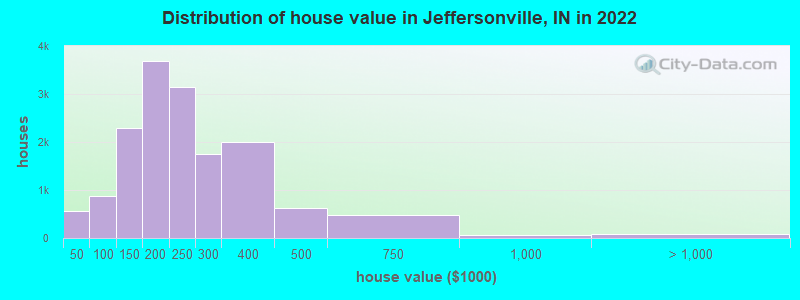
Home value of owner - occupied houses in 2022 in Jeffersonville, IN
-
- 110Less than $10,000
- 67$10,000 to $14,999
- 193$15,000 to $19,999
- 34$20,000 to $24,999
- 63$25,000 to $29,999
- 51$30,000 to $34,999
- 44$40,000 to $49,999
- 156$50,000 to $59,999
- 76$60,000 to $69,999
- 125$70,000 to $79,999
- 252$80,000 to $89,999
- 228$90,000 to $99,999
- 767$100,000 to $124,999
- 1,523$125,000 to $149,999
- 2,147$150,000 to $174,999
- 1,540$175,000 to $199,999
- 3,137$200,000 to $249,999
- 1,747$250,000 to $299,999
- 2,006$300,000 to $399,999
- 619$400,000 to $499,999
- 485$500,000 to $749,999
- 69$750,000 to $999,999
- 57$1,000,000 to $1,499,999
- 31$2,000,000 or more
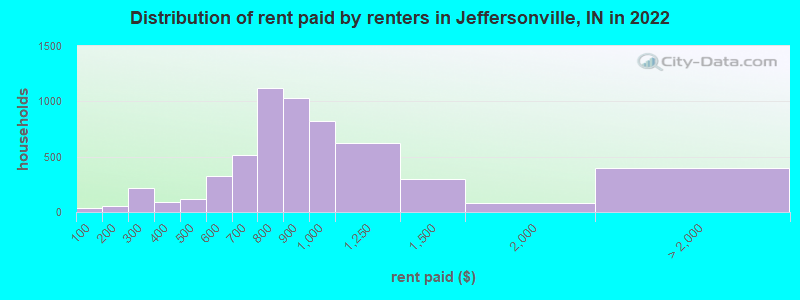
Rent paid by renters in 2022 in Jeffersonville, IN
-
- 39Less than $100
- 7$100 to $149
- 45$150 to $199
- 114$200 to $249
- 102$250 to $299
- 53$300 to $349
- 35$350 to $399
- 69$400 to $449
- 48$450 to $499
- 150$500 to $549
- 170$550 to $599
- 215$600 to $649
- 301$650 to $699
- 520$700 to $749
- 601$750 to $799
- 1,032$800 to $899
- 824$900 to $999
- 622$1,000 to $1,249
- 297$1,250 to $1,499
- 77$1,500 to $1,999
- 13$2,000 to $2,499
- 383No cash rent
Percentage of workers working in this county: 59.9%
Number of people working at home: 3,987 (15.6% of all workers)
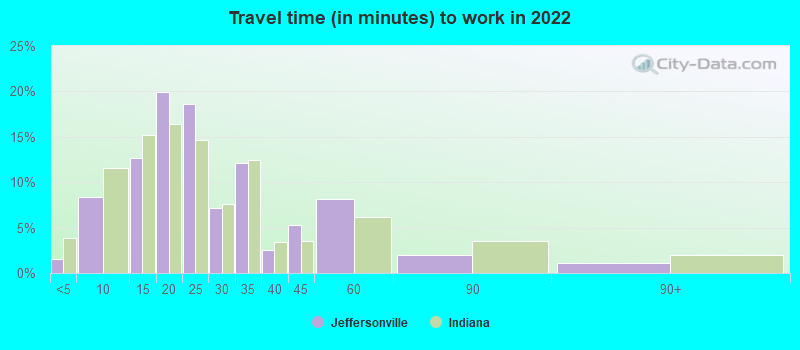
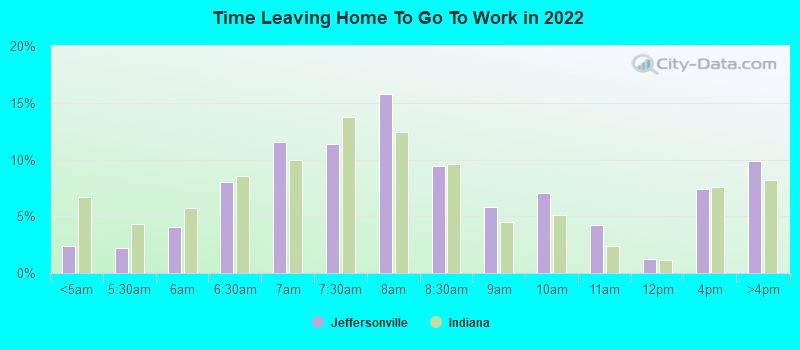
Travel time to work (commute)
- Less than 5 minutes: 434
- 5 to 9 minutes: 2,159
- 10 to 14 minutes: 3,965
- 15 to 19 minutes: 4,913
- 20 to 24 minutes: 5,062
- 25 to 29 minutes: 1,846
- 30 to 34 minutes: 2,732
- 35 to 39 minutes: 370
- 40 to 44 minutes: 495
- 45 to 59 minutes: 458
- 60 to 89 minutes: 418
- 90 or more minutes: 104
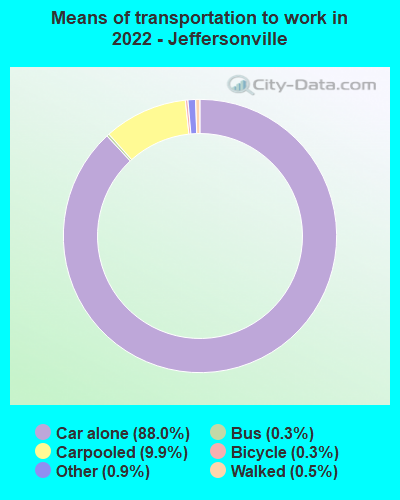
Means of transportation to work:
- Drove a car alone: 25,227 (76.7%)
- Carpooled: 3,135 (9.5%)
- Bus: 71 (0.2%)
- Subway or elevated rail: 19 (0.1%)
- Taxi: 321 (1.0%)
- Bicycle: 100 (0.3%)
- Walked: 133 (0.4%)
- Worked at home: 3,987 (12.1%)
- Unemployment by race in 2022
- Unemployment rate for White non-Hispanic residents
- 3.1%Males
- 3.9%Females
- Unemployment rate for Black residents
- 4.4%Males
- 1.2%Females
- Unemployment rate for other race residents
- 7.9%Males
- Unemployment rate for two or more race residents
- 5.2%Females
- Unemployment rate for Hispanic or Latino residents
- 6.5%Males
- 4.1%Females
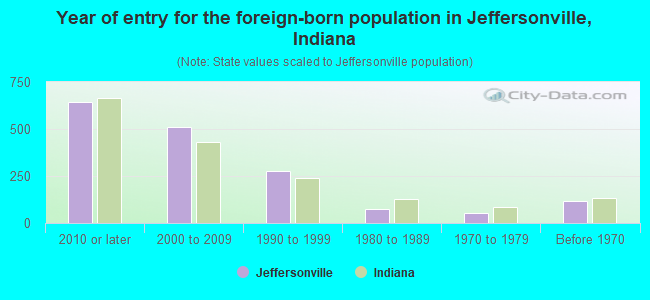
- Year of entry for the foreign-born population in Jeffersonville, Indiana
- 6452010 or later
- 5092000 to 2009
- 2761990 to 1999
- 771980 to 1989
- 541970 to 1979
- 119Before 1970
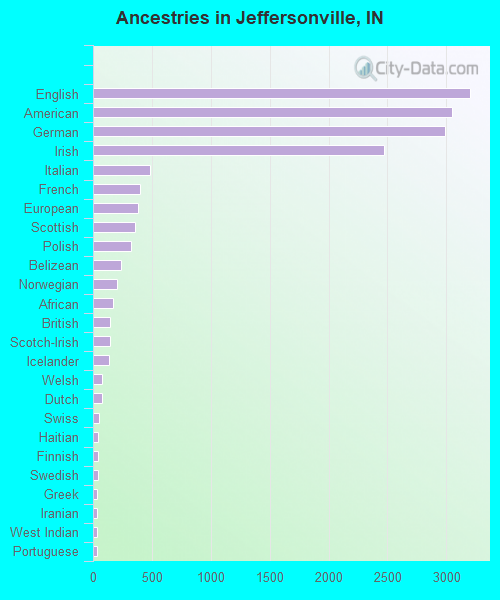
First ancestries reported:
- English: 3,202 (13.7%)
- American: 3,045 (13.0%)
- German: 2,989 (12.8%)
- Irish: 2,473 (10.6%)
- Italian: 480 (2.1%)
- French: 401 (1.7%)
- European: 378 (1.6%)
- Scottish: 360 (1.5%)
- Polish: 321 (1.4%)
- Belizean: 239 (1.0%)
- Norwegian: 202 (0.9%)
- African: 170 (0.7%)
- British: 144 (0.6%)
- Scotch-Irish: 141 (0.6%)
- Icelander: 134 (0.6%)
- Welsh: 80 (0.3%)
- Dutch: 77 (0.3%)
- Swiss: 51 (0.2%)
- Haitian: 46 (0.2%)
- Finnish: 45 (0.2%)
- Swedish: 40 (0.2%)
- Greek: 36 (0.2%)
- Iranian: 36 (0.2%)
- West Indian: 33 (0.1%)
- Portuguese: 30 (0.1%)
- Somali: 21 (0.09%)
- Hungarian: 19 (0.08%)
- Eastern European: 17 (0.07%)
- New Zealander: 17 (0.07%)
- Croatian: 11 (0.05%)
- Pennsylvania German: 10 (0.04%)
- Latvian: 10 (0.04%)
- Scandinavian: 8 (0.03%)
- Czech: 8 (0.03%)
- Ukrainian: 8 (0.03%)
- Jamaican: 8 (0.03%)
- Slavic: 7 (0.03%)
- Austrian: 6 (0.03%)
- French Canadian: 5 (0.02%)
- Belgian: 2 (0.01%)
Most common places of birth for foreign-born residents (%):
| Jeffersonville: | 26.6% (502) |
| Indiana: | 27.0% (101,996) |
| Jeffersonville: | 8.9% (168) |
| Indiana: | 0.8% (3,114) |
| Jeffersonville: | 8.2% (154) |
| Indiana: | 2.1% (7,834) |
| Jeffersonville: | 6.2% (116) |
| Indiana: | 0.9% (3,221) |
| Jeffersonville: | 5.7% (108) |
| Indiana: | 8.5% (32,127) |
| Jeffersonville: | 5.2% (98) |
| Indiana: | 0.1% (346) |
| Jeffersonville: | 4.5% (85) |
| Indiana: | 1.6% (5,892) |
| Jeffersonville: | 3.6% (67) |
| Indiana: | 0.3% (1,177) |
| Jeffersonville: | 3.3% (62) |
| Indiana: | 0.4% (1,406) |
| Jeffersonville: | 3.1% (58) |
| Indiana: | 2.3% (8,656) |
| Jeffersonville: | 2.8% (53) |
| Indiana: | 5.3% (19,877) |
| Jeffersonville: | 2.3% (44) |
| Indiana: | 0.4% (1,509) |
| Jeffersonville: | 2.2% (41) |
| Indiana: | 1.8% (6,645) |
| Jeffersonville: | 2.1% (39) |
| Indiana: | 1.7% (6,439) |
| Jeffersonville: | 2.0% (37) |
| Indiana: | 0.4% (1,600) |
| Jeffersonville: | 2.0% (37) |
| Indiana: | 0.0% (96) |
| Jeffersonville: | 1.7% (32) |
| Indiana: | 3.1% (11,851) |
| Jeffersonville: | 1.7% (32) |
| Indiana: | 0.1% (327) |
| Jeffersonville: | 1.5% (29) |
| Indiana: | 2.0% (7,653) |
Place of birth for U.S.-born residents:
- This state: 23,889
- Other state: 24,318
- Northeast: 851
- Midwest: 3,606
- South: 17,913
- West: 1,908
87.0% of Jeffersonville residents lived in the same house 1 years ago.
Out of people who lived in different houses, 34.6% lived in this county.
Out of people who lived in different counties, 46.8% lived in Indiana.
| Jeffersonville: | 87.0% |
| State average: | 87.1% |
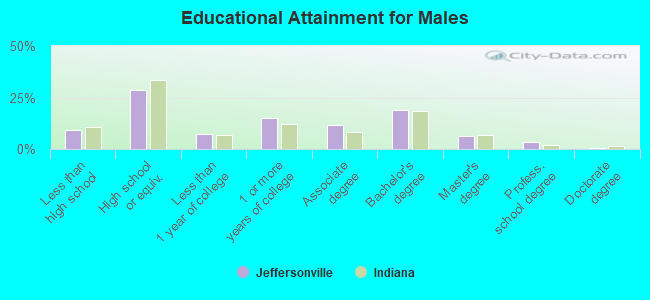
Education attainment for males 25 years and older:
- No schooling: 255
- Nursery to 4th grade: 11
- 5th and 6th grade: 23
- 7th and 8th grade: 178
- 9th grade: 85
- 10th grade: 322
- 11th grade: 225
- 12th grade, no diploma: 470
- High school graduate (or equivalency): 4,920
- Less than 1 year of college: 1,262
- Some college more than 1 year, no degree: 2,558
- Associate degree: 2,017
- Bachelor's degree: 3,222
- Master's degree: 1,044
- Professional school degree: 560
- Doctorate degree: 45
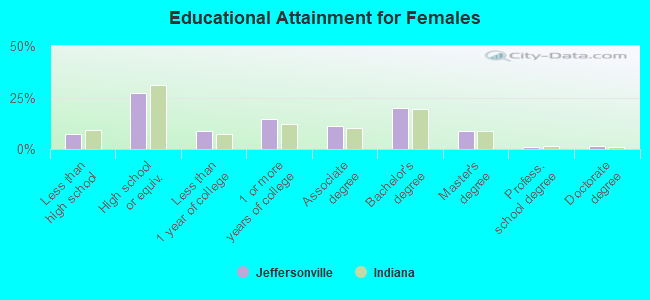
Education attainment for females 25 years and older:
- No schooling: 299
- Nursery to 4th grade: 0
- 5th and 6th grade: 4
- 7th and 8th grade: 56
- 9th grade: 151
- 10th grade: 193
- 11th grade: 492
- 12th grade, no diploma: 133
- High school graduate (or equivalency): 5,079
- Less than 1 year of college: 1,669
- Some college more than 1 year, no degree: 2,742
- Associate degree: 2,098
- Bachelor's degree: 3,748
- Master's degree: 1,639
- Professional school degree: 141
- Doctorate degree: 261
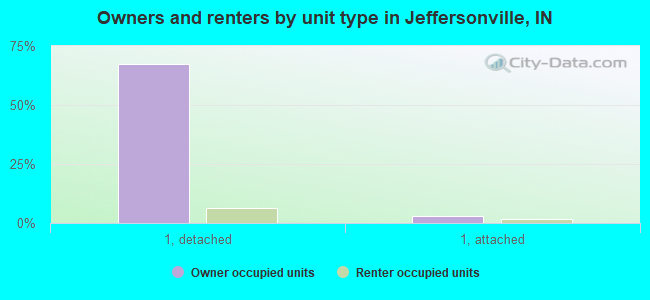
Housing units in structures:
- One, detached: 16,870
- One, attached: 1,672
- Two: 462
- 3 or 4: 1,045
- 5 to 9: 1,279
- 10 to 19: 815
- 20 to 49: 244
- 50 or more: 838
- Mobile homes: 591
Median worth of mobile homes: $21,231
Housing units lacking complete kitchen facilities in 2022: 1.5%
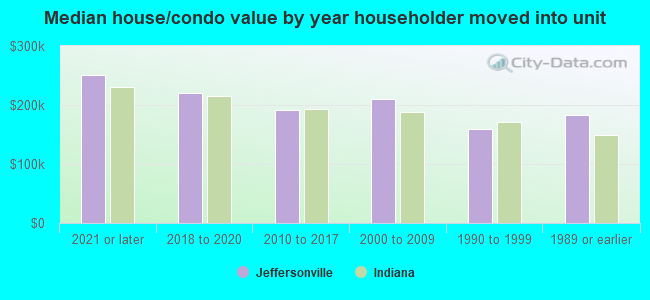
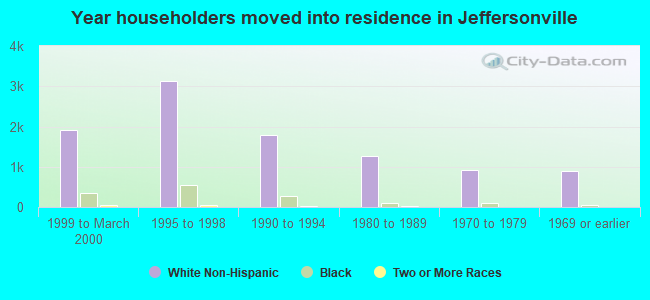
House/condo owner moved in on average 9 years ago
Renter moved in on average 1 years ago
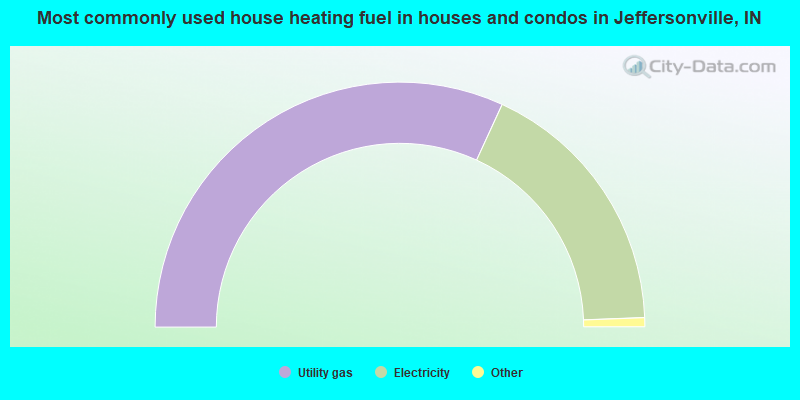
- 63.7%Utility gas
- 35.1%Electricity
- 1.0%Bottled, tank, or LP gas
- 0.2%Fuel oil, kerosene, etc.
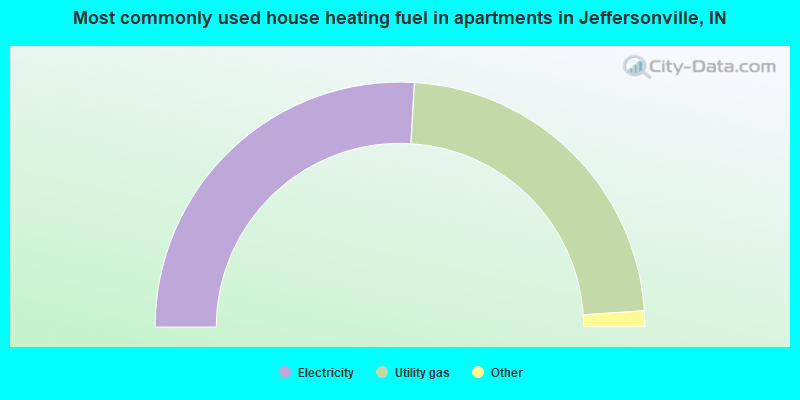
- 51.9%Electricity
- 46.0%Utility gas
- 0.9%Other fuel
- 0.6%Bottled, tank, or LP gas
- 0.6%No fuel used
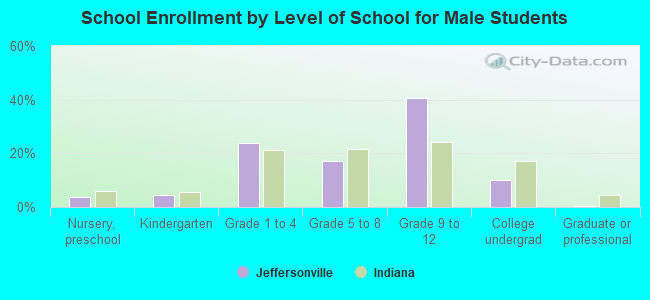
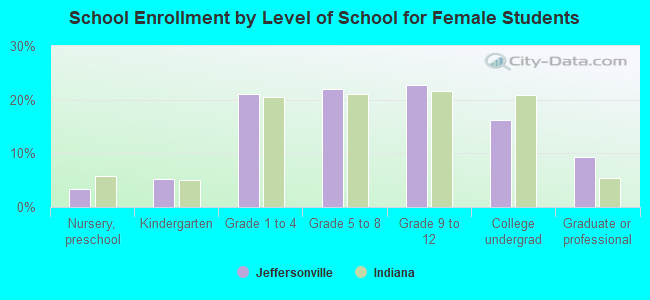
Private vs. public school enrollment:
| Here: | 20.6% |
| Indiana: | 14.9% |
| Here: | 20.0% |
| Indiana: | 11.4% |
| Here: | 14.5% |
| Indiana: | 22.3% |