Jenks, OK (Oklahoma) Houses and Residents
Estimated median house or condo value in 2022: $298,930 (it was $102,900 in 2000 )
Jenks:
$298,930Oklahoma:
$191,700
Lower value quartile - upper value quartile: $229,529 - $414,102Mean price in 2022: Detached houses: $389,182 Here:
$389,182State:
$255,409
Townhouses or other attached units: $320,860 Here:
$320,860State:
$206,466
Mobile homes: $78,818 Here:
$78,818State:
$110,804
Total population: 19,951 (Urban population: 8,781 (8,468 inside urbanized areas, 313 inside urban clusters ), Rural population: 666 (10 farm, 656 nonfarm ))
Houses: 9,466 (8,752 occupied: 7,001 owner occupied, 1,910 renter occupied )
% of renters here:
21%State:
35%
Housing density: 660 houses/condos per square mile
Median price asked for vacant for-sale houses and condos in 2022: $441,311.
Median contract rent in 2022: $1,189 (lower quartile is $919, upper quartile is $1,593)
Median rent asked for vacant for-rent units in 2022: $1,272
Median gross rent in Jenks, OK in 2022: $1,396
Housing units in Jenks with a mortgage: 4,932 (341 second mortgage, 0 home equity loan, 230 both second mortgage and home equity loan )Houses without a mortgage: 100
Median household income for houses/condos with a mortgage: $121,154
Median household income for apartments without a mortgage: $82,193
Median monthly housing costs: $1,560
Data:
Median house or condo value ($)
Median house or condo value ($ change since 2000)
Median house or condo value ($) - White
Median house or condo value ($) - Black or African American
Median house or condo value ($) - Asian
Median house or condo value ($) - Hispanic or Latino
Median house or condo value ($) - American Indian and Alaska Native
Median house or condo value ($) - Multirace
Median house or condo value ($) - Other Race
Median price asked for mobile homes ($)
Household density (households per square mile)
Mean house or condo value by units in structure - 1, detached ($)
Mean house or condo value by units in structure - 1, attached ($)
Mean house or condo value by units in structure - 2 ($)
Mean house or condo value by units in structure by units in structure - 3 or 4 ($)
Mean house or condo value by units in structure - 5 or more ($)
Mean house or condo value by units in structure - Boat, RV, van, etc. ($)
Mean house or condo value by units in structure - Mobile home ($)
Median contract rent ($)
Median contract rent - Lower quartile ($)
Median contract rent - Upper quartile ($)
Median gross rent ($)
Urban houses (%)
Rural houses (%)
Houses occupied (%)
Houses occupied (% change since 2000)
Houses owner occupied (%)
Houses owner occupied (% change since 2000)
Houses renter occupied (%)
Houses renter occupied (% change since 2000)
Vacant housing units - For rent (%)
Vacant housing units - For rent (% change since 2000)
Vacant housing units - For sale only (%)
Vacant housing units - For sale only (% change since 2000)
Vacant housing units - Rented or sold, not occupied (%)
Vacant housing units - Rented or sold, not occupied (% change since 2000)
Vacant housing units - For seasonal, recreational, or occasional use (%)
Vacant housing units - For seasonal, recreational, or occasional use (% change since 2000)
Vacant housing units - For migrant workers (%)
Vacant housing units - For migrant workers (% change since 2000)
Vacant housing units - Other vacant (%)
Vacant housing units - Other vacant (% change since 2000)
Median monthly housing costs ($)
Median household income for houses/condos with a mortgage ($)
Median household income for houses/condos without a mortgage ($)
Median household income ($)
Median household income ($) - White
Median household income ($) - Black or African American
Median household income ($) - Asian
Median household income ($) - Hispanic or Latino
Median household income ($) - American Indian and Alaska Native
Median household income ($) - Multirace
Median household income ($) - Other Race
Mortgage status - with mortgage (%)
Mortgage status - with second mortgage (%)
Mortgage status - with home equity loan (%)
Mortgage status - with both second mortgage and home equity loan (%)
Mortgage status - without a mortgage (%)
Median year house/condo built
Median year apartment built
Household type by relationship - Male householder living alone (%)
Household type by relationship - Male householder not living alone (%)
Household type by relationship - Female householder living alone (%)
Household type by relationship - Female householder not living alone (%)
Household type by relationship - Opposite-Sex spouse (%)
Household type by relationship - Same-Sex spouse (%)
Household type by relationship - Opposite-Sex unmarried partner (%)
Household type by relationship - Same-Sex unmarried partner (%)
Household type by relationship - In group quarters (%)
Size of family households - 2-person household (%)
Size of family households - 3-person household (%)
Size of family households - 4-person household (%)
Size of family households - 5-person household (%)
Size of family households - 6-person household (%)
Size of family households - 7-or-more-person household (%)
Size of nonfamily households - 1-person household (%)
Size of nonfamily households - 2-person household (%)
Size of nonfamily households - 3-person household (%)
Size of nonfamily households - 4-person household (%)
Size of nonfamily households - 5-person household (%)
Size of nonfamily households - 6-person household (%)
Size of nonfamily households - 7-or-moreperson household (%)
Year house built - Built 2010 or later (%)
Year house built - Built 2000 to 2009 (%)
Year house built - Built 1990 to 1999 (%)
Year house built - Built 1980 to 1989 (%)
Year house built - Built 1970 to 1979 (%)
Year house built - Built 1960 to 1969 (%)
Year house built - Built 1950 to 1959 (%)
Year house built - Built 1940 to 1949 (%)
Year house built - Built 1939 or earlier (%)
Median number of rooms in houses and condos
Median number of rooms in apartments
Median number of bedrooms in owner occupied houses
Mean number of bedrooms in owner occupied houses
Median number of bedrooms in renter occupied houses
Mean number of bedrooms in renter occupied houses
Median number of vehichles in owner occupied houses
Mean number of vehichles in owner occupied houses
Median number of vehichles in renter occupied houses
Mean number of vehichles in renter occupied houses
Rooms in owner-occupied houses - 1 room (%)
Rooms in owner-occupied houses - 2 rooms (%)
Rooms in owner-occupied houses - 3 rooms (%)
Rooms in owner-occupied houses - 4 rooms (%)
Rooms in owner-occupied houses - 5 rooms (%)
Rooms in owner-occupied houses - 6 rooms (%)
Rooms in owner-occupied houses - 7 rooms (%)
Rooms in owner-occupied houses - 8 rooms (%)
Rooms in owner-occupied houses - 9+ rooms (%)
Rooms in renter-occupied houses - 1 room (%)
Rooms in renter-occupied houses - 2 rooms (%)
Rooms in renter-occupied houses - 3 rooms (%)
Rooms in renter-occupied houses - 4 rooms (%)
Rooms in renter-occupied houses - 5 rooms (%)
Rooms in renter-occupied houses - 6 rooms (%)
Rooms in renter-occupied houses - 7 rooms (%)
Rooms in renter-occupied houses - 8 rooms (%)
Rooms in renter-occupied houses - 9+ rooms (%)
Bedrooms in owner-occupied houses - no bedrooms (%)
Bedrooms in owner-occupied houses - 1 bedroom (%)
Bedrooms in owner-occupied houses - 2 bedrooms (%)
Bedrooms in owner-occupied houses - 3 bedrooms (%)
Bedrooms in owner-occupied houses - 4 bedrooms (%)
Bedrooms in owner-occupied houses - 5+ bedrooms (%)
Bedrooms in renter-occupied houses - no bedrooms (%)
Bedrooms in renter-occupied houses - 1 bedroom (%)
Bedrooms in renter-occupied houses - 2 bedrooms (%)
Bedrooms in renter-occupied houses - 3 bedrooms (%)
Bedrooms in renter-occupied houses - 4 bedrooms (%)
Bedrooms in renter-occupied houses - 5+ bedrooms (%)
Vehicles available in owner-occupied houses - no vehicle available (%)
Vehicles available in owner-occupied houses - 1 vehicle available(%)
Vehicles available in owner-occupied houses - 2 Vehicles available (%)
Vehicles available in owner-occupied houses - 3 Vehicles available (%)
Vehicles available in owner-occupied houses - 4 Vehicles available (%)
Vehicles available in owner-occupied houses - 5+ Vehicles available (%)
Vehicles available in renter-occupied houses - no vehicle available (%)
Vehicles available in renter-occupied houses - 1 vehicle available (%)
Vehicles available in renter-occupied houses - 2 Vehicles available (%)
Vehicles available in renter-occupied houses - 3 Vehicles available (%)
Vehicles available in renter-occupied houses - 4 Vehicles available (%)
Vehicles available in renter-occupied houses - 5+ Vehicles available (%)
Housing units in structures - 1, detached (%)
Housing units in structures - 1, attached (%)
Housing units in structures - 2 (%)
Housing units in structures - 3 or 4 (%)
Housing units in structures - 5 to 9 (%)
Housing units in structures - 10 to 19 (%)
Housing units in structures - 20 to 49 (%)
Housing units in structures - 50 or more (%)
Housing units in structures - Mobile home (%)
Housing units in structures - Boat, RV, van, etc. (%)
Housing units in structures - Owners - 1, detached (%)
Housing units in structures - Owners - 1, attached (%)
Housing units in structures - Owners - 2 (%)
Housing units in structures - Owners - 3 or 4 (%)
Housing units in structures - Owners - 5 to 9 (%)
Housing units in structures - Owners - 10 to 19 (%)
Housing units in structures - Owners - 20 to 49 (%)
Housing units in structures - Owners - 50 or more (%)
Housing units in structures - Owners - Mobile home (%)
Housing units in structures - Owners - Boat, RV, van, etc. (%)
Housing units in structures - Renters - 1, detached (%)
Housing units in structures - Renters - 1, attached (%)
Housing units in structures - Renters - 2 (%)
Housing units in structures - Renters - 3 or 4 (%)
Housing units in structures - Renters - 5 to 9 (%)
Housing units in structures - Renters - 10 to 19 (%)
Housing units in structures - Renters - 20 to 49 (%)
Housing units in structures - Renters - 50 or more (%)
Housing units in structures - Renters - Mobile home (%)
Housing units in structures - Renters - Boat, RV, van, etc. (%)
House/condo owner moved in on average (years ago)
Renter moved in on average (years ago)
Year householder moved into unit - Moved in 1999 to March 2000 (%)
Year householder moved into unit - Moved in 1999 to March 2000 (%) - White
Year householder moved into unit - Moved in 1999 to March 2000 (%) - Black or African American
Year householder moved into unit - Moved in 1999 to March 2000 (%) - Asian
Year householder moved into unit - Moved in 1999 to March 2000 (%) - Hispanic or Latino
Year householder moved into unit - Moved in 1999 to March 2000 (%) - American Indian and Alaska Native
Year householder moved into unit - Moved in 1999 to March 2000 (%) - Multirace
Year householder moved into unit - Moved in 1999 to March 2000 (%) - Other Race
Year householder moved into unit - Moved in 1995 to 1998 (%)
Year householder moved into unit - Moved in 1995 to 1998 (%) - White
Year householder moved into unit - Moved in 1995 to 1998 (%) - Black or African American
Year householder moved into unit - Moved in 1995 to 1998 (%) - Asian
Year householder moved into unit - Moved in 1995 to 1998 (%) - Hispanic or Latino
Year householder moved into unit - Moved in 1995 to 1998 (%) - American Indian and Alaska Native
Year householder moved into unit - Moved in 1995 to 1998 (%) - Multirace
Year householder moved into unit - Moved in 1995 to 1998 (%) - Other Race
Year householder moved into unit - Moved in 1990 to 1994 (%)
Year householder moved into unit - Moved in 1990 to 1994 (%) - White
Year householder moved into unit - Moved in 1990 to 1994 (%) - Black or African American
Year householder moved into unit - Moved in 1990 to 1994 (%) - Asian
Year householder moved into unit - Moved in 1990 to 1994 (%) - Hispanic or Latino
Year householder moved into unit - Moved in 1990 to 1994 (%) - American Indian and Alaska Native
Year householder moved into unit - Moved in 1990 to 1994 (%) - Multirace
Year householder moved into unit - Moved in 1990 to 1994 (%) - Other Race
Year householder moved into unit - Moved in 1980 to 1989 (%)
Year householder moved into unit - Moved in 1980 to 1989 (%) - White
Year householder moved into unit - Moved in 1980 to 1989 (%) - Black or African American
Year householder moved into unit - Moved in 1980 to 1989 (%) - Asian
Year householder moved into unit - Moved in 1980 to 1989 (%) - Hispanic or Latino
Year householder moved into unit - Moved in 1980 to 1989 (%) - American Indian and Alaska Native
Year householder moved into unit - Moved in 1980 to 1989 (%) - Multirace
Year householder moved into unit - Moved in 1980 to 1989 (%) - Other Race
Year householder moved into unit - Moved in 1970 to 1979 (%)
Year householder moved into unit - Moved in 1970 to 1979 (%) - White
Year householder moved into unit - Moved in 1970 to 1979 (%) - Black or African American
Year householder moved into unit - Moved in 1970 to 1979 (%) - Asian
Year householder moved into unit - Moved in 1970 to 1979 (%) - Hispanic or Latino
Year householder moved into unit - Moved in 1970 to 1979 (%) - American Indian and Alaska Native
Year householder moved into unit - Moved in 1970 to 1979 (%) - Multirace
Year householder moved into unit - Moved in 1970 to 1979 (%) - Other Race
Year householder moved into unit - Moved in 1969 or earlier (%)
Year householder moved into unit - Moved in 1969 or earlier (%) - White
Year householder moved into unit - Moved in 1969 or earlier (%) - Black or African American
Year householder moved into unit - Moved in 1969 or earlier (%) - Asian
Year householder moved into unit - Moved in 1969 or earlier (%) - Hispanic or Latino
Year householder moved into unit - Moved in 1969 or earlier (%) - American Indian and Alaska Native
Year householder moved into unit - Moved in 1969 or earlier (%) - Multirace
Year householder moved into unit - Moved in 1969 or earlier (%) - Other Race
Housing units lacking complete plumbing facilities (%)
Housing units lacking complete kitchen facilities (%)
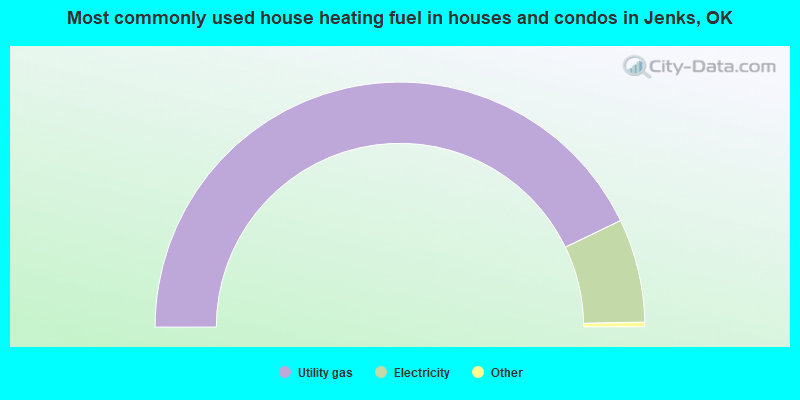
House heating fuel used in houses and condos - Utility gas (%)
House heating fuel used in houses and condos - Bottled, tank, or LP gas (%)
House heating fuel used in houses and condos - Electricity (%)
House heating fuel used in houses and condos - Fuel oil, kerosene, etc. (%)
House heating fuel used in houses and condos - Coal or coke (%)
House heating fuel used in houses and condos - Wood (%)
House heating fuel used in houses and condos - Solar energy (%)
House heating fuel used in houses and condos - Other fuel (%)
House heating fuel used in houses and condos - No fuel used (%)
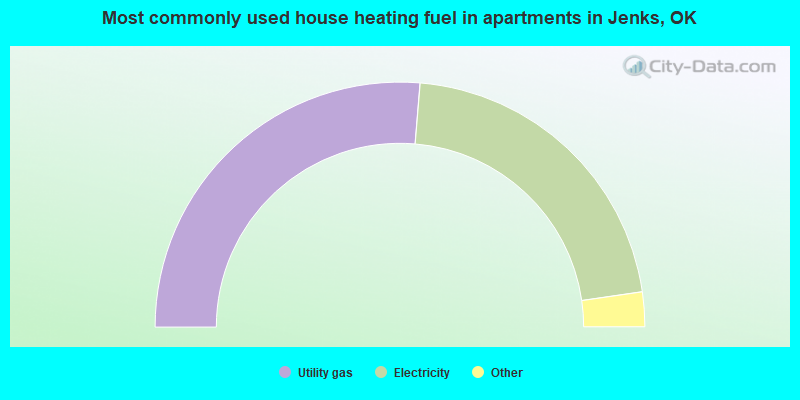
House heating fuel used in apartments - Utility gas (%)
House heating fuel used in apartments - Bottled, tank, or LP gas (%)
House heating fuel used in apartments - Electricity (%)
House heating fuel used in apartments - Fuel oil, kerosene, etc. (%)
House heating fuel used in apartments - Coal or coke (%)
House heating fuel used in apartments - Wood (%)
House heating fuel used in apartments - Solar energy (%)
House heating fuel used in apartments - Other fuel (%)
House heating fuel used in apartments - No fuel used (%)
Latest news about housing in Jenks, OK collected exclusively by city-data.com from local newspapers, TV, and radio stations
Median year house/condo built: 2005Median year apartment built: 2005Household type by relationship:
Households: 26,198
Male householders: 4,584 (375 living alone ), Female householders: 4,130 (1,128 living alone )5,684 spouses (5,663 opposite-sex spouses ), 233 unmarried partners , (218 opposite-sex unmarried partners ), 9,958 children (9,218 natural , 257 adopted , 482 stepchildren ), 263 grandchildren , 169 brothers or sisters , 286 parents , 0 foster children , 224 other relatives , 567 non-relatives In group quarters: 96
Size of family households: 2,634 2-persons , 1,408 3-persons , 1,754 4-persons , 779 5-persons , 327 6-persons , 157 7-or-more-persons .
Size of nonfamily households: 1,524 1-person , 136 2-persons , 57 3-persons , 12 4-persons , 17 7-or-more-persons .
6,725 married couples with children. single-parent households (401 men , 784 women ).
86.7% of residents of Jenks speak English at home. of residents speak Spanish at home (73% speak English very well , 21% speak English well , 7% speak English not well ).of residents speak other Indo-European language at home (83% speak English very well , 6% speak English well , 12% speak English not well ).of residents speak Asian or Pacific Island language at home (45% speak English very well , 25% speak English well , 24% speak English not well , 7% don't speak English at all ).of residents speak other language at home (74% speak English very well , 26% speak English well ).
Foreign born population: 2,328 (8.9%)of them are naturalized citizens )
Median number of rooms in houses and condos:
Median number of rooms in apartments
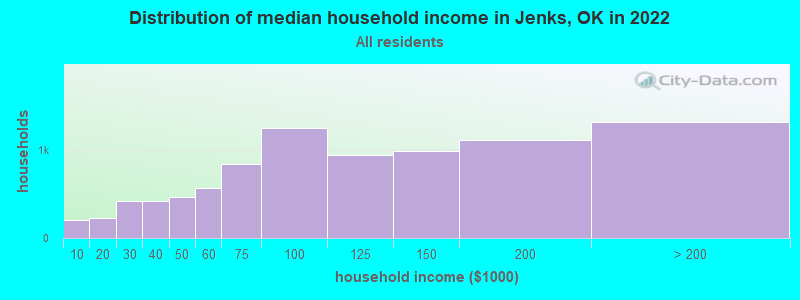
Jenks, OK household income distribution 206 Less than $10,000231 $10,000 to $19,999417 $20,000 to $29,999424 $30,000 to $39,999469 $40,000 to $49,999568 $50,000 to $59,999839 $60,000 to $74,9991,257 $75,000 to $99,999949 $100,000 to $124,999996 $125,000 to $149,9991,115 $150,000 to $199,9991,324 $200,000 or more
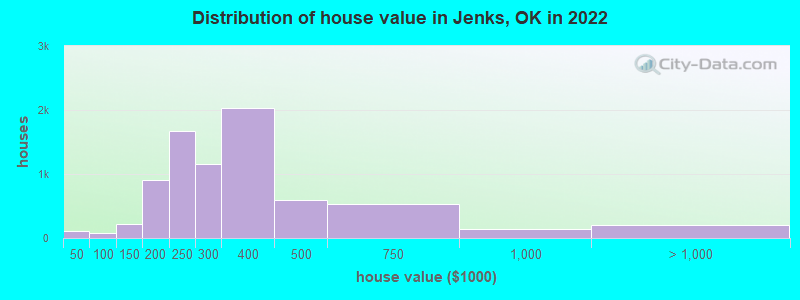
Home value of owner - occupied houses in 2022 in Jenks, OK 70 Less than $10,00010 $15,000 to $19,9990 $20,000 to $24,99919 $25,000 to $29,99910 $40,000 to $49,99915 $50,000 to $59,99926 $80,000 to $89,99927 $90,000 to $99,999129 $100,000 to $124,99985 $125,000 to $149,999333 $150,000 to $174,999579 $175,000 to $199,9991,673 $200,000 to $249,9991,162 $250,000 to $299,9992,027 $300,000 to $399,999599 $400,000 to $499,999534 $500,000 to $749,999146 $750,000 to $999,99966 $1,000,000 to $1,499,99912 $1,500,000 to $1,999,999119 $2,000,000 or moreRent paid by renters in 2022 in Jenks, OK 10 $300 to $34979 $550 to $59917 $600 to $64994 $650 to $69931 $700 to $74936 $750 to $799168 $800 to $899229 $900 to $999317 $1,000 to $1,249372 $1,250 to $1,499318 $1,500 to $1,999119 $2,000 to $2,499101 No cash rent
Percentage of workers working in this county: 91.2%Number of people working at home: 1,781 (14.1% of all workers )
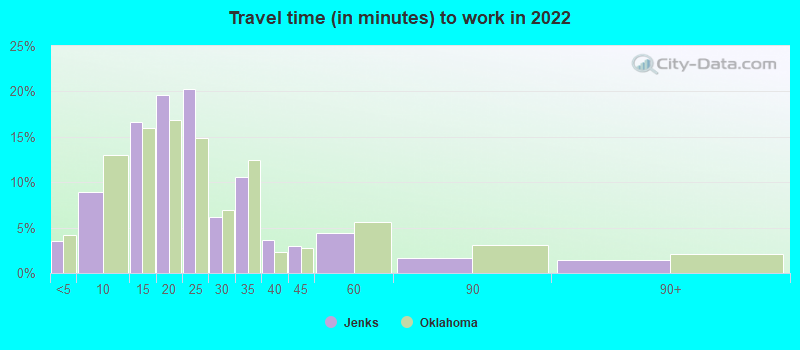
Travel time to work (commute)
Less than 5 minutes: 2905 to 9 minutes: 73810 to 14 minutes: 1,14815 to 19 minutes: 2,22520 to 24 minutes: 2,80925 to 29 minutes: 1,33530 to 34 minutes: 1,59435 to 39 minutes: 23340 to 44 minutes: 10345 to 59 minutes: 18260 to 89 minutes: 6090 or more minutes: 72
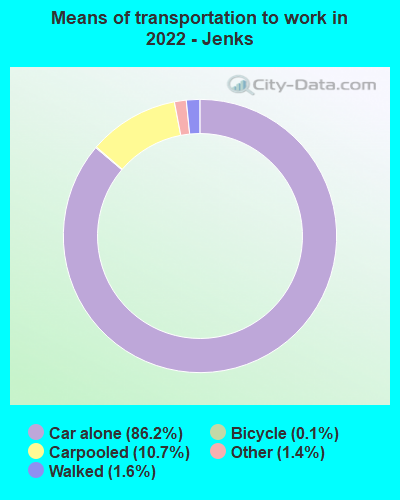
Means of transportation to work:
Drove a car alone: 6,135 (70.5%)Carpooled: 785 (9.0%)Taxi: 86 (1.0%)Bicycle: 15 (0.2%)Walked: 123 (1.4%)Worked at home: 1,781 (20.5%)
Unemployment by race in 2022
Unemployment rate for White non-Hispanic residents 2.9% Males2.6% FemalesUnemployment rate for Black residents 15.9% FemalesUnemployment rate for American Indian and Alaska Native residents 1.1% Males11.0% FemalesUnemployment rate for Asian residents 6.7% Males5.0% FemalesUnemployment rate for two or more race residents 0.5% Males2.8% FemalesUnemployment rate for Hispanic or Latino residents 2.8% Males3.7% Females
Year of entry for the foreign-born population in Jenks, Oklahoma
1,628 2010 or later 373 2000 to 2009 295 1990 to 1999 107 1980 to 1989 18 1970 to 1979 43 Before 1970
First ancestries reported:
English: 1,779 (15.2%)
German: 1,229 (10.5%)
American: 1,064 (9.1%)
Irish: 799 (6.8%)
European: 451 (3.9%)
Scottish: 172 (1.5%)
Swedish: 164 (1.4%)
Italian: 100 (0.9%)
French: 91 (0.8%)
Lebanese: 76 (0.7%)
Dutch: 75 (0.6%)
British: 71 (0.6%)
Welsh: 68 (0.6%)
Polish: 67 (0.6%)
Czech: 59 (0.5%)
Scotch-Irish: 55 (0.5%)
Russian: 51 (0.4%)
Greek: 40 (0.3%)
Scandinavian: 35 (0.3%)
French Canadian: 30 (0.3%)
Northern European: 29 (0.2%)
Syrian: 28 (0.2%)
Lithuanian: 25 (0.2%)
Danish: 23 (0.2%)
Norwegian: 21 (0.2%)
Ukrainian: 20 (0.2%)
West Indian: 19 (0.2%)
Hungarian: 16 (0.1%)
British West Indian: 12 (0.1%)
Zimbabwean: 11 (0.09%)
Canadian: 10 (0.09%)
Eastern European: 10 (0.09%)
African: 8 (0.07%)
Pennsylvania German: 7 (0.06%)
Cajun: 3 (0.03%) Most common places of birth for foreign-born residents (%): Burma (Myanmar) Jenks:
29.5% (655)Oklahoma:
1.7% (4,135)
India Jenks:
9.8% (217)Oklahoma:
4.1% (10,034)
Mexico Jenks:
8.2% (183)Oklahoma:
42.4% (103,425)
China, excluding Hong Kong and Taiwan Jenks:
4.8% (107)Oklahoma:
3.2% (7,698)
Malaysia Jenks:
4.5% (100)Oklahoma:
0.4% (1,083)
Pakistan Jenks:
3.9% (86)Oklahoma:
0.8% (1,923)
Argentina Jenks:
3.2% (70)Oklahoma:
0.3% (719)
England Jenks:
3.1% (68)Oklahoma:
0.8% (1,922)
Vietnam Jenks:
2.6% (58)Oklahoma:
5.6% (13,699)
Canada Jenks:
2.1% (47)Oklahoma:
2.0% (4,771)
Bangladesh Jenks:
1.9% (43)Oklahoma:
0.5% (1,320)
Guatemala Jenks:
1.8% (39)Oklahoma:
4.2% (10,287)
Czechoslovakia (includes Czech Republic and Slovakia) Jenks:
1.7% (37)Oklahoma:
0.1% (187)
Philippines Jenks:
1.6% (35)Oklahoma:
2.3% (5,671)
Place of birth for U.S.-born residents:
This state: 15,124Other state: 8,170Northeast: 528Midwest: 2,771South: 3,191West: 1,662 85.7% of Jenks residents lived in the same house 1 years ago.
Out of people who lived in different houses, 37.7% lived in this county.
Out of people who lived in different counties, 77.9% lived in Oklahoma.
Jenks:
85.7%State average:
85.5%
Education attainment for males 25 years and older:
No schooling: 168Nursery to 4th grade: 485th and 6th grade: 07th and 8th grade: 149th grade: 8310th grade: 9311th grade: 6212th grade, no diploma: 85High school graduate (or equivalency): 1,487Less than 1 year of college: 513Some college more than 1 year, no degree: 704Associate degree: 905Bachelor's degree: 2,270Master's degree: 1,104Professional school degree: 156Doctorate degree: 144
Education attainment for females 25 years and older:
No schooling: 296Nursery to 4th grade: 475th and 6th grade: 297th and 8th grade: 509th grade: 4610th grade: 6011th grade: 3912th grade, no diploma: 29High school graduate (or equivalency): 1,276Less than 1 year of college: 492Some college more than 1 year, no degree: 922Associate degree: 922Bachelor's degree: 2,651Master's degree: 988Professional school degree: 206Doctorate degree: 188
Housing units in structures:
One, detached: 8,296One, attached: 173Two: 153 or 4: 265 to 9: 22010 to 19: 12020 to 49: 21450 or more: 325Mobile homes: 73Median worth of mobile homes: $54,938
Housing units lacking complete plumbing facilities in 2022: 0.5%Housing units lacking complete kitchen facilities in 2022: 1.0%House/condo owner moved in on average 7 years ago
Renter moved in on average 1 years ago
Private vs. public school enrollment:
Students in private schools in grades 1 to 8 (elementary and middle school): 576 Students in private schools in grades 9 to 12 (high school): 181 Students in private undergraduate colleges: 424