Jersey City, NJ (New Jersey) Houses and Residents
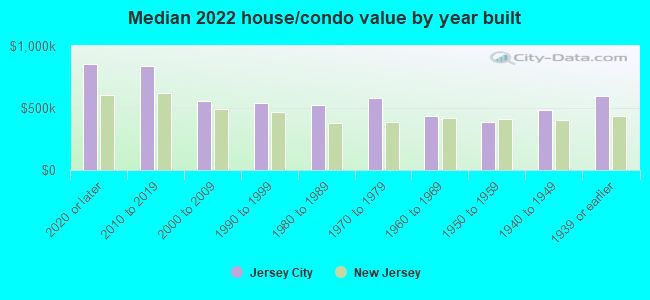
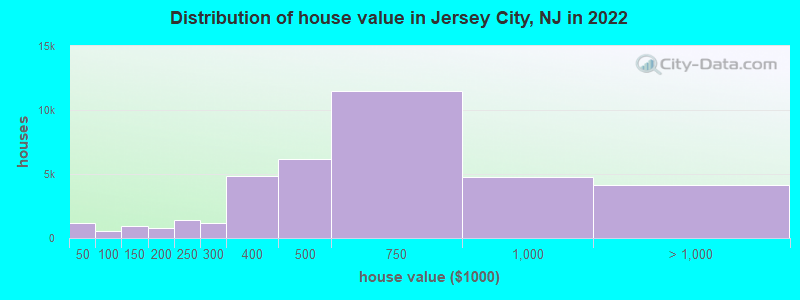
Estimated median house or condo value in 2022: $559,700 (it was $137,900 in 2000 )
Jersey City:
$559,700New Jersey:
$428,900
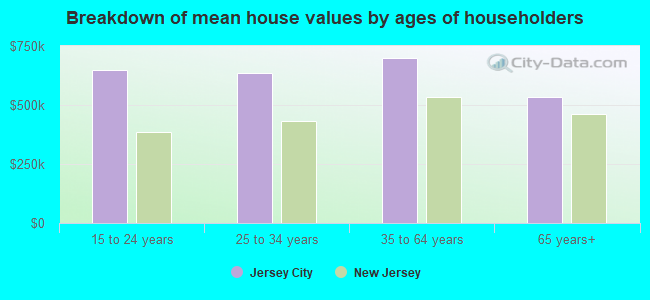
Lower value quartile - upper value quartile: $383,000 - $791,200Mean price in 2022: Detached houses: $732,576 Here:
$732,576State:
$537,591
Townhouses or other attached units: $695,567 Here:
$695,567State:
$381,113
In 2-unit structures: $571,976 Here:
$571,976State:
$444,476
In 3-to-4-unit structures: $581,467 Here:
$581,467State:
$457,463
In 5-or-more-unit structures: $666,445 Here:
$666,445State:
$368,745
Total population: 262,146 (Urban population: 240,055, Rural population: 0)
Houses: 135,927 (130,213 occupied: 38,827 owner occupied, 91,386 renter occupied )
% of renters here:
70%State:
35%
Housing density: 9,113 houses/condos per square mile
Median price asked for vacant for-sale houses and condos in 2022: $1,310,841.
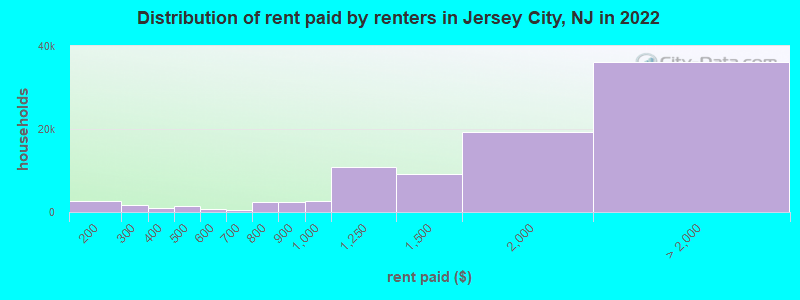
Median contract rent in 2022: $1,738 (lower quartile is $1,153, upper quartile is over $2,000)
Median rent asked for vacant for-rent units in 2022: $1,361
Median gross rent in Jersey City, NJ in 2022: $1,832
Housing units in Jersey City with a mortgage: 26,947 (2,534 second mortgage, 213 home equity loan, 1,802 both second mortgage and home equity loan )Houses without a mortgage: 313
Median household income for houses/condos with a mortgage: $150,228
Median household income for apartments without a mortgage: $100,964
Median monthly housing costs: $1,905
Data:
Median house or condo value ($)
Median house or condo value ($ change since 2000)
Median house or condo value ($) - White
Median house or condo value ($) - Black or African American
Median house or condo value ($) - Asian
Median house or condo value ($) - Hispanic or Latino
Median house or condo value ($) - American Indian and Alaska Native
Median house or condo value ($) - Multirace
Median house or condo value ($) - Other Race
Median price asked for mobile homes ($)
Household density (households per square mile)
Mean house or condo value by units in structure - 1, detached ($)
Mean house or condo value by units in structure - 1, attached ($)
Mean house or condo value by units in structure - 2 ($)
Mean house or condo value by units in structure by units in structure - 3 or 4 ($)
Mean house or condo value by units in structure - 5 or more ($)
Mean house or condo value by units in structure - Boat, RV, van, etc. ($)
Mean house or condo value by units in structure - Mobile home ($)
Median contract rent ($)
Median contract rent - Lower quartile ($)
Median contract rent - Upper quartile ($)
Median gross rent ($)
Urban houses (%)
Rural houses (%)
Houses occupied (%)
Houses occupied (% change since 2000)
Houses owner occupied (%)
Houses owner occupied (% change since 2000)
Houses renter occupied (%)
Houses renter occupied (% change since 2000)
Vacant housing units - For rent (%)
Vacant housing units - For rent (% change since 2000)
Vacant housing units - For sale only (%)
Vacant housing units - For sale only (% change since 2000)
Vacant housing units - Rented or sold, not occupied (%)
Vacant housing units - Rented or sold, not occupied (% change since 2000)
Vacant housing units - For seasonal, recreational, or occasional use (%)
Vacant housing units - For seasonal, recreational, or occasional use (% change since 2000)
Vacant housing units - For migrant workers (%)
Vacant housing units - For migrant workers (% change since 2000)
Vacant housing units - Other vacant (%)
Vacant housing units - Other vacant (% change since 2000)
Median monthly housing costs ($)
Median household income for houses/condos with a mortgage ($)
Median household income for houses/condos without a mortgage ($)
Median household income ($)
Median household income ($) - White
Median household income ($) - Black or African American
Median household income ($) - Asian
Median household income ($) - Hispanic or Latino
Median household income ($) - American Indian and Alaska Native
Median household income ($) - Multirace
Median household income ($) - Other Race
Mortgage status - with mortgage (%)
Mortgage status - with second mortgage (%)
Mortgage status - with home equity loan (%)
Mortgage status - with both second mortgage and home equity loan (%)
Mortgage status - without a mortgage (%)
Median year house/condo built
Median year apartment built
Household type by relationship - Male householder living alone (%)
Household type by relationship - Male householder not living alone (%)
Household type by relationship - Female householder living alone (%)
Household type by relationship - Female householder not living alone (%)
Household type by relationship - Opposite-Sex spouse (%)
Household type by relationship - Same-Sex spouse (%)
Household type by relationship - Opposite-Sex unmarried partner (%)
Household type by relationship - Same-Sex unmarried partner (%)
Household type by relationship - In group quarters (%)
Size of family households - 2-person household (%)
Size of family households - 3-person household (%)
Size of family households - 4-person household (%)
Size of family households - 5-person household (%)
Size of family households - 6-person household (%)
Size of family households - 7-or-more-person household (%)
Size of nonfamily households - 1-person household (%)
Size of nonfamily households - 2-person household (%)
Size of nonfamily households - 3-person household (%)
Size of nonfamily households - 4-person household (%)
Size of nonfamily households - 5-person household (%)
Size of nonfamily households - 6-person household (%)
Size of nonfamily households - 7-or-moreperson household (%)
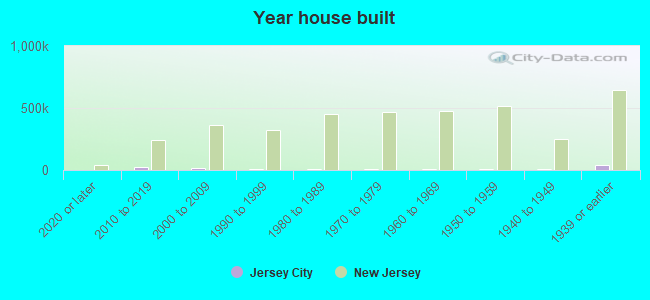
Year house built - Built 2010 or later (%)
Year house built - Built 2000 to 2009 (%)
Year house built - Built 1990 to 1999 (%)
Year house built - Built 1980 to 1989 (%)
Year house built - Built 1970 to 1979 (%)
Year house built - Built 1960 to 1969 (%)
Year house built - Built 1950 to 1959 (%)
Year house built - Built 1940 to 1949 (%)
Year house built - Built 1939 or earlier (%)
Median number of rooms in houses and condos
Median number of rooms in apartments
Median number of bedrooms in owner occupied houses
Mean number of bedrooms in owner occupied houses
Median number of bedrooms in renter occupied houses
Mean number of bedrooms in renter occupied houses
Median number of vehichles in owner occupied houses
Mean number of vehichles in owner occupied houses
Median number of vehichles in renter occupied houses
Mean number of vehichles in renter occupied houses
Rooms in owner-occupied houses - 1 room (%)
Rooms in owner-occupied houses - 2 rooms (%)
Rooms in owner-occupied houses - 3 rooms (%)
Rooms in owner-occupied houses - 4 rooms (%)
Rooms in owner-occupied houses - 5 rooms (%)
Rooms in owner-occupied houses - 6 rooms (%)
Rooms in owner-occupied houses - 7 rooms (%)
Rooms in owner-occupied houses - 8 rooms (%)
Rooms in owner-occupied houses - 9+ rooms (%)
Rooms in renter-occupied houses - 1 room (%)
Rooms in renter-occupied houses - 2 rooms (%)
Rooms in renter-occupied houses - 3 rooms (%)
Rooms in renter-occupied houses - 4 rooms (%)
Rooms in renter-occupied houses - 5 rooms (%)
Rooms in renter-occupied houses - 6 rooms (%)
Rooms in renter-occupied houses - 7 rooms (%)
Rooms in renter-occupied houses - 8 rooms (%)
Rooms in renter-occupied houses - 9+ rooms (%)
Bedrooms in owner-occupied houses - no bedrooms (%)
Bedrooms in owner-occupied houses - 1 bedroom (%)
Bedrooms in owner-occupied houses - 2 bedrooms (%)
Bedrooms in owner-occupied houses - 3 bedrooms (%)
Bedrooms in owner-occupied houses - 4 bedrooms (%)
Bedrooms in owner-occupied houses - 5+ bedrooms (%)
Bedrooms in renter-occupied houses - no bedrooms (%)
Bedrooms in renter-occupied houses - 1 bedroom (%)
Bedrooms in renter-occupied houses - 2 bedrooms (%)
Bedrooms in renter-occupied houses - 3 bedrooms (%)
Bedrooms in renter-occupied houses - 4 bedrooms (%)
Bedrooms in renter-occupied houses - 5+ bedrooms (%)
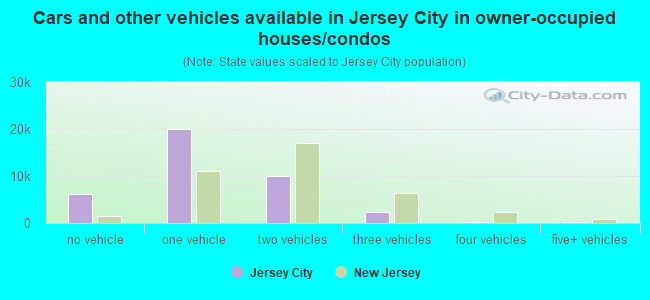
Vehicles available in owner-occupied houses - no vehicle available (%)
Vehicles available in owner-occupied houses - 1 vehicle available(%)
Vehicles available in owner-occupied houses - 2 Vehicles available (%)
Vehicles available in owner-occupied houses - 3 Vehicles available (%)
Vehicles available in owner-occupied houses - 4 Vehicles available (%)
Vehicles available in owner-occupied houses - 5+ Vehicles available (%)
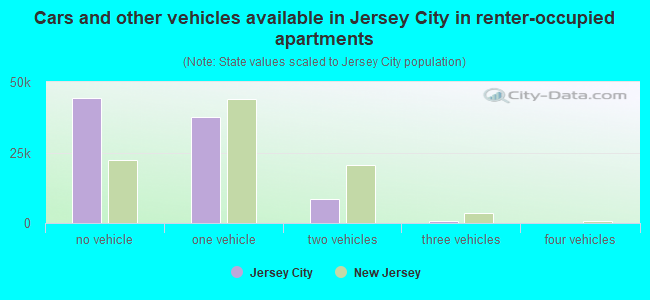
Vehicles available in renter-occupied houses - no vehicle available (%)
Vehicles available in renter-occupied houses - 1 vehicle available (%)
Vehicles available in renter-occupied houses - 2 Vehicles available (%)
Vehicles available in renter-occupied houses - 3 Vehicles available (%)
Vehicles available in renter-occupied houses - 4 Vehicles available (%)
Vehicles available in renter-occupied houses - 5+ Vehicles available (%)
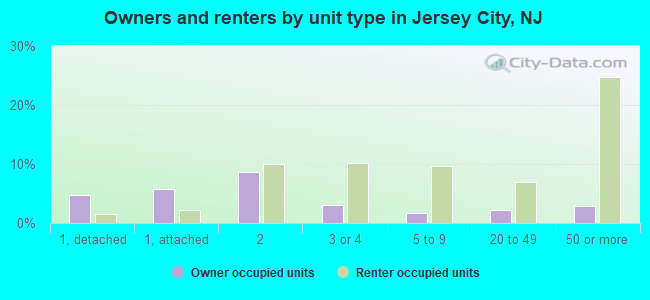
Housing units in structures - 1, detached (%)
Housing units in structures - 1, attached (%)
Housing units in structures - 2 (%)
Housing units in structures - 3 or 4 (%)
Housing units in structures - 5 to 9 (%)
Housing units in structures - 10 to 19 (%)
Housing units in structures - 20 to 49 (%)
Housing units in structures - 50 or more (%)
Housing units in structures - Mobile home (%)
Housing units in structures - Boat, RV, van, etc. (%)
Housing units in structures - Owners - 1, detached (%)
Housing units in structures - Owners - 1, attached (%)
Housing units in structures - Owners - 2 (%)
Housing units in structures - Owners - 3 or 4 (%)
Housing units in structures - Owners - 5 to 9 (%)
Housing units in structures - Owners - 10 to 19 (%)
Housing units in structures - Owners - 20 to 49 (%)
Housing units in structures - Owners - 50 or more (%)
Housing units in structures - Owners - Mobile home (%)
Housing units in structures - Owners - Boat, RV, van, etc. (%)
Housing units in structures - Renters - 1, detached (%)
Housing units in structures - Renters - 1, attached (%)
Housing units in structures - Renters - 2 (%)
Housing units in structures - Renters - 3 or 4 (%)
Housing units in structures - Renters - 5 to 9 (%)
Housing units in structures - Renters - 10 to 19 (%)
Housing units in structures - Renters - 20 to 49 (%)
Housing units in structures - Renters - 50 or more (%)
Housing units in structures - Renters - Mobile home (%)
Housing units in structures - Renters - Boat, RV, van, etc. (%)
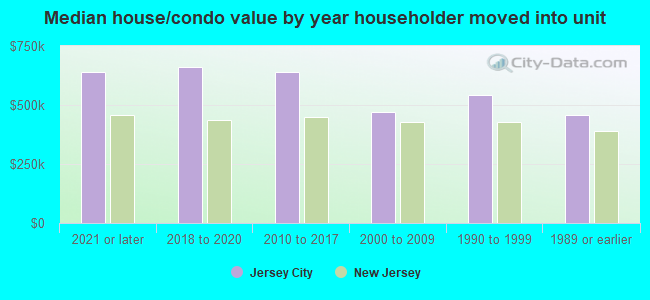
House/condo owner moved in on average (years ago)
Renter moved in on average (years ago)
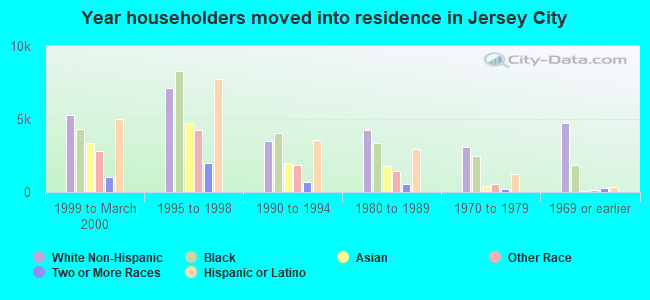
Year householder moved into unit - Moved in 1999 to March 2000 (%)
Year householder moved into unit - Moved in 1999 to March 2000 (%) - White
Year householder moved into unit - Moved in 1999 to March 2000 (%) - Black or African American
Year householder moved into unit - Moved in 1999 to March 2000 (%) - Asian
Year householder moved into unit - Moved in 1999 to March 2000 (%) - Hispanic or Latino
Year householder moved into unit - Moved in 1999 to March 2000 (%) - American Indian and Alaska Native
Year householder moved into unit - Moved in 1999 to March 2000 (%) - Multirace
Year householder moved into unit - Moved in 1999 to March 2000 (%) - Other Race
Year householder moved into unit - Moved in 1995 to 1998 (%)
Year householder moved into unit - Moved in 1995 to 1998 (%) - White
Year householder moved into unit - Moved in 1995 to 1998 (%) - Black or African American
Year householder moved into unit - Moved in 1995 to 1998 (%) - Asian
Year householder moved into unit - Moved in 1995 to 1998 (%) - Hispanic or Latino
Year householder moved into unit - Moved in 1995 to 1998 (%) - American Indian and Alaska Native
Year householder moved into unit - Moved in 1995 to 1998 (%) - Multirace
Year householder moved into unit - Moved in 1995 to 1998 (%) - Other Race
Year householder moved into unit - Moved in 1990 to 1994 (%)
Year householder moved into unit - Moved in 1990 to 1994 (%) - White
Year householder moved into unit - Moved in 1990 to 1994 (%) - Black or African American
Year householder moved into unit - Moved in 1990 to 1994 (%) - Asian
Year householder moved into unit - Moved in 1990 to 1994 (%) - Hispanic or Latino
Year householder moved into unit - Moved in 1990 to 1994 (%) - American Indian and Alaska Native
Year householder moved into unit - Moved in 1990 to 1994 (%) - Multirace
Year householder moved into unit - Moved in 1990 to 1994 (%) - Other Race
Year householder moved into unit - Moved in 1980 to 1989 (%)
Year householder moved into unit - Moved in 1980 to 1989 (%) - White
Year householder moved into unit - Moved in 1980 to 1989 (%) - Black or African American
Year householder moved into unit - Moved in 1980 to 1989 (%) - Asian
Year householder moved into unit - Moved in 1980 to 1989 (%) - Hispanic or Latino
Year householder moved into unit - Moved in 1980 to 1989 (%) - American Indian and Alaska Native
Year householder moved into unit - Moved in 1980 to 1989 (%) - Multirace
Year householder moved into unit - Moved in 1980 to 1989 (%) - Other Race
Year householder moved into unit - Moved in 1970 to 1979 (%)
Year householder moved into unit - Moved in 1970 to 1979 (%) - White
Year householder moved into unit - Moved in 1970 to 1979 (%) - Black or African American
Year householder moved into unit - Moved in 1970 to 1979 (%) - Asian
Year householder moved into unit - Moved in 1970 to 1979 (%) - Hispanic or Latino
Year householder moved into unit - Moved in 1970 to 1979 (%) - American Indian and Alaska Native
Year householder moved into unit - Moved in 1970 to 1979 (%) - Multirace
Year householder moved into unit - Moved in 1970 to 1979 (%) - Other Race
Year householder moved into unit - Moved in 1969 or earlier (%)
Year householder moved into unit - Moved in 1969 or earlier (%) - White
Year householder moved into unit - Moved in 1969 or earlier (%) - Black or African American
Year householder moved into unit - Moved in 1969 or earlier (%) - Asian
Year householder moved into unit - Moved in 1969 or earlier (%) - Hispanic or Latino
Year householder moved into unit - Moved in 1969 or earlier (%) - American Indian and Alaska Native
Year householder moved into unit - Moved in 1969 or earlier (%) - Multirace
Year householder moved into unit - Moved in 1969 or earlier (%) - Other Race
Housing units lacking complete plumbing facilities (%)
Housing units lacking complete kitchen facilities (%)
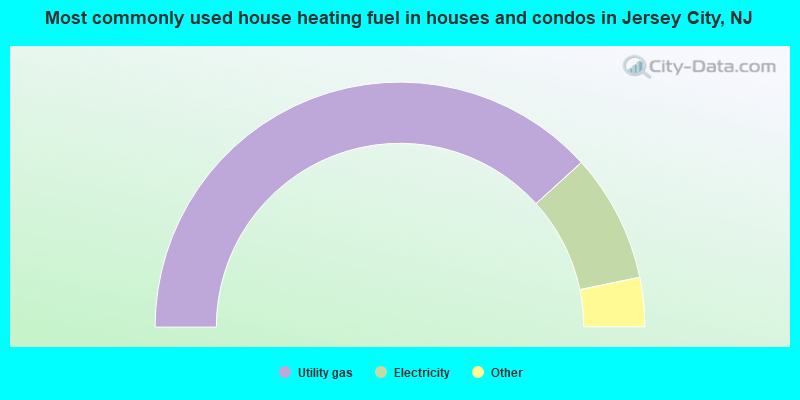
House heating fuel used in houses and condos - Utility gas (%)
House heating fuel used in houses and condos - Bottled, tank, or LP gas (%)
House heating fuel used in houses and condos - Electricity (%)
House heating fuel used in houses and condos - Fuel oil, kerosene, etc. (%)
House heating fuel used in houses and condos - Coal or coke (%)
House heating fuel used in houses and condos - Wood (%)
House heating fuel used in houses and condos - Solar energy (%)
House heating fuel used in houses and condos - Other fuel (%)
House heating fuel used in houses and condos - No fuel used (%)
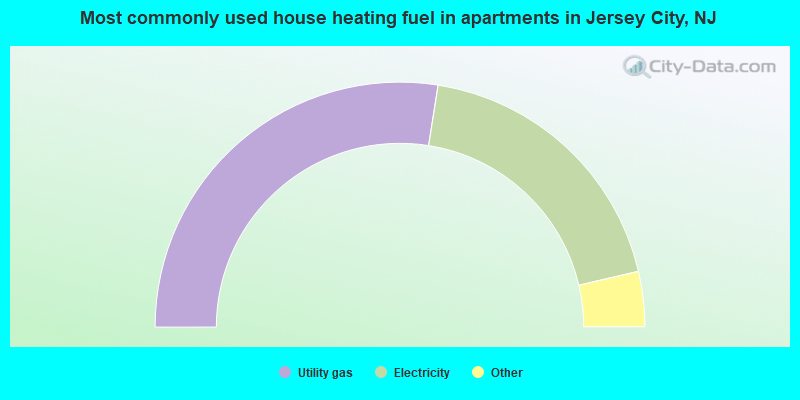
House heating fuel used in apartments - Utility gas (%)
House heating fuel used in apartments - Bottled, tank, or LP gas (%)
House heating fuel used in apartments - Electricity (%)
House heating fuel used in apartments - Fuel oil, kerosene, etc. (%)
House heating fuel used in apartments - Coal or coke (%)
House heating fuel used in apartments - Wood (%)
House heating fuel used in apartments - Solar energy (%)
House heating fuel used in apartments - Other fuel (%)
House heating fuel used in apartments - No fuel used (%)
Median year house/condo built: 1953Median year apartment built: 1979Household type by relationship:
Households: 286,661
Male householders: 69,004 (23,089 living alone ), Female householders: 61,209 (22,538 living alone )43,347 spouses (42,849 opposite-sex spouses ), 13,453 unmarried partners , (12,685 opposite-sex unmarried partners ), 63,663 children (61,613 natural , 738 adopted , 1,312 stepchildren ), 7,428 grandchildren , 4,539 brothers or sisters , 6,399 parents , 0 foster children , 5,432 other relatives , 9,846 non-relatives In group quarters: 2,341
Size of family households: 30,157 2-persons , 20,099 3-persons , 9,243 4-persons , 4,366 5-persons , 2,280 6-persons , 1,737 7-or-more-persons .
Size of nonfamily households: 45,627 1-person , 13,386 2-persons , 2,960 3-persons , 166 4-persons , 132 5-persons , 60 7-or-more-persons .
27,616 married couples with children. single-parent households (2,547 men , 12,528 women ).
50.4% of residents of Jersey City speak English at home. of residents speak Spanish at home (58% speak English very well , 19% speak English well , 16% speak English not well , 7% don't speak English at all ).of residents speak other Indo-European language at home (82% speak English very well , 11% speak English well , 5% speak English not well , 2% don't speak English at all ).of residents speak Asian or Pacific Island language at home (65% speak English very well , 27% speak English well , 7% speak English not well , 1% don't speak English at all ).of residents speak other language at home (67% speak English very well , 19% speak English well , 14% speak English not well ).
Foreign born population: 113,619 (39.6%)of them are naturalized citizens )
Median number of rooms in houses and condos:
Median number of rooms in apartments
Owner-occupied Renter-occupied
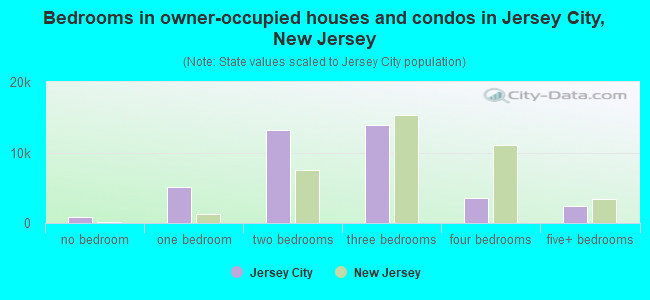
Bedrooms in owner-occupied houses and condos in Jersey City, New Jersey
850 no bedroom 5,128 1 bedroom 13,153 2 bedrooms 13,833 3 bedrooms 3,483 4 bedrooms 2,380 5+ bedrooms
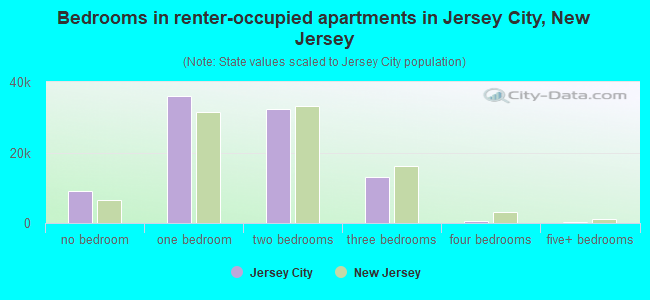
Bedrooms in renter-occupied apartments in Jersey City, New Jersey
9,140 no bedroom 35,968 1 bedroom 32,268 2 bedrooms 12,975 3 bedrooms 676 4 bedrooms 359 5+ bedrooms
Owner-occupied Renter-occupied
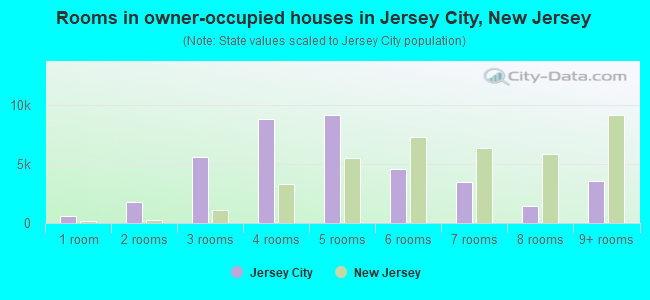
Rooms in owner-occupied houses in Jersey City, New Jersey
610 1 room 1,732 2 rooms 5,538 3 rooms 8,799 4 rooms 9,118 5 rooms 4,542 6 rooms 3,476 7 rooms 1,475 8 rooms 3,537 9+ rooms
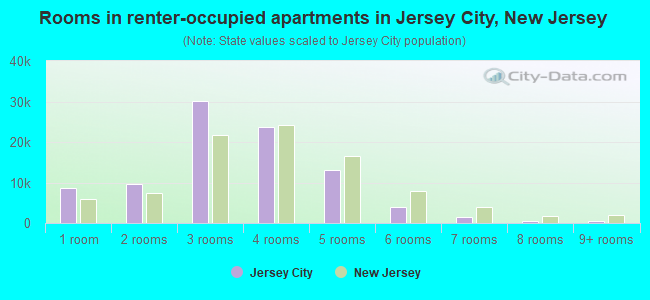
Rooms in renter-occupied apartments in Jersey City, New Jersey
8,628 1 room 9,711 2 rooms 30,185 3 rooms 23,585 4 rooms 13,112 5 rooms 3,887 6 rooms 1,420 7 rooms 376 8 rooms 482 9+ rooms
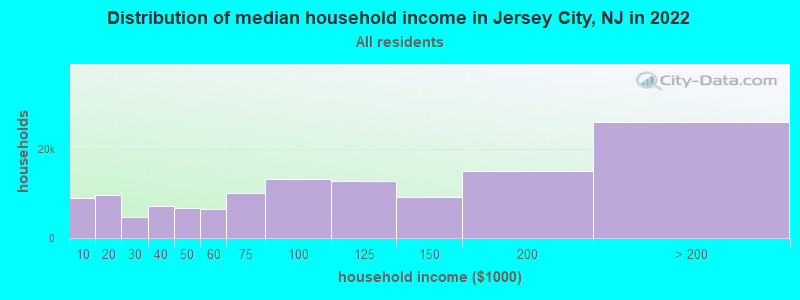
Jersey City, NJ household income distribution 9,056 Less than $10,0009,702 $10,000 to $19,9994,670 $20,000 to $29,9997,113 $30,000 to $39,9996,718 $40,000 to $49,9996,493 $50,000 to $59,99910,182 $60,000 to $74,99913,247 $75,000 to $99,99912,745 $100,000 to $124,9999,219 $125,000 to $149,99915,089 $150,000 to $199,99925,979 $200,000 or more
Home value of owner - occupied houses in 2022 in Jersey City, NJ 711 Less than $10,000155 $10,000 to $14,9999 $15,000 to $19,99910 $20,000 to $24,99954 $25,000 to $29,999153 $30,000 to $34,99926 $35,000 to $39,99967 $40,000 to $49,999107 $50,000 to $59,99924 $60,000 to $69,99997 $70,000 to $79,999145 $80,000 to $89,99987 $90,000 to $99,999716 $100,000 to $124,999209 $125,000 to $149,999395 $150,000 to $174,999402 $175,000 to $199,9991,428 $200,000 to $249,9991,154 $250,000 to $299,9994,817 $300,000 to $399,9996,134 $400,000 to $499,99911,450 $500,000 to $749,9994,787 $750,000 to $999,9992,413 $1,000,000 to $1,499,999886 $1,500,000 to $1,999,999869 $2,000,000 or moreRent paid by renters in 2022 in Jersey City, NJ 147 Less than $100717 $100 to $1492,014 $150 to $199474 $200 to $2491,170 $250 to $299684 $300 to $349266 $350 to $399713 $400 to $449821 $450 to $499258 $500 to $549542 $550 to $599518 $600 to $64965 $650 to $6991,812 $700 to $749633 $750 to $7992,499 $800 to $8992,570 $900 to $99910,916 $1,000 to $1,2499,146 $1,250 to $1,49919,356 $1,500 to $1,99910,945 $2,000 to $2,4999,062 $2,500 to $2,9996,342 $3,000 to $3,4998,695 $3,500 or more1,021 No cash rent
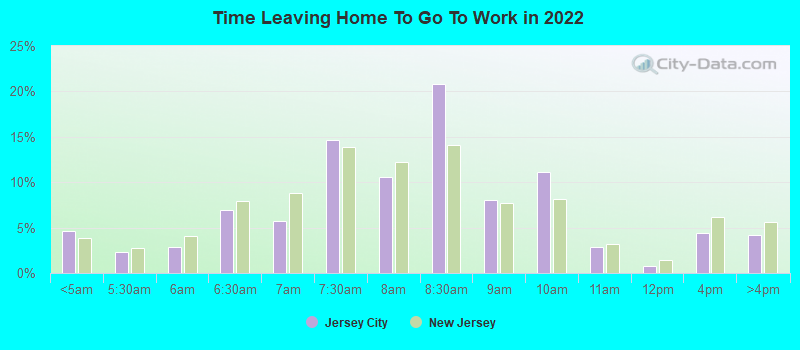
Percentage of workers working in this county: 56.9%Number of people working at home: 40,498 (24.9% of all workers )
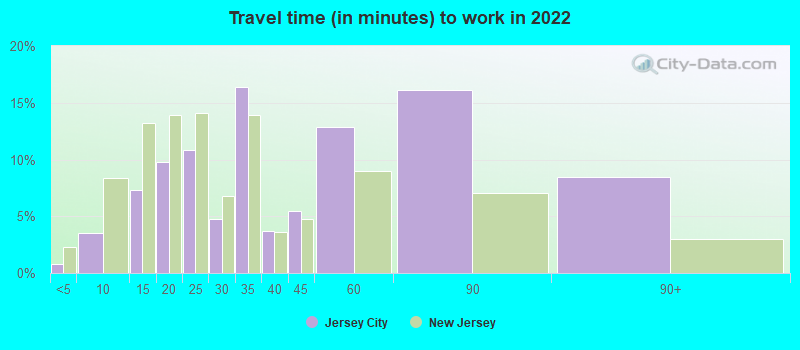
Travel time to work (commute)
Less than 5 minutes: 6495 to 9 minutes: 3,41410 to 14 minutes: 6,74815 to 19 minutes: 11,91020 to 24 minutes: 13,90725 to 29 minutes: 6,72530 to 34 minutes: 19,60035 to 39 minutes: 4,36840 to 44 minutes: 11,04845 to 59 minutes: 23,77960 to 89 minutes: 14,48690 or more minutes: 5,604
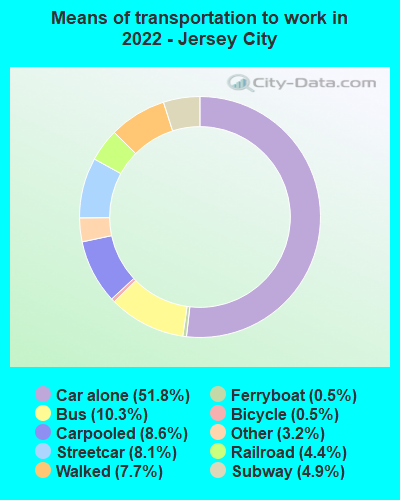
Means of transportation to work:
Drove a car alone: 55,670 (37.6%)Carpooled: 9,278 (6.3%)Bus : 11,075 (7.5%)Subway or elevated rail : 8,664 (5.9%)Long-distance train or commuter rail : 5,297 (3.6%)Light rail, streetcar or trolley : 4,726 (3.2%)Ferryboat: 558 (0.4%)Taxi: 3,392 (2.3%)Bicycle: 589 (0.4%)Walked: 8,319 (5.6%)Worked at home: 40,498 (27.4%)
Unemployment by race in 2022
Unemployment rate for White non-Hispanic residents 2.1% Males3.1% FemalesUnemployment rate for Black residents 5.0% Males5.4% FemalesUnemployment rate for American Indian and Alaska Native residents 5.6% Males36.1% FemalesUnemployment rate for Asian residents 1.0% Males2.9% FemalesUnemployment rate for other race residents 9.7% Males6.2% FemalesUnemployment rate for two or more race residents 4.1% Males3.0% FemalesUnemployment rate for Hispanic or Latino residents 6.8% Males5.5% Females
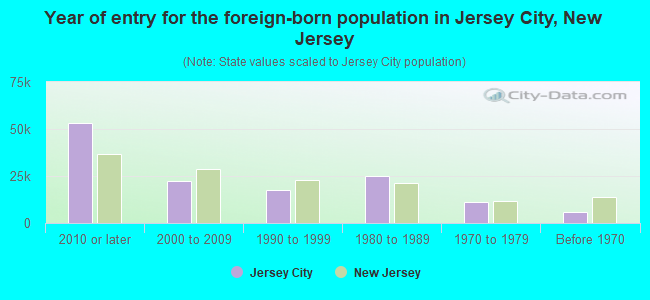
Year of entry for the foreign-born population in Jersey City, New Jersey
53,065 2010 or later 22,375 2000 to 2009 17,394 1990 to 1999 24,773 1980 to 1989 11,170 1970 to 1979 5,912 Before 1970
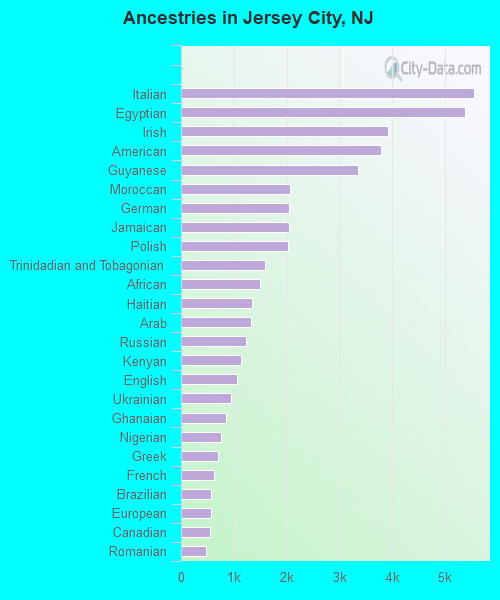
First ancestries reported:
Italian: 5,558 (2.8%)
Egyptian: 5,378 (2.7%)
Irish: 3,927 (2.0%)
American: 3,791 (1.9%)
Guyanese: 3,352 (1.7%)
Moroccan: 2,067 (1.1%)
German: 2,050 (1.0%)
Jamaican: 2,045 (1.0%)
Polish: 2,030 (1.0%)
Trinidadian and Tobagonian: 1,594 (0.8%)
African: 1,502 (0.8%)
Haitian: 1,337 (0.7%)
Arab: 1,325 (0.7%)
Russian: 1,234 (0.6%)
Kenyan: 1,145 (0.6%)
English: 1,060 (0.5%)
Ukrainian: 943 (0.5%)
Ghanaian: 859 (0.4%)
Nigerian: 761 (0.4%)
Greek: 698 (0.4%)
French: 623 (0.3%)
Brazilian: 577 (0.3%)
European: 573 (0.3%)
Canadian: 548 (0.3%)
Romanian: 474 (0.2%)
Lebanese: 472 (0.2%)
British West Indian: 410 (0.2%)
Hungarian: 343 (0.2%)
British: 311 (0.2%)
Turkish: 301 (0.2%)
Portuguese: 298 (0.2%)
West Indian: 271 (0.1%)
Ethiopian: 271 (0.1%)
Eastern European: 258 (0.1%)
Iranian: 243 (0.1%)
Australian: 226 (0.1%)
Bulgarian: 185 (0.09%)
Barbadian: 179 (0.09%)
Albanian: 171 (0.09%)
Dutch: 159 (0.08%)
Scottish: 154 (0.08%)
Palestinian: 146 (0.07%)
Lithuanian: 143 (0.07%)
Scotch-Irish: 114 (0.06%)
Swedish: 111 (0.06%)
Slavic: 104 (0.05%)
Austrian: 102 (0.05%)
Liberian: 98 (0.05%)
Norwegian: 91 (0.05%)
Danish: 70 (0.04%)
Israeli: 58 (0.03%)
Zimbabwean: 57 (0.03%)
Croatian: 57 (0.03%)
Sierra Leonean: 55 (0.03%)
Senegalese: 54 (0.03%)
Finnish: 52 (0.03%)
Yugoslavian: 51 (0.03%)
Sudanese: 49 (0.02%)
Czech: 44 (0.02%)
Belgian: 38 (0.02%)
Serbian: 38 (0.02%)
Bahamian: 37 (0.02%)
South African: 35 (0.02%)
Afghan: 35 (0.02%)
French Canadian: 33 (0.02%)
Cypriot: 25 (0.01%)
Macedonian: 24 (0.01%)
U.S. Virgin Islander: 21 (0.01%)
Swiss: 20 (0.01%)
Northern European: 19 (0.01%)
Slovak: 19 (0.01%)
Slovene: 15 (0.01%)
Latvian: 11 (0.01%)
Most common places of birth for foreign-born residents (%): India Jersey City:
22.0% (26,512)New Jersey:
12.8% (274,609)
Dominican Republic Jersey City:
10.2% (12,251)New Jersey:
9.7% (209,055)
Philippines Jersey City:
9.0% (10,866)New Jersey:
4.0% (85,934)
China, excluding Hong Kong and Taiwan Jersey City:
6.8% (8,226)New Jersey:
3.7% (78,969)
Egypt Jersey City:
4.3% (5,151)New Jersey:
1.6% (33,678)
Guyana Jersey City:
3.0% (3,571)New Jersey:
1.2% (26,173)
Ecuador Jersey City:
2.7% (3,248)New Jersey:
4.4% (95,275)
Pakistan Jersey City:
2.2% (2,626)New Jersey:
1.3% (27,580)
Honduras Jersey City:
1.7% (2,105)New Jersey:
1.7% (37,335)
Trinidad and Tobago Jersey City:
1.7% (2,072)New Jersey:
0.7% (15,533)
Morocco Jersey City:
1.7% (2,011)New Jersey:
0.3% (5,621)
Colombia Jersey City:
1.6% (1,952)New Jersey:
4.2% (90,817)
Korea Jersey City:
1.6% (1,886)New Jersey:
3.3% (70,512)
Place of birth for U.S.-born residents:
This state: 98,873Other state: 63,289Northeast: 43,039Midwest: 4,934South: 11,134West: 4,182 88.0% of Jersey City residents lived in the same house 1 years ago.
Out of people who lived in different houses, 33.7% lived in this county.
Out of people who lived in different counties, 22.1% lived in New Jersey.
Jersey City:
88.0%State average:
90.4%
Education attainment for males 25 years and older:
No schooling: 2,101Nursery to 4th grade: 6195th and 6th grade: 6987th and 8th grade: 7519th grade: 89210th grade: 61011th grade: 1,48012th grade, no diploma: 2,106High school graduate (or equivalency): 18,518Less than 1 year of college: 4,609Some college more than 1 year, no degree: 10,248Associate degree: 4,698Bachelor's degree: 30,392Master's degree: 22,396Professional school degree: 3,643Doctorate degree: 1,870
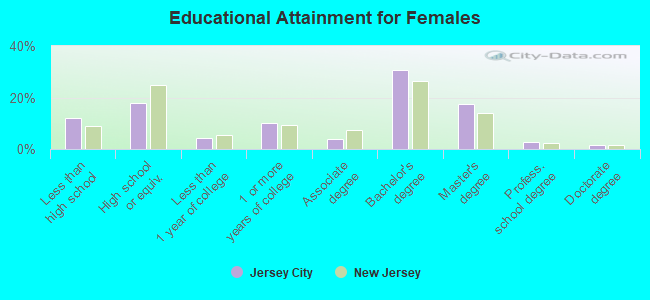
Education attainment for females 25 years and older:
No schooling: 2,981Nursery to 4th grade: 6825th and 6th grade: 1,4887th and 8th grade: 1,9489th grade: 46110th grade: 50511th grade: 1,69312th grade, no diploma: 3,185High school graduate (or equivalency): 19,440Less than 1 year of college: 4,515Some college more than 1 year, no degree: 11,188Associate degree: 4,207Bachelor's degree: 33,227Master's degree: 18,914Professional school degree: 2,946Doctorate degree: 1,524
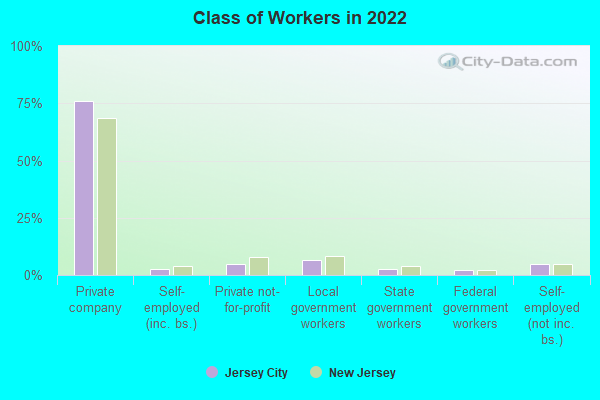
Housing units in structures:
One, detached: 8,522One, attached: 10,676Two: 25,8303 or 4: 18,0665 to 9: 15,38210 to 19: 7,53120 to 49: 12,02650 or more: 37,894Housing units lacking complete plumbing facilities in 2022: 0.8%Housing units lacking complete kitchen facilities in 2022: 1.6%House/condo owner moved in on average 12 years ago
Renter moved in on average 3 years ago
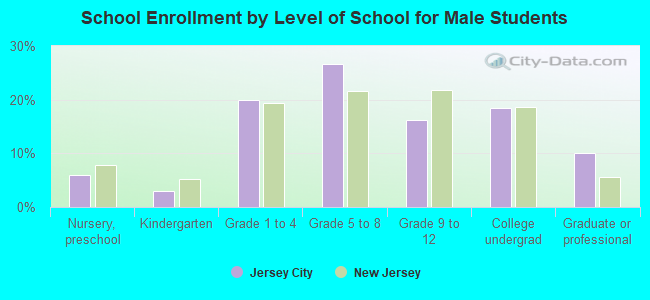
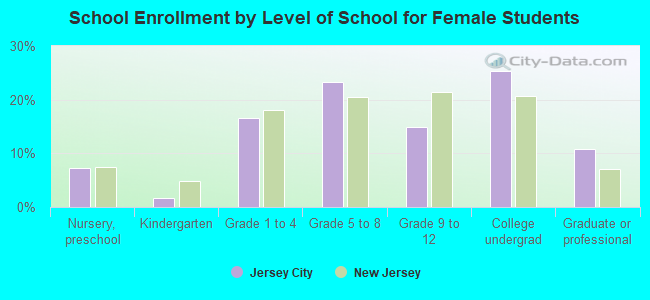
Private vs. public school enrollment:
Students in private schools in grades 1 to 8 (elementary and middle school): 2,430 Here:
9.6%New Jersey:
12.3%
Students in private schools in grades 9 to 12 (high school): 886 Here:
9.8%New Jersey:
13.1%
Students in private undergraduate colleges: 4,544 Here:
36.5%New Jersey:
33.2%